

Abstract
Standard magnetic resonance imaging approaches offer high‐resolution but indirect measures of neural activity, limiting understanding of the physiological processes associated with imaging findings. Here, we used calibrated functional magnetic resonance imaging during the resting state to recover low‐frequency fluctuations of the cerebral metabolic rate of oxygen (CMRO2). We tested whether functional connections derived from these fluctuations exhibited organization properties similar to those established by previous standard functional and anatomical connectivity studies. Seventeen participants underwent 20 min of resting imaging during dual‐echo, pseudocontinuous arterial spin labeling, and blood‐oxygen‐level dependent (BOLD) signal acquisition. Participants also underwent a 10 min normocapnic and hypercapnic procedure. Brain‐wide, CMRO2 low‐frequency fluctuations were subjected to graph‐based and voxel‐wise functional connectivity analyses. Results demonstrated that connections derived from resting CMRO2 fluctuations exhibited complex, small‐world topological properties (i.e., high integration and segregation, cost efficiency) consistent with those observed in previous studies using functional and anatomical connectivity approaches. Voxel‐wise CMRO2 connectivity also exhibited spatial patterns consistent with four targeted resting‐state subnetworks: two association (i.e., frontoparietal and default mode) and two perceptual (i.e., auditory and occipital‐visual). These are the first findings to support the use of calibration‐derived CMRO2 low‐frequency fluctuations for detecting brain‐wide organizational properties typical of healthy participants. We discuss interpretations, advantages, and challenges in using calibration‐derived oxygen metabolism signals for examining the intrinsic organization of the human brain.
Keywords: fMRI, functional connectivity, oxygen metabolism, resting state
Calibrated imaging was used during the resting state to recover low‐frequency fluctuations of the cerebral metabolic rate of oxygen. Oxygen metabolism signals demonstrate complex, small‐world topologies and subnetwork profiles consistent with previous anatomical and functional connectivity studies

Calibrated functional magnetic resonance imaging (fMRI) uses blood‐oxygen‐level dependent (BOLD) signal, along with blood flow or volume signals to recover a signal capturing population‐level neural tissue changes in O2‐tension. Recovering this cerebral metabolic rate of oxygen (CMRO2) provides at least three advantages relative to more common functional imaging signals: (a) physiological interpretation, (b) proximity to neuronal activity, and (c) it circumvents the vascular confounds of BOLD signal. However, these advantages are accompanied by lower spatial and temporal resolution, and decreased signal quality compared with BOLD‐based imaging. Given these limitations, we sought to determine whether functional connections from low‐frequency CMRO2 fluctuations recovered during the resting state could detect organization properties typical of the healthy brain.
Calibration‐derived CMRO2 promises physiological specificity, closer proximity to neuronal activity, and, in some cases, greater validity of functional imaging signals than the BOLD signal (see Buxton, 2010; Gauthier & Fan, 2018; Germuska & Wise, 2018; Hoge, 2012; Iannetti and Wise, 2007). Specifically, calibration‐derived CMRO2 is closely associated with measures of electrical and chemical neuronal activity (e.g., Herman, Sanganahalli, Blumenfeld, & Hyder, 2009; Herman, Sanganahalli, Blumenfeld, Rothman, & Hyder, 2013; Hyder, 2004; Hyder et al., 2001; Hyder, Rothman, & Shulman, 2002; Lin, Fox, Hardies, Duong, & Gao, 2010; Smith et al., 2002). Compared to BOLD signal, calibration‐derived CMRO2 has been shown to have between 2 and 8 times greater predictive ability for neuronal activation measures (i.e., local field potentials, multiunit activity; Herman et al., 2013). Additionally, CMRO2 signals may provide information beyond BOLD or cerebral blood flow (CBF) to inform understanding of pathophysiological processes and aspects of neurocognitive functioning (Hubbard, Sanchez Araujo et al., 2017; Hubbard, Turner et al., 2017; Hutchison, Lu, & Rypma, 2013; Mohtasib et al., 2012; West et al., 2020; see Abdelkarim et al., 2019; Iannetti and Wise, 2007).
Despite its promise, calibration‐derived CMRO2 is limited in spatial and temporal resolution, as well as signal quality relative to the more commonly used BOLD signal. These limitations could be particularly problematic when considering use of calibration‐derived CMRO2 to examine resting‐state functional connectivity because functional connectivity is sensitive to factors such as sampling rate and within‐participant spatiotemporal variability (Birn, 2012; Hallquist, Hwang, & Luna, 2013; Power, Barnes, Snyder, Schlaggar, & Petersen, 2012; Tomasi et al., 2017; Wu et al., 2009). For example, one study attempted resting‐state functional connectivity analyses using positron emission tomography (PET)‐based dynamic glucose metabolism signals, acquired with an effective sampling rate of 0.01 Hz (Tomasi et al., 2017). PET glucose measurements failed to detect common resting‐state subnetworks often observed using BOLD‐based fMRI, suggesting that the reduced rate at which glucose was sampled compromised the ability to detect established resting‐state organizational properties. Although calibration‐derived CMRO2 sampling rates are around 25 times greater than those currently possible for PET‐based dynamic glucose measurements, current CMRO2 sampling rates are still between two and eight times slower than common BOLD sampling rates (e.g., 0.25 Hz vs. ~1–2 Hz). Along with decreased temporal resolution, calibration‐derived CMRO2 is a lower‐quality signal relative to BOLD. For instance, Wu et al. (2009) assessed calibration‐derived CMRO2 in resting and task‐based contexts. These authors used seed‐based functional connectivity analyses to demonstrate that CMRO2 signals could detect spatial patterns of two resting‐state subnetworks (i.e., default mode and occipital‐visual networks). However, functional connections from CMRO2 were appreciably weaker than those observed using BOLD signal. These authors noted that differences in connection strength probably arose because BOLD had a contrast‐to‐noise ratio approximately two times greater than CMRO2 (Wu et al., 2009).
To date, only two studies have used calibration‐derived CMRO2 to examine resting‐state functional connectivity (Champagne, Coverdale, Nashed, Fernandez‐Ruiz, & Cook, 2019; Wu et al., 2009). Although these studies were pioneering efforts, their consideration of only 1–2 subnetworks provided limited information regarding the applicability of calibration‐derived CMRO2 for interrogating the vast complexities of the brain‐wide organization. This gap is significant because such research is needed to support or oppose using this more physiologically‐specific signal to assess, for instance, differences in cognitive abilities, lifespan developmental changes, and the effects of numerous pathologies on the brain‐wide organization (e.g., Achard & Bullmore, 2007; De Asis‐Cruz, Bouyssi‐Kobar, Evangelou, Vezina, & Limperopoulos, 2015; Pandit et al., 2013; van den Heuvel, Stam, Kahn, & Hulshoff Pol, 2009; see Bassett & Bullmore, 2009; Barbey, 2018; Whitfield‐Gabrieli & Ford, 2012). This study is the first to evaluate whether functional connections from low‐frequency fluctuations of calibration‐derived CMRO2 could detect expansive brain‐wide organization properties consistent with those previously established using anatomical or BOLD‐based functional connectivity methods.
First, we examined the topological properties of calibration‐derived oxygen metabolism networks (OMN). We tested whether OMNs exhibited segregation and integration properties consistent with complex, small‐world topologies—a common network architecture observed in anatomical and functional connectivity studies (Achard & Bullmore, 2007; Kaiser & Hilgetag, 2006; Humphries & Gurney, 2008; van den Heuvel, Bullmore, & Sporns, 2016; see Bullmore & Sporns, 2009, 2012). Comparative network analyses were used between the OMNs and simulations of canonical networks (i.e., random and lattice networks; e.g., Humphries & Gurney, 2008; Rubinov, Ypma, Watson, & Bullmore, 2015; see Sporns, Chialvo, Kaiser, & Hilgetag, 2004). We tested the hypothesis that, like previous findings of anatomical and functional connectivity, OMNs exhibited greater segregation properties than random networks and greater integration properties than lattice networks (see Sporns et al., 2004; cf. Watts & Strogatz, 1998). Small‐world topologies additionally provide a high degree of information integration relative to the number of connections required to achieve this integration (i.e., cost efficiency; Achard & Bullmore, 2007; De Asis‐Cruz et al., 2015; see Bullmore & Sporns, 2012). Thus, we also tested whether OMN topologies demonstrated cost‐efficiency.
Second, we examined whether voxel‐wise CMRO2‐based functional connections exhibited spatial patterns consistent with two association (i.e., frontoparietal and default mode) and two perceptual (i.e., auditory and occipital‐visual) resting‐state subnetworks. Calibration‐derived CMRO2 relies upon BOLD and CBF signals, thus, these subnetworks were targeted because they were previously shown to be reproducible using both BOLD‐ and CBF‐based functional connectivity (Jann et al., 2015). CMRO2 subnetwork connectivity patterns were derived using seed regions related to the targeted subnetworks (e.g., precuneus seed for default mode network). Voxel‐wise CMRO2 connectivity patterns with subnetwork seeds were compared with the voxel‐wise connectivity patterns produced using comparable seeds within the Neurosynth online platform which provided resting‐state BOLD data from 1,000 participants (Yarkoni, Poldrack, Nichols, Van Essen, & Wager, 2011).
1. METHOD AND MATERIALS
1.1. Participants and procedure
Seventeen, cognitively‐typical (MeanMoCA = 28.93, range = 25–30), right‐handed, young participants (Meanage = 23.41, range = 19–31; 41% Female) completed this study. Participants reported no history of significant neurological trauma or disease, cardiac, respiratory, or vascular disease. Participants were asked to abstain from caffeine use up to 2 hr before scanning (e.g., Liau, Perthen, & Liu, 2008; Perthen, Lansing, Liau, Liu, & Buxton, 2007). Two participants' functional images failed to adequately register to standard space after repeated attempts and were discarded (N = 15). Procedures were approved by the University of Texas Southwestern Medical Center Institutional Review Board. Informed consent was obtained from each participant. This was a single cohort, cross‐sectional, study design. Sample size was determined based upon single‐cohort sizes of other calibrated imaging studies (e.g., Ances et al., 2009; Ances, Vaida, Ellis, & Buxton, 2011; Hoge et al., 1999; Hubbard, Sanchez Araujo et al., 2017; Hubbard, Turner et al., 2017; Hutchison et al., 2013; Wu et al., 2009).
Imaging data were collected during a single session on a 3 Tesla MRI scanner equipped with a 32‐channel head coil (Philips Healthcare, Best, The Netherlands). Pseudocontinuous arterial spin labeling (pCASL) and BOLD images (together referred to as dual‐echo images) were acquired using an interleaved‐echo scanning protocol (see Lu & van Zijl, 2005). Twenty minutes of dual‐echo images were acquired while participants rested and were instructed to keep their eyes open and fixate on a white cross centered on a black screen (resting‐state images). Dual‐echo images were also acquired during a 10‐min room air and a 5% carbon dioxide (CO2) solution breathing‐challenge run. These and similar procedures, sequences, biophysical modeling, and breathing‐challenges recover reliable measurements of steady‐state CMRO2 changes (see Bright, Croal, Blockley, & Bulte, 2019; Buxton, 2010; Hoge, 2012; Hubbard, Sanchez Araujo et al., 2017; Hubbard, Turner et al., 2017; Hutchison et al., 2013).
1.2. CO2 challenge and spontaneous breathing circuit
CO2 challenges permit estimation of a theoretical maximum change in BOLD signal, M. M is used to scale BOLD signal and recover CMRO2 (see Bright et al., 2019; Hoge, 2012; Hubbard, Sanchez Araujo et al., 2017; Hubbard, Turner et al., 2017; Hutchison et al., 2013). Participants underwent normocapnic (room air; ~.03% CO2: 21% O2: 78% N2) and hypercapnic (5% CO2: 21% O2: 74% N2) conditions during dual‐echo imaging (see Figure 1). Vital signs were monitored throughout this procedure. After CO2 challenge, the breathing apparatus and physiological monitors were removed. Participants then underwent rest‐state imaging procedures.
FIGURE 1.

Diagram of spontaneous breathing circuit and CO2‐challenge procedure. Before the gurney entered the bore of the magnet, a pulse‐oximetry sensor was placed on the participant's index finger, and participants were fitted with a two‐way non‐rebreathing valve/mouthpiece (2,600 series, by Hans Rudolph, KS, USA) and nose‐clip. The two‐way, non‐rebreathing valve, emitted exhaled air and also allowed room air or the CO2‐solution (depending on challenge phase) to flow inward. During scanning, portions of expired gases were sampled through accessory tubing that flowed to a capnograph (sampling End‐tidal CO2 [EtCO2] and breath rate [BR]) and heart rate (HR) and peripheral oxygen saturation (SpO2) were sampled using pulse oximetry. EtCO2, SpO2, BR, and HR measures were collected using capnography (Capnogard, Model 1,265, by Novametrix Medical Systems, CT, USA) and pulse‐oximetry (MEDRAD, PA, USA). Normocapnic conditions occurred for 4 min wherein a valve attached to a hose on the two‐way mouthpiece remained open so that the participant received room air. After 4 min of room‐air breathing the three‐way valve was opened, blocking room air, and allowing the 5% CO2‐solution to flow in from a 200 L Douglas Bag for 6 min
1.3. Image parameters
Sequences were similar to those used to recover CMRO2 detailed elsewhere (Hubbard, Sanchez Araujo et al., 2017; Hubbard, Turner et al., 2017). Briefly, 75 dual‐echo volumes were acquired during the breathing‐challenge run. The pCASL sequence consisted of a labeling duration of 1,550 ms and a post‐labeling delay of 1,500 ms, followed by multi‐slice 2D acquisitions of echo‐planar images (EPI) at two TE values of 13 and 30 ms, respectively. The first echo was used for CBF and the second echo was used for BOLD. Other imaging parameters were: flip angle = 90°, TR = 4,006 ms, 3.44 × 3.44 × 5 mm voxel with 0 mm gap, 18 slices, labeling gap = 106.5 mm. One‐hundred and fifty dynamics of dual‐echo volumes were acquired while participants were at rest. Dual‐echo resting volumes were acquired using the same sequence as room‐air/breathing‐challenge run (detailed above). One T1‐weighted magnetization‐prepared rapid acquisition gradient‐echo (MPRAGE) image was also acquired for each participant: 12° flip angle, TR = 8.3 ms, TE = 3.8 ms, short‐interval 2,100 ms, 1 mm3 isovoxel, 160 slices.
1.4. Image processing workflows and CMRO2 recovery
1.4.1. Processing and CMRO2 recovery
CBF was interpolated from the interleaved label and control pCASL images using the surround‐subtraction method (Liu & Wong, 2005; Lu, Donahue, & van Zijl, 2006). BOLD data were interpolated via pairwise averaging of temporally‐adjacent images (Hubbard, Sanchez Araujo et al., 2017; Hubbard, Turner et al., 2017; Hutchison et al., 2013). Dual‐echo images were preprocessed using common resting‐state operations (e.g., Behzadi, Restom, Liau, & Liu, 2007; Joon Jo et al., 2013). Specifically, large spikes (≥2.5 SD) in dual‐echo time series owing to motion or potentially non‐neural physical events were interpolated to the average of their nearest temporal‐neighbors (scrub‐interpolation) using an automated algorithm. Data were then rigid‐body corrected for participant motion. Dual‐echo images were linearly aligned to a BOLD volume and then registered using an affine‐transformation to the participant's MPRAGE. Images were then nonlinearly warped to a standard stereotaxic space (Talaraich & Tournoux, 1988). A bandpass filter (0.01–0.1 Hz) was applied to dual‐echo signals. CBF time series were lagged two time points to account for temporal differences in BOLD‐CBF interpolations (cf. Champagne et al., 2019). CMRO2 was recovered from the filtered and spatially/temporally aligned dual‐echo signals. Motion parameters and the first five principal components of white matter and cerebral spinal fluid signals (Joon Jo et al., 2013) were removed from CMRO2 images, and a separate bandpass filter (0.01–0.1 Hz) was applied. Global signal regression was not utilized here (Behzadi et al., 2007; see Murphy & Fox, 2017).
Detailed theory and formalisms of the deoxyhemoglobin dilution model for recovering CMRO2 from BOLD and CBF are given elsewhere (Davis, Kwong, Weiskoff, & Rosen, 1998; Hoge et al., 1999; Hubbard, Sanchez Araujo et al., 2017; Hubbard, Turner et al., 2017; Hutchison et al., 2013; see Bright et al., 2019; Buxton, 2010; Hoge, 2012). Briefly, BOLD signal reflecting a confluence of blood flow/volume and oxygen metabolism changes may be decomposed to recover CMRO2, if several other parameters are measured and several empirical constants are assumed (see Formula 1.1).
Processed BOLD and CBF images, along with a dynamic adaptation of the deoxyhemoglobin dilution model were used to recover low‐frequency fluctuations in CMRO2. Here CMRO2t reflects dynamic changes in voxel‐level oxygen metabolism:
| (1.1) |
where subscript t reflects a voxel time series at time t. Thus, CMRO2t reflects the mean‐scaled amplitude of voxel oxygen metabolism at time t. Although unlikely, to avoid complex numbers if CBFt was negative, the absolute value of CBFt was used and then the sign (+/−) was corrected by multiplying the derived CMRO2t term by |CBFt| divided by CBFt (equaling 1 or − 1). This step allowed the model to recover real instead of complex values for CMRO2t, but did not modify the absolute values of CMRO2t. There were ~ 110 M (voxel × time × participant) timepoints for CBF, thus, this correction was applied in anticipation of some anomalous CBFt.
M was derived at each voxel from the CO2‐challenge using the deoxyhemoglobin‐dilution model of BOLD signal change (Davis et al., 1998; Hoge et al., 1999; Hubbard, Sanchez Araujo et al., 2017; Hubbard, Turner et al., 2017; Hutchison et al., 2013) and using the 50th percentile values of BOLD and CBF of room air breathing compared to the 95th percentile values of BOLD and CBF during the CO2‐challenge. This procedure assured that average normocapnic signal fluctuations were compared to maximum (but not improbable) hypercapnic fluctuations. α was assumed equal to .38 (Grubb, Raichle, Eichling, & Ter‐Pogossian, 1974) and β was assumed equal to 1.33 (Lu & van Zijl, 2005). Negative M voxels were removed to further eliminate misclassified or noisy voxels from resting images (cf. Lajoie, Tancredi, & Hoge, 2016). Thus, M served to recover CMRO2t and as a spatial filter used to remove voxels which, due to their tissue heterogeneity or noise levels, would probably not be optimal for accurately recovering CMRO2. On average, 15% of voxels (range = 3–35%) per participants' whole‐brain mask were removed using M‐filtering. This procedure resulted in an average of 24,559.67 voxels per participant (range = 18,121–27,742 voxels). As expected, most voxels removed by M‐filtering were in low‐signal gray matter areas (i.e., infratentorial, inferior orbital, and CSF‐boundary voxels) or white matter voxels. Figure S1 demonstrates the proportion of filtered voxels across participants in the whole‐brain mask.
1.4.2. Node and connection workflows
CMRO2 data were processed using two workflows (i.e., node and connection workflows). The majority of processing steps were common to both workflows (see Processing and CMRO 2 Recovery). However, these workflows fulfilled different purposes and thus differed in their use of the M‐filter and spatial smoothing.
1.4.3. Node workflow
The goal of the node workflow was to segment participants' CMRO2 images into discrete gray matter regions of interest, thus forming the nodes of the OMN. In order to create a CMRO2‐based segmentation map we used the spatially‐constrained spectral clustering method (Craddock, James, Holtzheimer III, Hu, & Mayberg, 2012). This method delineated nodes based upon group‐wide similarities in spatially‐contiguous voxel correlations between participants' low‐frequency, resting CMRO2 fluctuations in gray matter voxels. The recommended two‐step approach was applied that required clusters of spatially‐contiguous voxels at both the participant‐ and group‐levels (Craddock et al., 2012). At the participant‐level, the node workflow needed to supplement a small number of gray matter voxels that were removed by the M‐filter. Here, CMRO2 fluctuations within the M‐filtered voxels were estimated by using a participant's BOLD and CBF signals within this voxel, and the average M‐value from their gray matter voxels that survived filtering. In doing so, the required spatial contiguity was retained for gray matter voxels. At the group‐level, a contiguous gray matter mask was also required. Here, a binary group mask was created retaining supra‐tentorial voxels wherein all participants had a gray matter voxel represented. Supra‐tentorial gray matter was targeted because infra‐tentorial areas had few contiguous voxels both within and between participants, as these areas were largely affected by signal loss. In this workflow, spatial smoothing of each participant's CMRO2 voxel time series (6 mm FWHM Gaussian kernel) was undertaken within the group mask to ensure that only data that were used in the final spectral analysis (i.e., those that were part of the group mask) contributed to the individual voxel time series used in this analysis.
1.4.4. Connection workflow
The purpose of the connection workflow was to recover low‐frequency fluctuations in CMRO2 for functional connectivity analyses. Here, spatial contiguity of voxels was not required, thus CMRO2 low‐frequency fluctuations were only recovered from voxels that survived M‐filtering. Therefore, in contrast to the node workflow, no M‐values were imputed. Also in contrast to the node workflow, because a spatially‐contiguous group mask was not required, spatial smoothing was performed within the participant's brain mask using a 6 mm FWHM Gaussian kernel.
1.5. OMN construction
1.5.1. Nodes
Nodes (n) were determined by segmenting gray matter into 200 cortical and subcortical regions using spatially‐constrained spectral clustering of CMRO2 fluctuations (see Node Workflow; Craddock et al., 2012). A 200‐node solution was chosen consistent with previous work, to generate a segmentation scheme to, as precisely as possible, represent local functional connectivity patterns, while also maintaining anatomical interpretation (Craddock et al., 2012). Six nodes were discarded from the network due to their locations in low signal regions (e.g., ventral regions, frontal/temporal poles). Thus, n was equal to 194 (Figure 2).
1.5.2. Connections
Binary, undirected networks were constructed using the 194 nodes described above. Connections within the OMN were derived using Pearson correlations between average low‐frequency CMRO2 fluctuations (see Connection Workflow) extracted from each node. There is no optimal or standard threshold for determining binary connections in a brain network (see Bullmore & Sporns, 2009). Thus, multiple OMNs were constructed for each participant using a range of Pearson correlation thresholds (r t = .20, .25, .30, .35). This range was chosen because (a) it is consistent with a range of thresholds detailed in extant reports using BOLD‐based connectivity (e.g., Achard, Salvador, Witcher, Suckling, & Bullmore, 2006; Buckner et al., 2009; Cole, Pathak, & Schneider, 2010), (b) all r t values were statistically significant (p < .001), and (c) increasing the threshold beyond 0.35 (e.g., to 0.40) led the OMN to break into many fractions—which precludes the use of many graph‐based analyses.
FIGURE 2.

Low‐frequency fluctuations in cerebral oxygen metabolism and oxygen metabolism network nodes. (a) Low‐frequency fluctuations of CMRO2 were recovered from BOLD and CBF, as demonstrated here with data from a participant's posterior cingulate region. (b) Correlations between low‐frequency fluctuations of CMRO2 in spatially‐proximal voxels were used to create nodes of the OMN via the spatially‐constrained spectral clustering of approach (see Node Workflow; Craddock et al., 2012). One‐hundred and ninety‐four nodes are displayed here which were derived from participants' low‐frequency fluctuations of CMRO2
1.6. Assessment of complexity and small‐world properties
We tested the hypothesis that, like anatomical and BOLD‐based functional brain networks (Humphries & Gurney, 2008; Rubinov et al., 2015; see Bullmore & Sporns, 2009, 2012; Sporns et al., 2004), OMNs exhibited properties consistent with complex, small‐world topologies. Specifically, OMN topologies should demonstrate greater segregation properties than random networks and greater integration properties than lattice networks (Figure 3; cf. Watts & Strogatz, 1998).
FIGURE 3.
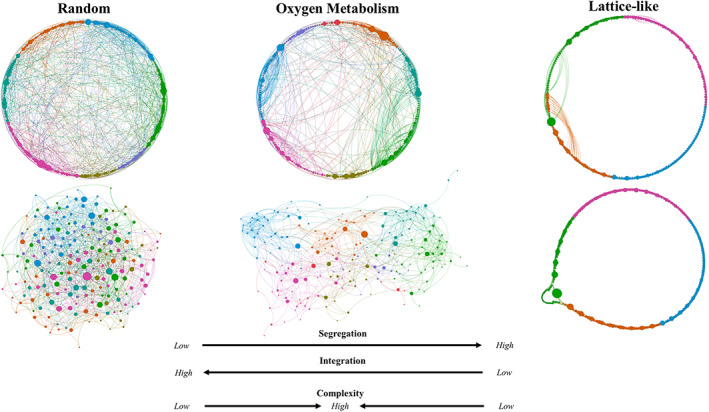
Oxygen metabolism and canonical network topologies. Illustration of the complex topology of a randomly‐selected participant's oxygen metabolism network (OMN) at r t = .25. Random, lattice‐like, and oxygen metabolism networks had identical numbers of nodes and a similar number of connections. Circular (top) and force‐directed (bottom) algorithms were applied. Colors = node neighborhoods, sizes = node betweenness centrality. Graphs were created using Gephi (Bastian, Heymann, & Jacomy, 2009). In circular graphs, random and OMN were sorted by neighborhood, but the lattice‐like network was sorted by row number to demonstrate connections primarily between nearest‐neighbors. In force‐directed graphs, scaling factors were increased to illustrate the effects
Random and lattice networks were simulated to measure their segregation and integration properties and compare these properties to those of the OMNs. The simulated networks were the same size and similar densities relative to OMNs. Segregation properties of networks were assessed using the clustering coefficient (C) that quantified the tendencies for groups of nodes to interconnect with one another. Integration properties of networks were assessed using the reciprocal path length metric (1/L) that quantified the reciprocal of the average shortest path length in the network. C and 1/L were calculated using Brain Connectivity Toolbox (formalisms in Newman, 2008), at each r t, for each participant's OMNs and their simulated networks.
Random networks (RNs) were simulated with n = 194 and with each participant's number of connections (k i), for each r t. Thus, k i|t reflected the number of connections for a given participant's OMN, for a given correlation threshold (r t). In typical RNs, each node is equally likely to share a connection to another node. Thus, RNs have a low probability of many, well‐defined clusters of neighboring nodes (low segregation/low C). However, because of equitable connection distributions, RNs have a relatively short path length between any two nodes (high integration/high 1/L). Lattice‐like networks (LNs) were simulated using code amended from Brain Connectivity Toolbox (Rubinov & Sporns, 2010) with n = 194 and ~ k i|t. These networks were termed “lattice‐like” because an exact lattice topology was not mathematically possible with n = 194 and ~ k i|t. In LNs, each connection was made as close as possible to the main connection matrix diagonal (see Figure 3). The result of this procedure was typical of lattice networks, wherein topological neighbors were closely connected to one another (high segregation/high C). However, longer‐distance connections within LNs were nearly exclusively prohibited (low integration/low 1/L).
Algorithms constructing both RNs and LNs do not create identical patterns of connection placement. Thus, there will be modest variation between simulations of RNki|t and LNki|t in C and 1/L estimates. To ensure reliable results, average C and 1/L estimates were calculated from 500 simulations of RNki|t, and LNki|t (500 simulations × 15 participants = 7,500 for RN and LN, per each r t). We additionally examined small‐worldness coefficients which quantified a relative ratio of segregation and integration properties (S WS; Humphries & Gurney, 2008) at each r t using 500 newly simulated RNs for each participant (500 × 15 = 7,500 per r t).
1.7. Assessment of network cost‐efficiency
Cost efficiency was defined as 1/L – Cost wiring, where positive values reflect a globally economical network (Achard & Bullmore, 2007; De Asis‐Cruz et al., 2015; formalism in Latora and Marchori, 2001). Wiring cost was defined as the number of connections in the OMN scaled to the number of all possible connections (Cost wiring; formalism in Achard & Bullmore, 2007). 1/L and Cost wiring were calculated using Brain Connectivity Toolbox.
1.8. Recovering resting‐state subnetworks from CMRO2 correlations
1.8.1. CMRO2
We also assessed whether voxel‐wise CMRO2 functional connections demonstrated expected spatial patterns consistent with auditory, default mode, frontoparietal, and occipital‐visual resting‐state subnetworks (e.g., Jann et al., 2015). A seed‐based approach was applied to low‐frequency CMRO2 fluctuations to derive voxel‐wise connectivity weights for these subnetworks. The average CMRO2 time series was extracted from 10 mm spherical volumes centered upon seed regions. Right superior temporal gyrus (i.e., primary auditory cortex) served as the auditory network seed (RAI: −43, 20, 6). Precuneus served as the default mode network seed (RAI: 1, 50, 28). The average time series from two bilateral seeds were used to recover frontoparietal network from left and right dorsolateral prefrontal cortex (RAI: −47, −9, 34 [left]; 47, −9, 34 [right]; cf. Jann et al., 2015). Lingual gyrus (i.e., primary visual cortex) served as the occipital‐visual network seed (RAI: 0, 85, 2). Pearson correlation values were Fisher z‐transformed for second‐level analyses.
1.8.2. CMRO2 and Neurosynth BOLD subnetwork connectivity comparisons
CMRO2 subnetwork connectivity patterns were compared to voxel‐wise BOLD data from over 1,000 participants of the Brain Genomics Superstruct Project (Buckner, Krienen, Castellanos, Diaz, & Yeo, 2011; Yeo et al., 2011). Neurosynth's online platform (Yarkoni et al., 2011; neurosynth.org) provided open access to these data and performed seed‐based, voxel‐wise connectivity. We considered the comparison of CMRO2 connectivity patterns to Neurosynth connectivity patterns to be more rigorous than comparisons to the dual‐echo BOLD data from which CMRO2 is derived. Specifically, examining relationships between CMRO2 and Neurosynth BOLD‐based functional connectivity provided an out‐of‐sample comparison to a large database (N = 1,000 participants), as well as a comparison to data acquired from independent investigators, using different scanners, with different resolutions and sequences, and different processing workflows (cf. Woo, Chang, Lindquist, & Wager, 2017). Additionally, unlike dual‐echo BOLD signals, the Neurosynth BOLD signals were not used to recover the CMRO2 signals. Together, comparing CMRO2 to Neurosynth circumvented many of the inherent linear dependencies between CMRO2 and dual‐echo BOLD. Thus, this approach provided a conservative and robust estimate of relationships between CMRO2 and BOLD subnetwork connectivity patterns.
Within the Neurosynth online platform, seed‐based connectivity analyses were performed in MNI152 space, and subnetwork seeds were placed in LPI coordinates analogous to those used in CMRO2 analyses. Voxel‐wise Pearson correlation maps were subsequently downloaded from neurosynth.org, providing an open and easily verifiable comparison (see Supplementary Materials for URLs). Left and right DLPFC correlations extracted from Neurosynth were averaged to remain consistent with the dual‐seed approach used to recover frontoparietal network on CMRO2 maps. Voxel‐wise Neurosynth correlations were Fisher z‐transformed, warped into Colin space (TTN27 template), and then downsampled to the CMRO2 spatial resolution for comparisons. Voxel‐to‐voxel relationships between CMRO2 and Neurosynth subnetwork functional connectivity weights were quantified using Pearson correlations. Additionally, we quantified the degree of spatial overlap between thresholded CMRO2 and Neurosynth subnetwork connectivity maps. A relative threshold of the top 10% of Fisher's z‐correlation voxels was applied to each subnetwork map for each signal type, and the spatial overlap between thresholded maps was quantified using the ϕ coefficient—which assesses the strength of the association between two binary variables. Relative threshold values were chosen because of differences in signal quality and correlation strength between signal types (e.g., Champagne et al., 2019; Wu et al., 2009; see Germuska & Wise, 2018).
2. RESULTS
2.1. Peripheral physiological measures and M analyses
Peripheral physiological measures were monitored during normocapnic and hypercapnic conditions. Participants showed an expected increase in end‐tidal CO2 during CO2‐solution inhalation (Mean = 48.67 mmHg ± 0.669) compared with room air (Mean = 39.87 ± 0.893), t(13) = 14.18, p < .001. On average, voxel‐wise M values (Mean = 3.87% ± 0.197; range = 2.25–5.16%) showed a significant change from 0, t(14) = 19.68, p < .001, indicating that the CO2 challenge was producing significant increases in BOLD signal. The M range was also within the range of extant reports (Hubbard, Sanchez Araujo, et al., 2017; Lajoie et al., 2016; Yücel et al., 2014). Breath rate did not change significantly from room air (11.45 breaths per minute ±1.08) to the CO2 condition (12.16 ± 1.24; p > .05). Heart rate did not change significantly from room air (81.39 beats per minute ±3.66) to the CO2 condition (81.60 ± 3.58; p > .05). Outliers due to technical malfunction (e.g., heart rate = 0) were removed from these analyses. Peripheral oxygen saturation increased statistically (but not clinically) significantly from room air (Mean = 98.27% ± 0.0004) to CO2 condition (Mean = 98.90% ± 0.0003), t(13) = 2.92, p = .012. This could be due to compensatory changes in tidal volume associated with increased CO2 inhalation. Results confirmed that (a) the CO2 challenge caused a significant change in the partial pressure of expired CO2; and (b) this challenge produced an expected increase in BOLD signal (i.e., M) within the range of previous reports (Hubbard, Sanchez Araujo, et al., 2017; Lajoie et al., 2016; Yücel et al., 2014).
2.2. Calibration‐derived CMRO2 model assumptions
Because functional connectivity analyses rely on correlations, which are largely unaffected by the scale of the inputs, connectivity analyses should be robust to reasonable differences in model specifications (e.g., Wu et al., 2009; see Liu, 2013). To demonstrate the robustness of CMRO2 connectivity analyses to α and β specifications, fluctuations in CMRO2 were recovered using two sets of α and β pairings from extant literature (Griffeth & Buxton, 2011; Hubbard, Turner, et al., 2017). These assumption sets were also used in their respective derivations of M. Predictably, different model assumption sets slightly altered the proportional amplitude of the CMRO2 fluctuations (e.g., Wu et al., 2009; see Figure S2). However, the median voxel‐to‐voxel relationship for all participants (N = 368,395 correlations), using the different model assumption sets was r = .994 (MAD = 0.002), demonstrating that altering model assumptions does not appreciably alter the temporal pattern of CMRO2 fluctuations (Figure S3). Figure S3 also demonstrates that altering model assumptions does not appreciably alter the spatial patterns of CMRO2 correlations, nor does it appreciably alter the overall strength of CMRO2 correlations. Within individual participants, interregional differences in α, β, or both α and β were not observed to have a significant effect on the strength of the correlations between regions (ps > .90; Figure S4).
2.2.1. Testing OMN topological properties
The biplot in Figure 4a illustrates that OMN topologies exhibited segregation (C) and integration (1/L) properties between RNs and LNs (cf. Sporns et al., 2004). Consistent with complex, small‐world networks the OMN topologies exhibited significantly greater C than RNs and significantly greater 1/L than LNs (all ps < .001; Figure 4b). For display efficiency, the illustrated results are based upon average C and 1/L across r t. However, the significance of the results remains when testing the OMN versus RNs and LNs at each r t (all ps < .001). We repeated these analyses for dual‐echo BOLD and CBF data (Supplemental Materials; see Figure S5). As expected, dual‐echo BOLD and CBF networks exhibited similar topological properties as the OMNs when compared with their respective RNs and LNs—that is, each signal's topologies exhibited showed greater segregation (C) than RNs and greater integration (1/L) than LNs (all ps < .001).
FIGURE 4.

Comparative analyses of oxygen metabolism network segregation and integration properties. (a) Biplot of segregation (C) and integration (1/L) measurements. Large circles reflect network average coordinates, smaller dots reflect coordinates from individual networks for each r t. Contour lines reflect nonparametric cluster densities. (b) Distributions of C and 1/L across participants. Average distribution presented across study correlation thresholds (r t). Significance does not change at individual r t nor when using nonparametric tests (all ps < .001). d = Cohen's d effect size. *** = parametric and nonparametric p < .001
In addition, consistent with previous imaging findings, at all r t OMN S WS distributions were significantly greater (p < .001) than random networks (i.e., random S WS = 1; De Asis‐Cruz et al., 2015; Humphries & Gurney, 2008; see Table 1). Dual‐echo BOLD and CBF network S WS distributions were also significantly greater (p < .001) than their respective random networks (Table S1).
TABLE 1.
Oxygen metabolism network small‐worldness coefficients
| Connection threshold (r t) | Mean | Lower CI | Upper CI | p‐value |
|---|---|---|---|---|
| .20 | 3.90 | 3.89 | 3.91 | <.001 |
| .25 | 5.68 | 5.66 | 5.70 | <.001 |
| .30 | 7.78 | 7.71 | 7.84 | <.001 |
| .35 | 10.42 | 10.19 | 10.65 | <.001 |
Note: Average small‐worldness coefficients (SWS) from 7,500 simulations at each r t. Mean and 99.9% confidence intervals of mean. For rt = .35, 5/7500 (<.1%) simulations failed to converge and were discarded.
2.3. OMN cost‐efficiency
Consistent with previous studies of anatomical and functional connectivity, we tested whether OMN topologies optimized network integration from wiring costs by assessing their cost‐efficiency metric (Achard & Bullmore, 2007; De Asis‐Cruz et al., 2015; see Bullmore & Sporns, 2009, 2012). t tests were used to test whether the OMN's cost‐efficiency was, on average, greater than 0. Table 2 demonstrates the OMN's cost‐efficiency averaged across all r t and for each individual r t. In all analyses, OMNs were significantly greater than 0 (p < .001); thus, the OMN may be considered to be cost‐efficient (Achard & Bullmore, 2007; De Asis‐Cruz et al., 2015). Dual‐echo BOLD and CBF network topologies also demonstrated cost‐efficiency metrics significantly greater than 0 (ps < .001; Table S2).
TABLE 2.
Oxygen metabolism network cost‐efficiency
| Connection threshold (r t) | Mean | Lower CI | Upper CI | t | p‐value |
|---|---|---|---|---|---|
| .20 | .365 | .355 | .375 | 148.67 | <.001 |
| .25 | .317 | .290 | .344 | 49.22 | <.001 |
| .30 | .256 | .209 | .304 | 22.22 | <.001 |
| .35 | .198 | .134 | .258 | 13.05 | <.001 |
Note: Cost‐efficiency estimates of the oxygen metabolism network across r t. Single‐sample t test against a mean of 0. Lower and upper 99.9% confidence intervals of mean estimate.
2.3.1. Subnetwork connectivity patterns
Figure 5 illustrates averaged voxel‐wise connectivity weights produced by subnetwork seeds using CMRO2 and Neurosynth BOLD data. Figure 6 demonstrates large effect‐size (rs > .55) voxel‐to‐voxel relationships between the CMRO2 and Neurosynth BOLD functional connectivity weights for each seed‐region. Figure 7 shows the spatial overlap between the thresholded top 10% of functional connectivity weights from each signal type and ϕ coefficients. RAI coordinates and anatomical labels of overlapping voxel clusters are detailed in Table 3. We repeated these analyses to compare CMRO2 to dual‐echo BOLD subnetwork functional connectivity patterns (Supplemental Materials; see Figures S6–S8). As expected, relationships were similar but stronger between CMRO2 and dual‐echo BOLD subnetwork connectivity patterns, relative to CMRO2 and Neurosynth BOLD.
FIGURE 5.

Comparison of seed‐based connectivity weights using calibration‐derived CMRO2 (top) and resting BOLD from Neurosynth database (bottom). Here, Neurosynth images were warped to Colin space but kept in their original resolution to illustrate spatial resolution differences. Opacities were decreased on reference images to emphasize anatomical features
FIGURE 6.

Voxel‐to‐voxel relationships between seed‐based functional connectivity weights using calibration‐derived CMRO2 and Neurosynth BOLD
FIGURE 7.

Spatial overlap of thresholded (top 10%) functional connectivity weights from calibration‐derived CMRO2 and Neurosynth BOLD maps using each subnetwork seed. Displays top 10% of positive correlations with each subnetwork seed for CMRO2 overlaid upon top 10% of positive correlations with each subnetwork seed for Neurosynth BOLD. ϕ= phi coefficient of binary association. RAI coordinates and anatomical labels for overlapping voxel clusters are found in Table 3
TABLE 3.
Oxygen metabolism and Neurosynth BOLD subnetwork overlap
| Subnetwork | Label (BA) | X | Y | Z | Voxel count |
|---|---|---|---|---|---|
| Auditory | R superior temporal (13, 22) | −48 | 15 | 08 | 917 |
| L superior temporal (13, 32) | 45 | 16 | 06 | 578 | |
| Thalamus | 00 | 16 | 04 | 110 | |
| R postcentral (3, 4, 40) | −32 | 30 | 51 | 007 | |
| R precentral (2, 3, 4) | −40 | 21 | 37 | 005 | |
| Default mode | Posterior cingulate (23, 31) | 00 | 51 | 24 | 753 |
| Medial frontal (9, 10) | −01 | −51 | 14 | 422 | |
| L middle temporal (39) | 44 | 62 | 27 | 257 | |
| R superior temporal (39) | −48 | 57 | 26 | 140 | |
| L superior frontal (8, 6) | 29 | −18 | 49 | 071 | |
| R superior frontal (8) | −24 | −30 | 46 | 027 | |
| L middle temporal (21) | 62 | 32 | −04 | 020 | |
| L middle temporal (21, 22) | 58 | 12 | −09 | 013 | |
| L superior frontal (8) | 17 | −40 | 44 | 007 | |
| L superior frontal (10) | 10 | −67 | 17 | 006 | |
| Frontoparietal | L middle frontal (9, 46) | −44 | −14 | 27 | 530 |
| R middle frontal (9, 46) | −46 | −13 | 28 | 484 | |
| L inferior parietal (40) | 38 | 51 | 42 | 376 | |
| R inferior parietal (40) | −39 | 51 | 43 | 265 | |
| Superior frontal (8, 6) | −01 | −18 | 53 | 005 | |
| Occipital‐visual | Lingual (18, 30) | −01 | 75 | 05 | 2,444 |
| L parahippo/thalamus (28, 35) | 24 | 23 | −05 | 005 |
Note: Label and coordinates reflect center of mass of voxel cluster of at least 5 voxels. Brodmann's areas (BA) are given within 5 mm of cluster center. Lateral distinctions removed from voxels within 5 mm of midline.
3. DISCUSSION
We tested whether brain‐wide functional connections from resting calibration‐derived oxygen metabolism signals demonstrated organization properties typical of the healthy brain. Networks constructed from low‐frequency fluctuations of oxygen metabolism exhibited clustering coefficients, reflecting segregation properties, greater than those of equally‐sized and dense random networks. Reciprocal path length measures of these OMN, reflecting integration properties, were greater than equally‐sized and similarly dense lattice‐like networks. These findings, along with significant small‐worldness coefficients and cost‐efficiency metrics suggest that connections from resting calibration‐derived oxygen metabolism signals feature complex, small‐world topologies (Achard & Bullmore, 2007; De Asis‐Cruz et al., 2015; Humphries & Gurney, 2008; Kaiser & Hilgetag, 2006; Rubinov et al., 2015; van den Heuvel et al., 2016; see Bullmore & Sporns, 2009, 2012; Sporns et al., 2004), consistent with previous anatomical and functional connectivity findings.
Parity observed in supplemental analyses of dual‐echo BOLD‐ and CBF‐based networks lends additional evidence for the complex, small‐world organization of the brain's topology across multiple functional signals. Oxygen metabolism functional connectivity patterns with four resting‐state subnetwork seeds also demonstrated large‐effect relationships with subnetwork connectivity patterns from a large, independent sample of BOLD data. Additionally, medium‐ to large‐effect size relationships were observed for thresholded subnetwork voxels of oxygen metabolism and thresholded subnetwork voxels of the independent sample of BOLD data. Together, these findings demonstrate that functional connections from resting calibration‐derived oxygen metabolism detect wide‐spread organization properties typical of the healthy brain.
3.1. Use and interpretations of CMRO2‐based functional connections
Using calibrated imaging to recover low‐frequency fluctuations of oxygen metabolism offers a neurophysiological interpretation of functional connectivity. A connection reflects a significant degree of metabolic coherence between neural units, and topological properties reflect brain‐wide patterns of this coherence. For example, connections within a specific subnetwork reflect elevated coherence of metabolic fluctuations between the voxels of this subnetwork. Importantly, a connection does not imply that absolute metabolism is equivalent between neural units of a subnetwork (cf. Hyder et al., 2016), but rather, provides a measure of the synchrony of basal metabolic fluctuations over time.
Along with increased physiological specificity, oxygen metabolism‐based functional connectivity could provide a close link between the brain's macroscale organization and its actual neuronal communication networks. Coherent interregional low‐frequency fluctuations of brain activity may be the macroscale product of neuronal‐activity‐dependent communication networks (Krishnan, González, & Bazhenov, 2018; Leopold & Maier, 2012; also Sur & Rubenstein, 2004). It is challenging to infer this interpretation from BOLD‐based functional connectivity alone, due to the confluence of physiological sources that give rise to it (e.g., Whittaker, Driver, Venzi, Bright, & Murphy, 2019; see Leopold & Maier, 2012). Oxygen metabolism signals however have a stronger and better‐understood relationship with electrical and chemical neuronal activity. For instance, relationships observed between calibration‐derived CMRO2 and electrical and chemical neuronal activity suggest that CMRO2 can offer the most proximal MR‐based measure of neuronal activity presently available (e.g., Herman et al., 2009, 2013; Hyder et al., 2001, 2002; Lin et al., 2010; Smith et al., 2002). Additionally, spontaneous neural oscillations are strongly influenced by interstitial oxygen tension emphasizing the critical role that oxygen metabolism has in the maintenance of resting neural communication (Huchzermeyer et al., 2008). Finally, neuronal communication processes are the most prolific consumer of metabolic resources in the brain (Yu, Herman, Rothman, Agarwal, & Hyder, 2017), implying a strong physiological need for oxidative metabolism to accompany neuronal‐activity‐dependent communication. In sum, oxygen metabolism‐based functional connectivity mapping holds promise for using MR‐based methods to explore the organization of intrinsic neuronal communication.
Our findings provide the initial bridge between calibrated imaging and brain‐wide connectomics. This bridge has implications for general systems‐level research, as well as patient populations wherein altered neurometabolism or network dysfunction are implicated in the pathology (e.g., Alzheimer's Disease, multiple sclerosis, schizophrenia). Based upon task‐based CMRO2 literature, we speculate that resting CMRO2 network analyses may also provide the means for gaining advanced insight into neurological and psychological diversity (Ances et al., 2011; Hubbard, Sanchez Araujo et al., 2017; Hubbard, Turner et al., 2017; Hutchison et al., 2013; Mohtasib et al., 2012). For instance, calibration‐derived CMRO2 has revealed new and stronger relationships to white‐matter damage and primary symptomology in patients with multiple sclerosis relative to BOLD (Hubbard, Turner, et al., 2017). Additionally, connectomic analyses themselves have yielded unique insights into cognitive abilities, lifespan development factors, and numerous pathologies (e.g., Achard & Bullmore, 2007; De Asis‐Cruz et al., 2015; Pandit et al., 2013; van den Heuvel et al., 2009; see Bassett & Bullmore, 2009; Barbey, 2018; Whitfield‐Gabrieli and Ford, 2012). We showed that applying graph‐based or voxel‐wise analyses to calibration‐derived CMRO2 functional connections can produce expected organizational features of the healthy brain. These findings inspire confidence that calibrated imaging and brain‐wide functional connectivity methods may be applied together in future research to gain novel insights into the group or individual differences via examinations of neurometabolic network organization.
3.2. Modeling low‐frequency fluctuations of CMRO2
The deoxyhemoglobin dilution model is the most commonly used modeling approach in calibrated imaging and provides reliable and valid measurement of CMRO2 changes in steady‐state activation contexts (see Bright et al., 2019; Buxton, 2010; Hoge, 2012). Its application for recovering CMRO2 changes in dynamic contexts, such as moment‐to‐moment fluctuations or event‐related task activations, remains understudied and controversial (Herman et al., 2009; Hyder et al., 2010; Kida, Rothman, & Hyder, 2007; Simon & Buxton, 2015). Potential uncoupling between CBF and blood volume poses a primary concern for using the deoxyhemoglobin dilution model to recover dynamic fluctuations in CMRO2. Specifically, putative uncoupling between vascular compartments may be problematic because dynamic adaptations of this model assume that arterial CBF relates to venous blood volume in a predictable manner over both longer and shorter periods of time (i.e., α).
There is a paucity of research directly examining blood flow‐volume coupling during the resting state. However, research investigating brief stimulations offer one analog for understanding dynamic blood flow and volume relationships. On one hand, some studies suggest uncoupling between blood flow and volume in dynamic contexts (Kida et al., 2007; Obata et al., 2004; Simon & Buxton, 2015). For instance, results from one simulation study showed that during brief exposures to stimuli, slower changes in blood volume did not immediately follow faster changes in the blood flow response (Simon & Buxton, 2015). Another study showed that blood flow‐volume uncoupling may change the shape and magnitude of transient BOLD responses (Obata et al., 2004). On the other hand, at least one study has demonstrated that during brief exposures to stimuli (i.e., dynamic fluctuations), blood flow and volume responses are tightly coupled in time (Herman et al., 2009). Moreover, during small or moderate vasodilatory events like those occurring during the human resting state, blood flow and volume conform to the exponential relationship (i.e., α) specified by the deoxyhemoglobin dilution model (Lorthois, Cassot, & Lauwers, 2011). Additionally, one in vivo study demonstrated a significant temporal relationship between changes in arterial and venous tone during resting, spontaneous neural events (Drew, Shih, & Kleinfeld, 2011). These authors found that arteriole and venule dilations showed significant coherence in this low‐frequency spectrum, also providing evidence for temporal coupling between resting arterial and venous exchange.
More research is needed to directly test the feasibility of using the deoxyhemoglobin dilution model for recovering moment‐to‐moment changes in CMRO2. However, even assuming flow‐volume uncoupling biases the specified exponential relationship between CBF and blood volume (i.e., α; e.g., Kida et al., 2007; Simon & Buxton, 2015), it should not be problematic to use this model to recover low‐frequency fluctuations of CMRO2 if these are used for functional connectivity. That is, if the α term alone is affected, only the amplitude of the CMRO2 signal should be altered. Because functional connectivity is primarily assessed using a scale‐invariant correlation coefficient, a biased estimate of CMRO2 amplitudes should have minimal effects on CMRO2‐based functional connectivity.
Similarly, the deoxyhemoglobin dilution model for resting‐state CMRO2 functional connectivity is resilient to influence from model assumptions (i.e., α, β, and M). It is important to note that considerable human, animal, and computational research has examined the specification of model assumptions for calibration‐derived amplitudes of CMRO2 (Griffeth & Buxton, 2011; Kida et al., 2007; Lu & van Zijl, 2005; see Hoge, 2012). Moreover, other studies have investigated whether the hypercapnic challenge is isometabolic and whether it might also influence the amplitude of CMRO2 by virtue of affecting the M parameter (Peng, Ravi, Sheng, Thomas, & Lu, 2017; Yücel et al., 2014). As we demonstrated, altering α and β assumptions of the deoxyhemoglobin dilution model alters the amplitude of dynamic CMRO2 fluctuations. However, such alterations do not markedly change either (a) the temporal pattern of CMRO2 fluctuations, (b) the overall strength of CMRO2 correlations, or (c) the spatial distribution of CMRO2 correlations. Additionally, individually altering M‐values has little or no effect on calibration‐derived CMRO2 functional connectivity patterns (Wu et al., 2009). In sum, because changes to model assumptions mostly affect the amplitude of the CMRO2 fluctuations and not the coherence of the fluctuations themselves, reasonable specifications consistent with animal, human, and computational findings are unlikely to affect resting‐state CMRO2 functional connectivity analyses (Liu, 2013).
3.3. Technical challenges and developments
Users of calibrated fMRI for resting functional connectivity analyses face additional technical challenges relative to more standard approaches (for review see Bright et al., 2019). For instance, due to reduced spatial coverage accompanying the dual‐echo acquisition method used here, the effective field‐of‐view available was largely restricted to supra‐tentorial structures. Future work using multiband dual‐echo acquisition may sufficiently increase effective fields‐of‐view to reliably accommodate both supra‐ and infra‐tentorial structures (e.g., Cohen, Nencka, & Wang, 2018). Additionally, the use of hypercapnic challenges is difficult to employ and could be problematic for use in specific populations (e.g., anxious participants). Advances using asymmetric spin echo, quantitative susceptibility mapping, breath‐hold challenges, and other techniques suggest promise for recovering CMRO2 signals without the use of a gas challenge (Biswal, Kannurpatti, & Rypma, 2007; Blockley, Griffeth, Simon, Dubowitz, & Buxton, 2015; Kannurpatti, Motes, Rypma, & Biswal, 2010, 2011; Sanganahalli, Herman, Rothman, Blumenfeld, & Hyder, 2016; Shu et al., 2016; Zhang et al., 2018), offering optimism for more convenient and inclusive opportunities in calibrated imaging research. Additionally, relaxometry approaches employing exogenous contrasts are capable of recovering voxel‐wise estimates of β—which circumvents the need to assume this parameter (Kida, Kenna, Rothman, Behar, & Hyder, 2000; Shu et al., 2016).
Another challenge facing users of low‐frequency fluctuations of calibration‐derived oxygen metabolism for functional connectivity analyses is that signal quality decreases will affect the strength of functional connections. Consistent with BOLD‐based connectivity, decreased or altered temporal signal‐to‐noise distributions between neural units will reduce their measured functional connectivity (see Liu, 2013). Low‐frequency fluctuations of calibration‐derived CMRO2 have reduced temporal signal‐to‐noise distributions relative to BOLD (Wu et al., 2009). Thus, low‐frequency fluctuations of calibration‐derived CMRO2 will inherently produce lower functional connectivity estimates compared with those based upon BOLD (cf. Liu, 2013). This may be problematic in at least two ways. First, disparate signal‐to‐noise distributions will bias quantitative comparisons of BOLD‐based and CMRO2‐based functional connectivity. This bias is evident in the Wu et al. (2009) study, wherein they demonstrated overall decreased correlation coefficients for CMRO2‐based functional connections along with overall decreased contrast‐to‐noise ratios relative to BOLD (also Champagne et al., 2019). In terms of comparing BOLD and CMRO2 graph‐based networks, differences in the strength of correlations will also bias prospective quantitative comparisons of these signals' network properties (cf. Garrison, Sheinost, Finn, Shen, & Constable, 2015; Hilgetag & Goulas, 2016). Because of baseline increases in functional connectivity coefficients for BOLD relative to CMRO2, a similar absolute correlation threshold will yield different network densities across these two signal types, biasing direct network comparisons (cf. Garrison et al., 2015; Hilgetag & Goulas, 2016). However, as we demonstrate here, lower signal quality does not preclude qualitative (e.g., determining whether a signal type demonstrates a complex, small‐world topology) or relative (e.g., comparisons of spatial overlap with relative thresholds) comparisons of network or subnetwork organization between CMRO2 and BOLD, or other imaging approaches.
A related challenge concerns the sensitivity of CMRO2‐based functional connectivity analyses. Decreased strength of CMRO2 functional connections decreases the probability of detecting statistically significant connections. When considering this technique relative to BOLD, increased noise in the CMRO2 signal will likely require greater sample sizes to achieve equivalent statistical power. For example, Champagne et al. (2019) reported changes in BOLD‐ and CMRO2‐based default mode networks pre‐ and post‐head impacts in collegiate athletes. Effect sizes for pre‐ and post‐condition comparisons were markedly larger for BOLD‐based relative to CMRO2‐based functional connectivity analyses, suggesting that CMRO2‐based analyses may require greater sample sizes for inferential tests to achieve the same statistical power as BOLD. Additionally, because of slower sampling rates for dual‐echo signals relative to BOLD alone, longer acquisition times may also be necessary to achieve the same statistical power for functional connectivity analyses within participants.
4. CONCLUSIONS
This is the first study to demonstrate that brain‐wide calibration‐derived CMRO2 functional connections could detect both topological and subnetwork properties consistent with those previously established in the healthy brain. Functional connectivity analyses using low‐frequency fluctuations of calibration‐derived CMRO2 showed qualitatively similar complex, small‐world network topologies compared with those described by previous functional and anatomical connectivity studies. Further, seed‐based functional connectivity using calibration‐derived CMRO2 and an independent BOLD data set showed large effect‐size relationships between voxel‐wise subnetwork connectivity patterns, and medium to large effect‐size relationships in their binary spatial overlap. Calibrated imaging is still in its infancy and there are many additional challenges facing users of this method that should be addressed in future research. However, for those seeking to acquire a functional signal that is unambiguous, closely related to neural communication, and that yields novel information about neurological or psychological diversity; our results suggest that the present challenges associated with calibrated imaging can be overcome to investigate the brain‐wide organization of resting‐state oxygen metabolism.
CONFLICT OF INTERESTS
The authors declare no known competing interests.
Supporting information
Appendix S1: Supporting information
ACKNOWLEDGMENTS
This work was supported in part by National Institute of Health grants to NAH (F32MH114525; P20GM130461[6026]), KRS (F31DC015695), and BR/HL (R01AG047972). This work was also partially supported by Friends of the Air Force Academy Library of Brain Health Distinguished Scientist Award, Brain and Behavior Research Foundation Award, and the Nebraska Biomedical Research Development Funds (NAH); the National Multiple Sclerosis Society (BR: RG‐150‐06687). The authors would like to thank Lindsey Michelle for assistance in figure creation, James Capella, Jimmy Chen, and Danielle Clark for assistance with manuscript preparation. The authors would also like to thank Drs. John Gabrieli, Satrajit Ghosh, and Susan Whitfield‐Gabrieli for providing thoughtful discussions about previous drafts of the manuscript.
Hubbard NA, Turner MP, Sitek KR, et al. Resting cerebral oxygen metabolism exhibits archetypal network features. Hum Brain Mapp. 2021;42:1952–1968. 10.1002/hbm.25352
Funding information Friends of BrainHealth; National Institutes of Health, Grant/Award Numbers: F31DC015695, F32MH114525, P20GM130461, R01AG047972; National Multiple Sclerosis Society; Brain and Behavior Research Foundation; Friends of the Air Force Academy Library
DATA AVAILABILITY STATEMENT
De‐identified data and code will be made available upon request to the corresponding author.
REFERENCES
- Abdelkarim, D. , Zhao, Y. , Turner, M. P. , Sivakolundu, D. K. , Lu, H. , & Rypma, B. (2019). A neural‐vascular complex of age‐related changes in the human brain: Anatomy, physiology, and implications for neurocognitive aging. Neuroscience and Biobehavioral Reviews, 107, 927–944. 10.1016/j.neubiorev.2019.09.005 [DOI] [PubMed] [Google Scholar]
- Achard, S. , & Bullmore, E. (2007). Efficiency and cost of economical brain functional networks. Computational biology, 3, 174–183. [DOI] [PMC free article] [PubMed] [Google Scholar]
- Achard, S. , Salvador, R. , Witcher, B. , Suckling, J. , & Bullmore, E. (2006). A resilient, low‐frequency, small‐world human brain functional network with highly connected association cortical hubs. The Journal of Neuroscience, 26, 63–72. [DOI] [PMC free article] [PubMed] [Google Scholar]
- Ances, B. , Vaida, F. , Ellis, R. , & Buxton, R. B. (2011). Test–retest stability of calibrated BOLD‐fMRI in HIV− and HIV subjects. NeuroImage, 54, 2156–2162. 10.1016/j.neuroimage.2010.09.081 [DOI] [PMC free article] [PubMed] [Google Scholar]
- Ances, B. M. , Liang, C. L. , Leontiev, O. , Perthen, J. E. , Fleisher, A. S. , Lansing, A. E. , & Buxton, R. B. (2009). Effects of aging on cerebral blood flow, oxygen metabolism, and blood oxygenation level dependent responses to visual stimulation. Human Brain Mapping, 30(4), 1120–1132. 10.1002/hbm.20574 [DOI] [PMC free article] [PubMed] [Google Scholar]
- Barbey, A. K. (2018). Network neuroscience theory of human intelligence. TICS, 22(1), 8–20. [DOI] [PubMed] [Google Scholar]
- Bastian, M. , Heymann, S. , & Jacomy, M. (2009). Gephi: an open source software for exploring and manipulating networks. International AAAI Conference on Weblogs and Social Media.
- Bassett, D. , & Bullmore, E. (2009). Human brain networks in health and disease. Current Opinion in Neurology, 22(4), 340–347. [DOI] [PMC free article] [PubMed] [Google Scholar]
- Behzadi, Y. , Restom, K. , Liau, J. , & Liu, T. T. (2007). A component based noise correction method (CompCor) for BOLD and perfusion based fMRI. NeuroImage, 37, 90–101. [DOI] [PMC free article] [PubMed] [Google Scholar]
- Bright, M. G. , Croal, P. L. , Blockley, N. P. , & Bulte, D. P. (2019). Multiparametric measurement of cerebral physiology using calibrated fMRI. NeuroImage, 187, 128‐144. [DOI] [PubMed] [Google Scholar]
- Birn, R. M. (2012). The role of physiological noise in resting‐state functional connectivity. NeuroImage, 2(15), 864–870. [DOI] [PubMed] [Google Scholar]
- Biswal, B. B. , Kannurpatti, S. S. , & Rypma, B. (2007). Hemodynamic scaling of fMRI‐BOLD signal: Validation of low‐frequency spectral amplitude as a scalability factor. Magnetic Resonance Imaging, 25, 1358–1369. [DOI] [PMC free article] [PubMed] [Google Scholar]
- Blockley, N. P. , Griffeth, V. E. , Simon, A. B. , Dubowitz, D. J. , & Buxton, R. B. (2015). Calibrating the BOLD response without administering gases: Comparison of hypercapnia calibration with calibration using an asymmetric spin echo. NeuroImage, 104, 423–429. 10.1016/j.neuroimage.2014.09.061 [DOI] [PMC free article] [PubMed] [Google Scholar]
- Buckner, R. L. , Krienen, F. M. , Castellanos, A. , Diaz, J. C. , & Yeo, B. T. (2011). The organization of human cerebellum estimated by intrinsic functional connectivity. Journal of Neurophysiology, 106, 2322–2345. [DOI] [PMC free article] [PubMed] [Google Scholar]
- Buckner, R. L. , Sepulcre, J. , Talukdar, T. , Krienen, F. M. , Liu, H. , Hedden, T. , … Johnson, K. A. (2009). Cortical hubs revealed by intrinsic functional connectivity: Mapping, assessment of stability, and relation to Alzheimer's disease. The Journal of Neuroscience, 29, 1860–1873. [DOI] [PMC free article] [PubMed] [Google Scholar]
- Bullmore, E. , & Sporns, O. (2009). Complex brain networks: Graph theoretical analysis of structural and functional systems. Nature Reviews Neuroscience, 10(3), 186–198. 10.1038/nrn2575 [DOI] [PubMed] [Google Scholar]
- Bullmore, E. , & Sporns, O. (2012). The economy of brain network organization. Nature Reviews Neuroscience, 13, 336–349. [DOI] [PubMed] [Google Scholar]
- Buxton, R. B. (2010). Interpreting oxygenation‐based neuroimaging signals: The importance and the challenge of understanding brain oxygen metabolism. Frontiers in Neuroenergetics, 2, 1–16. 10.3389/fnene.2010.00008 [DOI] [PMC free article] [PubMed] [Google Scholar]
- Champagne, A. A. , Coverdale, N. S. , Nashed, J. Y. , Fernandez‐Ruiz, J. , & Cook, D. J. (2019). Resting CMRO2 fluctuations show persistent network hyper‐connectivity following exposure to sub‐concussive collisions. NeuroImage:Clinical, 22, 101753. [DOI] [PMC free article] [PubMed] [Google Scholar]
- Cohen, A. D. , Nencka, A. S. , & Wang, Y. (2018). Multiband multi‐echo simultaneous ASL/BOLD for task‐induced functional MRI. PLoS One, 13(2), 1–21. 10.1371/journal.pone.0190427 [DOI] [PMC free article] [PubMed] [Google Scholar]
- Cole, M. W. , Pathak, S. , & Schneider, W. (2010). Identifying the brain's most globally connected regions. NeuroImage, 49, 3132–3148. [DOI] [PubMed] [Google Scholar]
- Craddock, R. C. , James, G. A. , Holtzheimer, P. E., III , Hu, X. P. , & Mayberg, H. S. (2012). A whole brain fMRI atlas generated via spatially constrained spectral clustering. Human Brain Mapping, 33, 1914–1928. [DOI] [PMC free article] [PubMed] [Google Scholar]
- Davis, T. L. , Kwong, K. K. , Weiskoff, R. M. , & Rosen, B. R. (1998). Calibrated functional MRI: Mapping the dynamics of oxidative metabolism. Proceedings of the National Academy of Sciences of the United States of America, 95, 1834–1839. [DOI] [PMC free article] [PubMed] [Google Scholar]
- De Asis‐Cruz, J. , Bouyssi‐Kobar, M. , Evangelou, I. , Vezina, G. , & Limperopoulos, C. (2015). Functional properties of resting state networks in healthy full‐term newborns. Scientific Reports, 5, 1–14. 10.1038/srep17755 [DOI] [PMC free article] [PubMed] [Google Scholar]
- Drew, P. J. , Shih, A. Y. , & Kleinfeld, D. (2011). Fluctuating and sensory‐induced vasodynamics in rodent cortex extend to arteriole capacity. PNAS, 108(20), 8472–8478. [DOI] [PMC free article] [PubMed] [Google Scholar]
- Garrison, K. A. , Sheinost, D. , Finn, E. S. , Shen, X. , & Constable, R. T. (2015). The (in)stability of functional brain network measures across thresholds. NeuroImage, 18, 651–661. [DOI] [PMC free article] [PubMed] [Google Scholar]
- Gauthier, C. , & Fan, A. (2018). BOLD signal physiology: Models and applications. NeuroImage, 187, 116–127. 10.1016/j.neuroimage.2018.03.018 [DOI] [PubMed] [Google Scholar]
- Germuska, M. , & Wise, R. G. (2018). Calibrated fMRI for mapping absolute CMRO2: Practicalities and prospects. NeuroImage, 187, 145–153. 10.1016/j.neuroimage.2018.03.068 [DOI] [PubMed] [Google Scholar]
- Griffeth, V. E. M. , & Buxton, R. B. (2011). A theoretical framework for estimating cerebral oxygen metabolism changes using the calibrated‐BOLD method: Modeling the effects of blood volume distribution, hematocrit, oxygen extraction fraction, and tissue signal properties on the BOLD signal. NeuroImage, 58, 198–212. [DOI] [PMC free article] [PubMed] [Google Scholar]
- Grubb, R. L. , Raichle, M. E. , Eichling, J. O. , & Ter‐Pogossian, M. M. (1974). The effects of changes in PaCO2 on cerebral blood volume, blood flow, and vascular mean transit time. Stroke, 5, 630‐639. [DOI] [PubMed] [Google Scholar]
- Hallquist, M. N. , Hwang, K. , & Luna, B. (2013). The nuisance of nuisance regression: Spectral misspecification in a common approach to resting‐state fMRI preprocessing reintroduces noise and obscures functional connectivity. NeuroImage, 82(15), 208–225. [DOI] [PMC free article] [PubMed] [Google Scholar]
- Herman, P. , Sanganahalli, B. G. , Blumenfeld, H. , & Hyder, F. (2009). Cerebral oxygen demand for short‐lived and steady‐state events. Journal of Neurochemistry, 109, 73–79. [DOI] [PMC free article] [PubMed] [Google Scholar]
- Herman, P. , Sanganahalli, B. G. , Blumenfeld, H. , Rothman, D. L. , & Hyder, F. (2013). Qunatitative basis for neuroimaging of cortical laminae with calibrated functional MRI. Proceedings of the National Academy of Sciences of the United States of America, 110, 15115–15120. [DOI] [PMC free article] [PubMed] [Google Scholar]
- Hilgetag, C. C. , & Goulas, A. (2016). Is the brain really a small‐world network? Brain Structure & Function, 221, 2361–2366. [DOI] [PMC free article] [PubMed] [Google Scholar]
- Hoge, R. D. (2012). Calibrated fMRI. NeuroImage, 62, 930–937. [DOI] [PubMed] [Google Scholar]
- Hoge, R. D. , Atkinson, J. , Gill, B. , Crelier, G. R. , Marrett, S. , & Pike, G. B. (1999). Investigation of BOLD signal dependence on cerebral blood flow and oxygen consumption: The deoxyhemoglobin dilution model. Magnetic Resonance in Medicine, 42, 849–863. [DOI] [PubMed] [Google Scholar]
- Hubbard, N. A. , Sanchez Araujo, Y. , Caballero, C. , Ouyang, M. , Turner, M. P. , Himes, L. , … Rypma, B. (2017). Evaluation of visual‐evoked cerebral metabolic rate of oxygen as a diagnostic marker in multiple sclerosis. Brain Sciences, 7(6), 5375–5390. 10.3390/brainsci7060064 [DOI] [PMC free article] [PubMed] [Google Scholar]
- Hubbard, N. A. , Turner, M. P. , Ouyang, M. , Himes, L. , Thomas, B. , Hutchison, J. L. , … Rypma, B. (2017). Calibrated imaging reveals altered grey matter metabolism related to white matter microstructure and symptom severity in multiple sclerosis. Human Brain Mapping, 38, 5375–5390. [DOI] [PMC free article] [PubMed] [Google Scholar]
- Huchzermeyer, C. , Albus, K. , Gabriel, H. , Otahal, J. , Taubenberger, N. , Heinemann, U. , … Kann, O. (2008). Gamma oscillations and spontaneous network activity in the hippocampus are highly sensitive to decreases in pO2 and concomitant changes in mitochondrial redox state. The Journal of Neuroscience, 28, 1153–1162. [DOI] [PMC free article] [PubMed] [Google Scholar]
- Humphries, M. D. , & Gurney, K. (2008). Network ‘small‐world‐ness’: A quantitative method for determining canonical network equivalence. PLoS One, 3, 1–10. 10.1371/journal.pone.0002051 [DOI] [PMC free article] [PubMed] [Google Scholar]
- Hutchison, J. L. , Lu, H. , & Rypma, B. (2013). Neural mechanisms of age‐related slowing: The CBF/CMRO2 ratio mediates age‐differences in BOLD signal and human performance. Cerebral Cortex, 23, 2337–2346. [DOI] [PMC free article] [PubMed] [Google Scholar]
- Hyder, F. (2004). Neuroimaging with calibrated fMRI. Stroke, 35(11_suppl_1), 2635–2641. 10.1161/01.str.0000143324.31408.db [DOI] [PubMed] [Google Scholar]
- Hyder, F. , Herman, P. , Bailey, C. J. , Møller, A. , Globinsky, R. , Fulbright, R. K. , … Gjedde, A. (2016). Uniform distribution of glucose oxidation and oxygen extraction in gray matter of normal human brain: No evidence of regional differences in aerobic glycolysis. (2016). Journal of Cerebral Blood Flow & Metabolism, 36(5), 903–916. [DOI] [PMC free article] [PubMed] [Google Scholar]
- Hyder, F. , Kida, I. , Behar, K. L. , Kennan, R. P. , Maciejewski, P. K. , & Rothman, D. L. (2001). Quantitative functional imaging of the brain: Towards mapping neuronal activity by BOLD fMRI. NMR in Biomedicine, 14(7–8), 413–431. 10.1002/nbm.733 [DOI] [PubMed] [Google Scholar]
- Hyder, F. , Rothman, D. L. , & Shulman, R. G. (2002). Total neuroenergetics support localized brain activity: Implications for the interpretation of fMRI. PNAS, 99, 10771–10776. [DOI] [PMC free article] [PubMed] [Google Scholar]
- Hyder, F. , Sanganahalli, B. G. , Herman, P. , Coman, D. , Maandag, N. J. G. , Behar, K. L. , … Rothman, D. L. (2010). Neurovascular and neurometabolic couplings in dynamic calibrated fMRI: Transient oxidative neuroenergetics for block‐design and event‐related paradigms. Frontiers in Neuroenergetics, 2, 1–11. 10.3389/fnene.2010.00018 [DOI] [PMC free article] [PubMed] [Google Scholar]
- Iannetti, G. D. , & Wise, R. G. (2007). BOLD functional MRI in disease and pharmacological studies: Room for improvement? MRI, 25, 978‐988. [DOI] [PubMed] [Google Scholar]
- Jann, K. , Gee, D. G. , Kilroy, E. , Schwab, S. , Smith, R. X. , Cannon, T. D. , & Wang, D. J. (2015). Functional connectivity in BOLD and CBF data: Similarity and reliability of resting brain networks. NeuroImage, 106, 111–122. [DOI] [PMC free article] [PubMed] [Google Scholar]
- Joon Jo, H. , Gotts, S. J. , Reynolds, R. C. , Bandettini, P. A. , Martin, A. , Cox, R. W. , & Saad, Z. S. (2013). Effective preprocessing procedures virtually eliminate distance‐dependent motion artifacts in resting state FMRI. Journal of Applied Mathematics, 2013, 1–9. 10.1155/2013/935154 [DOI] [PMC free article] [PubMed] [Google Scholar]
- Kaiser, M. , & Hilgetag, C. C. (2006). Nonoptimal component placement, but short processing paths, due to long‐distance projections in neural systems. PLoS Computational Biology, 2, 805–815. 10.1371/journal.pcbi.0020095 [DOI] [PMC free article] [PubMed] [Google Scholar]
- Kannurpatti, S. S. , Motes, M. A. , Rypma, B. , & Biswal, B. B. (2010). Neural and vascular variability and the fMRI‐BOLD response in normal aging. Magnetic Resonance Imaging, 28, 466–476. [DOI] [PMC free article] [PubMed] [Google Scholar]
- Kannurpatti, S. S. , Motes, M. A. , Rypma, B. , & Biswal, B. B. (2011). Non‐neural BOLD variability in block and event‐related paradigms. Magnetic Resonance Imaging, 29, 140–176. [DOI] [PMC free article] [PubMed] [Google Scholar]
- Kida, I. , Kenna, R. P. , Rothman, D. L. , Behar, K. L. , & Hyder, F. (2000). High‐resolution CMRO2 mapping in rat cortex: A multiparametric approach to calibration of BOLD image contrast at 7 tesla. Journal of Cerebral Blood Flow & Metabolism, 20, 847–860. [DOI] [PubMed] [Google Scholar]
- Kida, I. , Rothman, D. L. , & Hyder, F. (2007). Dynamics of changes in blood flow, volume, and oxygenation: Implications for dynamic functional magnetic resonance imaging calibration. Journal of Cerebral Blood Flow & Metabolism, 27, 690–696. [DOI] [PMC free article] [PubMed] [Google Scholar]
- Krishnan, G. P. , González, O. C. , & Bazhenov, M. (2018). Origins of slow spontaneous resting‐state neural fluctuations in brain networks. PNAS, 115(26), 6858–6863. [DOI] [PMC free article] [PubMed] [Google Scholar]
- Lajoie, I. , Tancredi, F. B. , & Hoge, R. D. (2016). Regional reproducibility of BOLD calibration parameter M, OEF and resting‐state CMRO2 measurements with QUO2 MRI. PLoS One, 11, 1–31. 10.1371/journal.pone.0163071 [DOI] [PMC free article] [PubMed] [Google Scholar]
- Leopold, D. A. , & Maier, A. (2012). Ongoing physiological processes in the cerebral cortex. NeuroImage, 62(4), 2190–2200. 10.1016/j.neuroimage.2011.10.059 [DOI] [PMC free article] [PubMed] [Google Scholar]
- Liau, J. , Perthen, J. E. , & Liu, T. T. (2008). Caffeine reduces the activation extent and contrast‐to‐noise ratio of the functional cerebral blood flow response but not the BOLD response. NeuroImage, 42, 296‐305. [DOI] [PMC free article] [PubMed] [Google Scholar]
- Lin, A. , Fox, P. T. , Hardies, J. , Duong, T. Q. , & Gao, J. (2010). Nonlinear coupling between cerebral blood flow, oxygen consumption, and ATP production in human visual cortex. Proceedings of the National Academy of Sciences of the United States of America, 107, 8446–8451. [DOI] [PMC free article] [PubMed] [Google Scholar]
- Liu, T. T. (2013). Neurovascular factors in resting‐state functional MRI. NeuroImage, 80, 339–348. [DOI] [PMC free article] [PubMed] [Google Scholar]
- Liu, T. T. , & Wong, E. C. (2005). A signal processing model for arterial spin labeling functional MRI. NeuroImage, 24, 207–215. [DOI] [PubMed] [Google Scholar]
- Lorthois, S. , Cassot, F. , & Lauwers, F. (2011). Simulation study of brain blood flow regulation by intra‐cortical arterioles in an anatomically accurate large human vascular network. Part II: Flow variations induced by global or localized modifications of arteriolar diameters. NeuroImage, 54, 2840–2853. [DOI] [PubMed] [Google Scholar]
- Lu, H. , Donahue, M. J. , & van Zijl, P. C. M. (2006). Detrimental effects of BOLD signal in arterial spin labeling at high field strength. Magnetic Resonance in Medicine, 56(3), 546–552. [DOI] [PubMed] [Google Scholar]
- Lu, H. , & van Zijl, P. C. M. (2005). Experimental measurement of parenchymal BOLD effects and tissue oxygen extraction fractions using multi‐echo vassal fMRI at 1.5 and 3.0 T. Magnetic Resonance in Medicine, 53, 808–816. [DOI] [PubMed] [Google Scholar]
- Mohtasib, R. S. , Lumley, G. , Goodwin, J. A. , Emsley, H. C. A. , Sluming, V. , & Parkes, L. M. (2012). Calibrated fMRI during a cognitive Stroop task reveals reduced metabolic response with increasing age. NeuroImage, 59, 1134‐1151. [DOI] [PubMed] [Google Scholar]
- Murphy, K. , & Fox, M. D. (2017). Towards a consensus regarding global signal regression for resting state functional connectivity MRI. NeuroImage, 154, 169–173. [DOI] [PMC free article] [PubMed] [Google Scholar]
- Newman, M. E. (2008). The mathematics of networks. In Blume L. (Ed.), The new Palgrave Encyclopedia of economics. Basingstoke: Palgrave Macmillan. [Google Scholar]
- Obata, T. , Liu, T. T. , Miller, K. L. , Luh, W.‐M. , Wong, E. C. , Frank, L. R. , & Buxton, R. B. (2004). Discrepancies between BOLD and flow dynamics in primary and supplementary motor areas: Application of the balloon model to the interpretation of BOLD transients. NeuroImage, 21, 144–153. [DOI] [PubMed] [Google Scholar]
- Pandit, A. S. , Expert, P. , Lambiotte, R. , Bonnelle, V. , Leech, R. , Turkheimer, F. E. , & Sharp, D. J. (2013). Traumatic brain injury impairs small‐world topology. Neurology, 80(20), 1826–1833. 10.1212/wnl.0b013e3182929f38 [DOI] [PMC free article] [PubMed] [Google Scholar]
- Peng, S. , Ravi, H. , Sheng, M. , Thomas, B. P. , & Lu, H. (2017). Searching for a truly “iso‐metabolic” gas challenge in physiological MRI. Journal of Cerebral Blood Flow and Metabolism, 37(2), 715–725. [DOI] [PMC free article] [PubMed] [Google Scholar]
- Perthen, J. E. , Lansing, A. E. , Liau, J. , Liu, T. T. , & Buxton, R. B. (2007). Caffeine‐induced uncoupling of cerebral blood flow and oxygen metabolism: A calibrated BOLD fMRI study. NeuroImage, 40, 237–247. [DOI] [PMC free article] [PubMed] [Google Scholar]
- Power, J. D. , Barnes, K. A. , Snyder, A. Z. , Schlaggar, B. L. , & Petersen, S. E. (2012). Spurious but systematic correlations in functional connectivity MRI networks arise from subject motion. NeuroImage, 59(3), 2142–2154. [DOI] [PMC free article] [PubMed] [Google Scholar]
- Rubinov, M. , & Sporns, O. (2010). Complex network measures of brain connectivity: Uses and interpretations. NeuroImage, 52, 1059–1069. [DOI] [PubMed] [Google Scholar]
- Rubinov, M. , Ypma, R. J. F. , Watson, C. , & Bullmore, E. T. (2015). Wiring cost and topological participants of the mouse brain connectome. Proceedings of the National Academy of Sciences of the United States of America, 112, 10032–10037. [DOI] [PMC free article] [PubMed] [Google Scholar]
- Sanganahalli, B. G. , Herman, P. , Rothman, D. L. , Blumenfeld, H. , & Hyder, F. (2016). Metabolic demands of neural‐hemodynamic associated and dissociated areas in brain. Journal of Cerebral Blood Flow & Metabolism, 36(10), 1695–1707. [DOI] [PMC free article] [PubMed] [Google Scholar]
- Shu, C. Y. , Herman, P. , Coman, D. , Sanganahalli, B. G. , Wang, H. , Juchem, C. , … Hyder, F. (2016). Brain region and activity‐dependent properties of M for calibrated fMRI. NeuroImage, 125, 848–856. [DOI] [PMC free article] [PubMed] [Google Scholar]
- Shu, C. Y. , Sanganahalli, B. G. , Coman, D. , Herman, P. , Rothman, D. L. , & Hyder, F. (2016). Quantitative β mapping for calibrated fMRI. NeuroImage, 126, 219–228. [DOI] [PMC free article] [PubMed] [Google Scholar]
- Simon, A. B. , & Buxton, R. B. (2015). Understanding the dynamic relationship between cerebral blood flow and the BOLD signal: Implications for quantitative functional MRI. NeuroImage, 116, 158–167. [DOI] [PMC free article] [PubMed] [Google Scholar]
- Smith, A. J. , Blumenfeld, H. , Behar, K. L. , Rothman, D. L. , Shulman, R. G. , & Hyder, F. (2002). Cerebral energetics and spiking frequency: The neurophysiological basis of fMRI. Proceedings of the National Academy of Sciences, 99(16), 10765–10770. 10.1073/pnas.132272199 [DOI] [PMC free article] [PubMed] [Google Scholar]
- Sporns, O. , Chialvo, D. R. , Kaiser, M. , & Hilgetag, C. C. (2004). Organization, development and function of complex brain networks. Trends in Cognitive Sciences, 8(9), 418–425. [DOI] [PubMed] [Google Scholar]
- Sur, M. , & Rubenstein, J. L. R. (2004). Patterning and plasticity of the cerebral cortex. Science, 310, 805–810. [DOI] [PubMed] [Google Scholar]
- Tomasi, D. G. , Shokri‐Kojori, E. , Wiers, C. E. , Kim, S. W. , Demiral, Ş. B. , Cabrera, E. A. , … Volkow, N. D. (2017). Dynamic brain glucose metabolism identifies anti‐correlated cortical‐cerebellar networks at rest. Journal of Cerebral Blood Flow & Metabolism, 37(12), 3659–3670. [DOI] [PMC free article] [PubMed] [Google Scholar]
- Talaraich, J. , & Tournoux, P. (1988). Co‐planar stereotaxic atlas of the human brain. New York, NY: Tieme. [Google Scholar]
- van den Heuvel, M. P. , Bullmore, E. T. , & Sporns, O. (2016). Comparative connectomics. Trends in Cognitive Sciences, 20, 345–361. [DOI] [PubMed] [Google Scholar]
- van den Heuvel, M. P. , Stam, C. J. , Kahn, R. S. , & Hulshoff Pol, H. E. (2009). Efficiency of functional brain networks and intellectual performance. The Journal of Neuroscience, 29, 7619–7624. [DOI] [PMC free article] [PubMed] [Google Scholar]
- Watts, D. J. , & Strogatz, S. H. (1998). Collective dynamics of ‘small‐world’ networks. Nature, 393, 440–442. [DOI] [PubMed] [Google Scholar]
- West, K. L. , Sivakolundu, D. K. , Maruthy, G. B. , Zuppichini, M. D. , Liu, P. , Thomas, B. P. , … Rypma, B. (2020). Baseline cerebral metabolism predicts fatigue and cognition in Multiple Sclerosis patients. NeuroImage: Clinical, 27. 10.1016/j.nicl.2020.102281 [DOI] [PMC free article] [PubMed] [Google Scholar]
- Whittaker, J. R. , Driver, I. D. , Venzi, M. , Bright, M. G. , & Murphy, K. (2019). Cerebral autoregulation evidenced by synchronized low frequency oscillations in blood pressure and resting‐state fMRI. Frontiers in Neuroscience, 13, 1–12. 10.3389/fnins/2019.00433 [DOI] [PMC free article] [PubMed] [Google Scholar]
- Whitfield‐Gabrieli, S. , & Ford, J. M. (2012). Default mode network activity and connectivity in psychopathology. Ann Rev Clin Psychol, 8, 49‐76. [DOI] [PubMed] [Google Scholar]
- Woo, C. , Chang, L. J. , Lindquist, M. A. , & Wager, T. D. (2017). Building better biomarkers: Brain models in translational neuroimaging. Nature Neuroscience, 20(3), 365–377. [DOI] [PMC free article] [PubMed] [Google Scholar]
- Wu, C. , Gu, H. , Lu, H. , Stein, E. , Chen, J. , & Yang, Y. (2009). Mapping functional connectivity based on synchronized CMRO2 fluctuations during resting state. NeuroImage, 45(3), 694–701. [DOI] [PMC free article] [PubMed] [Google Scholar]
- Yarkoni, T. , Poldrack, R. A. , Nichols, T. E. , Van Essen, D. C. , & Wager, T. D. (2011). Large‐scale automated synthesis of human functional neuroimaging data. Nature Methods, 8(8), 665‐670. [DOI] [PMC free article] [PubMed] [Google Scholar]
- Yeo, B. T. , Krienen, F. M. , Sepulcre, J. , Sabuncu, M. R. , Lashkari, D. , Hollinshead, M. , … Buckner, R. L. (2011). The organization of the human cerebral cortex estimated by intrinsic functional connectivity. Journal of Neurophysiology, 106, 1125–1165. [DOI] [PMC free article] [PubMed] [Google Scholar]
- Yu, Y. , Herman, P. , Rothman, D. L. , Agarwal, D. , & Hyder, F. (2017). Evaluating the gray and white matter energy budgets of human brain function. Journal of Cerebral Blood Flow and Metabolism, 0, 1–15. [DOI] [PMC free article] [PubMed] [Google Scholar]
- Yücel, M. A. , Evans, K. C. , Selb, J. , Hppert, T. J. , Boas, D. A. , & Gagnon, L. (2014). Validation of hypercapnic calibrated fMRI method using DOT‐fMRI fusion imaging. NeuroImage, 102, 729–735. [DOI] [PMC free article] [PubMed] [Google Scholar]
- Zhang, J. , Cho, J. , Zhou, D. , Nguyen, T. D. , Spincemaille, P. , Gupta, A. , & Wang, Y. (2018). Quantitative susceptibility mapping‐based cerebral metabolic rate of oxygen mapping with minimal local variance. Magnetic Resonance in Medicine, 79, 172–179. [DOI] [PubMed] [Google Scholar]
Associated Data
This section collects any data citations, data availability statements, or supplementary materials included in this article.
Supplementary Materials
Appendix S1: Supporting information
Data Availability Statement
De‐identified data and code will be made available upon request to the corresponding author.