

Abstract
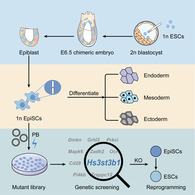
Epiblast stem cells (EpiSCs) derived from postimplantation epiblast are pluripotent stem cells, epigenetically distinct from embryonic stem cells (ESCs), which are widely used in reprogramming studies. Recent achieved haploid cell lines in mammalian species open a new era for high‐throughput genetic screening, due to their homozygous phenotypes. Here, we report the generation of mouse haploid EpiSCs (haEpiSCs) from postimplantation chimeric embryos at embryonic day 6.5 (E6.5). These cells maintain one set of chromosomes, express EpiSC‐specific genes, and have potentials to differentiate into three germ layers. We also develop a massive mutagenesis protocol with haEpiSCs, and subsequently perform reprogramming selection using this genome‐wide mutation library. Multiple modules related to various pathways are implicated. The validation experiments prove that knockout of Hst3st3b1 (one of the candidates) can promote reprogramming of EpiSCs to the ground state efficiently. Our results open the feasibility of utilizing haEpiSCs to elucidate fundamental biological processes including cell fate alternations.
Keywords: CRISPR, differentiation, epiblast stem cells, reprogramming
Mouse haploid epiblast stem cells (haEpiSCs) can be derived from E6.5 postimplantation chimeric epiblast, which are pluripotent with a single genome. Genome‐scale gene trapping in haEpiSCs provides a platform to uncover essential genes regulating cellular reprograming. Knocking out one of the candidate genes, Hs3st3b1, greatly improves the efficiency of reprogramming from EpiSCs to embryonic stem cells.
Significance statement.
Haploid epiblast stem cells derived from postimplantation provide a haploid platform to study nature of epiblast. Unique mammalian haploid stem cells generate massive homozygous mutations robustly. The results from this study showed multiple candidate genes hindering reprogramming process including Hs3st3b1.
1. INTRODUCTION
Mammalian haploid cell lines have raised extensive concerns over the past decade for their advantages of generating homozygous genotypes, which are widely used for forward and reverse genetic screening. 1 , 2 Haploid embryonic stem cells (haESCs) are pluripotent stem cells with a single set of chromosomes, 3 serving as a convenient platform to elucidate targeting genes of important biological processes including differentiation 4 and X chromosome inactivation (XCI). 5 Besides, haESCs also have advantages in finding out targeting genes of highly poisonous toxicant 6 , 7 because of their homozygous phenotype feature, thus are useful for studying molecular mechanisms behind these potential bioweapons. To explore the application of haploid cells in more fields, haploid somatic cells 8 , 9 and haploid trophoblast stem cells 10 , 11 have been achieved and proved advanced in lineage specific genetic screening, either. However, whether there are more other types of haploid pluripotent stem cells needs further investigations.
Mouse epiblast stem cells (EpiSCs) derived from postimplantation epiblast resemble to human ESCs in morphology, dependent pathways for self‐renewal and other molecular characteristics. 12 , 13 EpiSCs are at primed pluripotent state that epigenetically distinct from ESCs at naïve pluripotent state (ground state), 14 which are widely utilized to study reprogramming mechanisms. 15 , 16 , 17 These findings of reprogramming in mouse EpiSCs definitely facilitate the derivation of human naïve ESCs at ground state. 18 , 19 , 20 EpiSCs maintain self‐renewal relying on activin/nodal and FGF/ERK pathways, whose growth and pluripotency can be favored by inhibition of Wnt signaling pathway. 21 They possess the potentials to differentiate into three germ layers in vitro and in teratomas, and undergo random XCI coincident with postimplantation epiblast. 14 Therefore, a haploid cell line of EpiSCs will provide a powerful platform to study reprogramming, XCI, and other critical biological processes by genetic screening. However, haploid EpiSCs (haEpiSCs) have not been established from postimplantation embryos up to date, mainly because of severe diploidization happening during differentiation in vivo. 22 , 23
Given that p53 deletion can stabilize haploidy in mouse cell cultures, 11 , 24 , 25 it might be possible to generate haEpiSCs by p53 knockout (KO). In this study, we derived haEpiSCs from mouse postimplantation epiblast at embryonic day 6.5 (E6.5), which showed standard primed state morphology and similar molecular characteristics with wild‐type (WT)‐diploid EpiSCs. Moreover, we provided the evidence that haEpiSCs have steady haploidy maintaining ability and differentiation potentials, which could be utilized in forward genetic screening. Our study provides an experimental system that sheds light on functional genomics in mammalian reprogramming.
2. MATERIALS AND METHODS
2.1. Mice and chimeric embryos reconstruction
All the specific pathogen‐free (SPF)‐grade WT mice were purchased from Beijing Vital River Laboratory Animal Technology Co, Ltd (Beijing, China), and genetically modified p53‐KO mice were purchased from Beijing Biocytogen Co, Ltd (Beijing, China). All the mice were housed at the Nankai University Animal Center. All the animal experiments were performed in compliance with the guidelines of the Institutional Animal Care and Use Committee of Nankai University. All the chimeric embryos were reconstructed by microinjecting into blastocysts. The reconstructed chimeric embryos were transferred to oviducts of pseudopregnant CD‐1 mice at 0.5 d.p.c. for subsequent experiments.
2.2. Cell culture and cytometric sorting
WT‐haESCs and p53‐KO haESCs were generated according to a well‐developed protocol with slight modification. 26 Androgenetic haESCs (p53 KO‐6, sperm: 129Sv/Jae; oocyte: B6D2F1) and parthenogenetic haESCs (p53 KO‐1, oocyte: 129Sv/Jae) were from 129Sv/Jae background strain. haEpiSCs were derived from E6.5 chimeric embryos (p53 KO‐1 or p53 KO‐6 haESCs as donor cells). p53‐KO diploid EpiSCs were derived from E6.5 embryos of p53‐KO mice. The culture medium and derivation protocols were referred to the previous report as described. 21 The established haEpiSCs were cultured in EpiSCs medium with 2 μM IWP‐2 (MCE, HY‐13912, USA) and passaged with 1 mg/mL collagenase IV (Thermo Fisher Scientific, 17104‐019, USA) every 2 to 3 days. To obtain WT or p53‐KO haploid EpiSC‐like cells (haEpiLCs), WT or p53‐KO haESCs were induced according to the previous report as described. 27 All of the cell cultures were tested for mycoplasma free by PCR with specific primers weekly. For DNA staining sorting, haEpiSCs were incubated with 10 μg/mL Hoechst 33342 (Invitrogen, H3570, USA) for 20 minutes at 37°C before sorting. Subsequently, all the samples were performed cell sorting on a Moflo XDP sorter (Beckman, USA) with logical gating. For flow cytometry analysis of primordial germ cell (PGC) like cells (PGCLCs), haEpiSCs and 4‐day aggregates were dissociated in 0.25% trypsin‐EDTA (Gibco, 25200072, USA), resuspended in PBS supplemented with 1% BSA and incubated with anti‐integrin β3 (CD61) (BioLegend, 104308, USA), and anti‐SSEA1 (eBioscience, 51‐8813‐42, USA) antibodies for 30 minutes at 4°C before sorting.
2.3. Vector construction and transfection
Gene trapping piggyBac vectors were constructed according to the previous report. 11 haEpiSCs were transfected using the electroporator (Invitrogen, NEON, USA) at 1400 V, 10 ms with three pulses or LTX kit (Invitrogen, 15338100, USA) following the manufacturer's instructions. A combination of 1 μg PBase plasmid and 3 μg piggyBac (SA) plasmid were electroporated into 1 × 10⁶ haEpiSCs using the same conditions as described above. For Oct4 DE‐SV40‐Luc and PE‐SV40‐Luc constructs, distal enhancer and proximal enhancer (PE) of mouse Oct4 were amplified from mouse genomic DNA and inserted into the Nhel site of pGL3‐promoter (Promega, E1761, USA) using DNA Ligation Kit Ver.2.1 (Takara, 6022, Japan), respectively. For Hs3st3b1 KO, a combination of 2 μg PX458‐sgRNA1 and 2 μg PX458‐sgRNA2 plasmid were electroporated into 1 × 10⁶ haEpiSCs using the same conditions as described above.
2.4. Quantitative real‐time PCR
Following the manufacturer's protocol to purify total RNAs from cells using TRIzol Reagent (Invitrogen, 15596018, USA), cDNA was obtained by reverse transcription using the Prime Script RT reagent Kit with a gDNA Eraser (Takara, RR047A, Japan). All the qPCR experiments were performed on an ABI QuantStudio 6 Flex machine with FS Universal SYBR Green Master (Roche, 4913914001, Switzerland). Relative expression levels were normalized to Gapdh. Averages and SD values were calculated based on three independent experiments. All primers used are listed in Table S1.
2.5. Immunostaining, alkaline phosphatase (AP) staining, and karyotype analysis
Immunostaining, AP staining and karyotype analysis of haEpiSCs were performed as described previously. 28 Primary antibodies including TFE3 (Sigma, HPA023881, USA), H3K27me3 (AB clonal, A2363, China), OCT4 (Abcam, ab181557, UK), NANOG (Santa Cruz, sc‐374103, USA), PAX6 (Abcam, ab5790, UK), SOX1 (R&D, AF3369, USA), TUJ1 (Abcam, ab8207, UK), and SSEA‐1 (CST, 4744, USA). The fluorescent secondary antibodies and DAPI were purchased from the Abcam company (UK). Immunofluorescence images were captured with a TCS SP8 confocal laser scanning microscope (Leica, Germany).
2.6. Differentiation of haEpiSCs
To detect the differentiation potentials of haEpiSCs, cells were floating cultured with Ndiff medium (Takara, Y40002, Japan) in nontreated dishes (Falcon, USA) for 6 days. For neural differentiation, haEpiSCs were plated into culture dishes pre‐coating with poly‐D‐lysine (PDL) (Sigma, P4957, USA) and Laminin (Sigma, L2020, USA), and cultured in Ndiff medium supplemented with 0.5 mM retinoic acid (Sigma, R2625, USA).
For induction of PGCLCs from haEpiSCs, the PGCLCs were induced under a floating condition by plating 2 × 10³ haEpiSCs in a well of a low‐cell‐binding U‐bottom 96‐well plate (Costar, 7007, USA) in a serum‐free medium (GK15; GMEM [Gibco, 11710035, USA] with 15% KSR [Gibco, A3181502, USA], 0.1 mM NEAA [Gibco, 11140050, USA], 1 mM sodium pyruvate [Sigma, p4562, USA], 0.1 mM 2‐mercaptoethanol [Gibco, 21985023, USA], 100 U/mL Penicillin‐Streptomycin [Gibco, 15140122, USA], and 2 mM Glutamax [Gibco, 35050061, USA] in the presence of the cytokines BMP4 [500 ng/mL; Peprotech, AF‐120‐05ET, USA], LIF [1000 U/mL; Sino Biological, 50756‐MNAH, China], SCF [100 ng/mL; Peprotech, 250‐03, USA] and human EGF [Peprotech, AF‐100‐15, USA]). The medium was changed every day.
For teratoma formation experiment, approximately 1 × 10⁶ haEpiSCs were injected subcutaneously into the limbs of 8‐week‐old male severe combined immunodeficiency (SCID) mice. Three weeks later, the fully formed teratomas were dissected, fixed with 4% paraformaldehyde, embedded in paraffin, sectioned, and stained with hematoxylin and eosin for further analysis.
2.7. Analysis of RNA‐seq and genome integrity data
All the RNA and genomic DNA samples were sent to a sequencing company (Novogene, China) for sequencing. Raw reads of fastq format were firstly processed through in‐house perl scripts. In this step, clean data (clean reads) were obtained by removing reads containing adapter, reads containing ploy‐N, and low‐quality reads from raw data. 29 All the downstream analyses were based on the clean data with high quality. Reference genome (mm10) and gene model annotation files were downloaded from genome website directly. Index of the reference genome was built using Hisat2 v2.0.5 and paired‐end clean reads were aligned to the reference genome using Hisat2 v2.0.5. Then, the abundance of each transcript was quantified using feature Counts v1.5.0‐p3. Differentially expressed genes (DEGs) analysis was performed using the DEseq2 package, and gene expression was normalized using the relative‐log‐expression (RLE) in DESeq2. 30 Genes with an adjusted P‐value <.05 found by DESeq2 were assigned as differentially expressed.
For gene ontology (GO) analysis, metascape (http://metascape.org) was employed to perform gene enrichment and functional annotation analyses in haEpiSCs, male and female WT‐diploid EpiSCs with the following ontology sources: Kyoto Encyclopedia of Genes and Genomes (KEGG) Pathway, GO Biological Processes, and Reactome Gene Sets. 31 GO terms with corrected P‐value <.05 were considered significantly enriched by differential expressed genes. KEGG analysis was used cluster Profiler R package to test the statistical enrichment of differential expression genes in KEGG pathways. For genomic integrity analysis (copy number variation [CNV] analysis) was referred to a previous protocol. 7
2.8. Genetic screening and splinkerrette PCR‐based sequence analysis
haEpiSCs were transfected with the trapping vectors (Figure 4A) and further cultured for 5 days. Mutant haEpiSCs were enriched for GFP positive cells through cell sorting, and were reprogrammed in N2B27/2iL medium (Ndiff medium supplemented with 1500 U/mL leukemia inhibitory factor [Millipore, ESG1107, USA], 1 μM PD0325901 [MCE, HY‐10254, USA], and 3 μM CHIR99021 [MCE, HY‐10182, USA]). Cells positive for SSEA‐1 (Thermo Fisher Scientific, 50881342, USA) among the reprogrammed cells were harvested by antibody staining and sorting according to the manufacturer's instructions. Nonmutant haEpiSCs in EpiSCs medium and N2B27/2iL were used as SSEA‐1 negative control.
FIGURE 4.
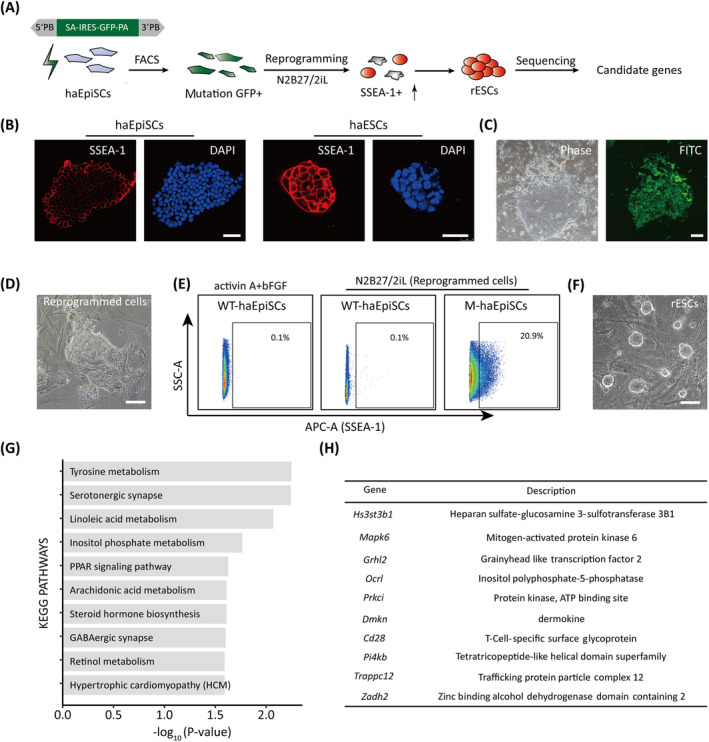
Forward genetic screening for reprogramming in haEpiSCs. A, Schematic view of the genetic screen in haEpiSCs by PB‐based gene trap vectors. B, Immunofluorescence of SSEA‐1 of haEpiSCs and haESCs. DNA was stained with DAPI. Scale bar = 50 μm. C, Bright‐field and FITC images of haEpiSCs after transfection. Scale bar = 100 μm. D, Morphology of reprogrammed cells in N2B27/2iL medium. Scale bar = 100 μm. E, Percentage of SSEA‐1 positive cells in mutant haEpiSCs (M‐haEpiSCs) and WT‐haEpiSCs cultured in N2B27/2iL medium. WT‐haEpiSCs cultured in activin A + bFGF medium were used as a negative control. F, Morphology of rESCs derived from mutant haEpiSCs. Scale bar = 100 μm. G, KEGG analysis of the top 100 genes with the most frequent insertions. H, List of the top 10 genes with the most insertion sites
Splinkerrette PCR was used to figure out the insertion sites after piggyBac transposon transfection. Briefly, the genomic DNA purified from cells was digested by BstYI (Thermo Fisher Scientific, FD1554, USA). Purified products were linked to Splinkerette adaptors using DNA Ligation Kit Ver.2.1 (Takara, 6022, Japan) for nest PCR. Nest PCR products were linked into pEASY Blunt simple vectors (TransGen Biotech, CB111, China) for high‐throughput sequencing. All primers and Splinkerette adaptors used were listed in Table S1. For insertions analysis, reads were trimmed using fastp 32 to remove sequencing adapters and low‐quality bases. HaSAPPy 33 was used to map the trimmed reads to the genome assembly from UCSC (mm10) 34 and estimate the number of insertions for each gene using the annotation from Gencode 35 with default parameters. Read distributions across different regions were summarized using bedtools. 36 The coverage tracks were generated using R package ggbio. 37 For enrichment analysis, top 100 significant gene sets were retrieved from the GO 38 and KEGG databases. 39 Fisher's exact test followed by the Benjamini‐Hochberg correction 40 was used to generate the FDR.
3. RESULTS
3.1. Derivation of haEpiSCs from postimplantation chimeric embryos
Haploid embryos can develop to the blastocyst stage, 41 however, rare to postimplantation stage in development in vivo. Many studies showed that haESCs could contribute to postimplantation E6.5 epiblast via chimeric assays, 22 , 23 and thus we tried to derive haEpiSCs from these chimeric E6.5 embryos (Figure S1A). With microinjecting p53‐KO haESCs into WT‐blastocysts and transferring them back to pseudopregnant mice, standard E6.5 embryos were developed and utilized to generate haEpiSCs (Figure 1A). Around 5 days after plating the epiblast of chimeric embryos, EpiSC‐like outgrowth formed (Figure 1B) in presence of bFGF, activin A and IWP‐2 (a Wnt inhibitor) and expanded with collagenase IV. In a preliminary experiment, the generation of haEpiSCs from chimeric embryos with WT‐haESCs contribution was failed, mainly for quick diploidization existing during differentiation in vivo. To address this, we adopted p53‐KO haESCs from p53‐KO mice instead of WT‐haESCs as donor cells in chimeric assays, which presented stable maintenance of haploidy during differentiation. Hereafter, we totally derived two androgenetic haEpiSC lines and six parthenogenetic haEpiSC lines from mice at 129Sv/Jae background (Figure S1B), which showed typical “primed” state flat colonies, compared to WT‐diploid EpiSCs (Figure 1C). According to the karyotype analysis, haEpiSCs carried a haploid set of 20 chromosomes during daily cell culture (Figure 1D). Individual haEpiSC lines were expanded and sorted by fluorescence‐activated cell sorting (FACS) with a WT‐diploid EpiSC line as control. Stable haploidy haEpiSCs were generated assisted with period FACS enrichment in long‐term proliferation and maintained haploidy over 30 passages (Figure 1E).
FIGURE 1.
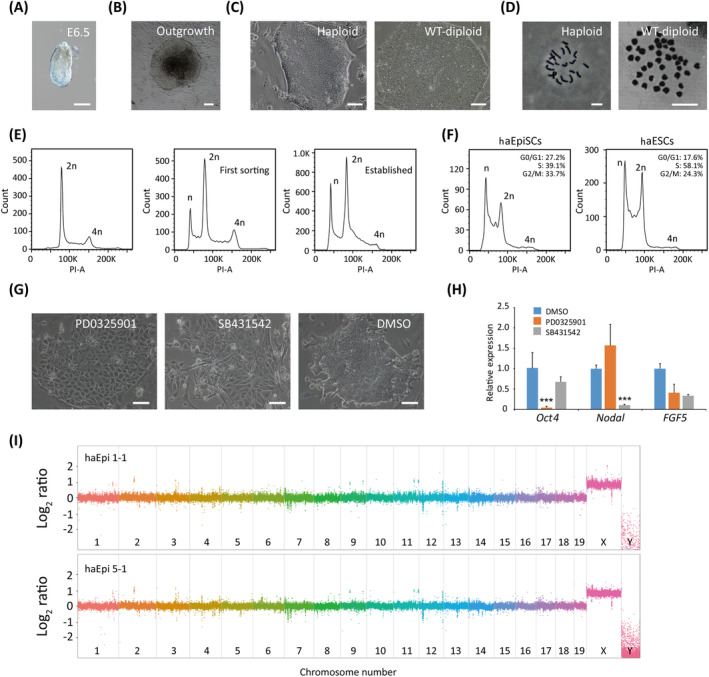
The establishment of haEpiSCs. A, Image of E6.5 chimeric embryo derived from haESCs; scale bar = 100 μm. B, Image of outgrowth derived from E6.5 epiblast; scale bar = 100 μm. C, Colonies of haEpiSCs and WT‐diploid EpiSCs; scale bar = 100 μm. D, Chromosomes spread analysis of haEpiSCs (19 + X) and WT‐diploid EpiSCs (38 + XX/Y); scale bar = 10 μm. E, DNA content analysis after propidium iodide (PI) staining of WT‐diploid EpiSCs (left panel), first sorting of haEpiSCs (middle panel) and established haEpiSCs (right panel). The percentages of the 1n (G0/G1) peak in first sorting haEpiSCs and established haEpiSCs were 13.7% and 21.9%, respectively. F, Cell‐cycle profiles of haEpiSCs and haESCs. The percentage of G0/G1, S and G2/M phase in haEpiSCs (27.2%, 39.1%, and 33.7%) and haESCs (17.6%, 58.1%, and 24.3%), respectively. G, Morphology changes of haEpiSC colonies treated with two inhibitors (PD0325901, ERK‐inhibitor, suppressing FGF pathway; SB431542, TGF‐β inhibitor, suppressing activin/Nodal pathway) separately for 3 days. DMSO was used as an empty control. Scale bar = 100 μm. H, Expression levels of pluripotent (Oct4) and EpiSC marker genes (Nodal and FGF5) in haEpiSCs following inhibitors treatment. t test, ***P < .001. Data were represented as the mean ± SEM. I, CNV analysis of haEpiSCs (haEpi 1‐1 and haEpi 5‐1) with the male 129Sv/Jae kidney DNA as control, on a log2 base scale
Next, we characterized the identity of haEpiSCs in cell‐cycle profiles and dependent pathways for self‐renew. According to the DNA content analysis, haEpiSCs had 27.2%, 39.1%, and 33.7% of cells in G0/G1 phase, S phase, and G2/M phase, whereas the proportion of haESCs cells was 17.6%, 58.1%, and 24.3%, respectively (Figure 1F). It indicated that haEpiSCs and haESCs have different cell cycle characteristics, which could also be observed between WT‐diploid EpiSCs and WT‐diploid ESCs (Figure S1C). As previously reported, WT‐diploid EpiSCs maintained self‐renewal ability, mainly relying on FGF/ERK and activin/nodal signaling pathways. 12 To test reliable pathways of our haEpiSCs, we treated them by adding PD0325901 (an inhibitor of FGF/ERK) and SB431542 (an inhibitor of activin/Nodal) to the cell cultures independently, with adding DMSO as a control. Obvious differentiation of haEpiSCs was observed in either PD0325901 group or SB431542 group, whereas the control group maintained undifferentiated state (Figure 1G). Quantitative PCR (qPCR) analysis of pluripotent (Oct4) and pathway specific (Nodal and FGF5) genes further confirmed that (Figure 1H). Taken together, our results demonstrated that haEpiSCs had similar cell‐cycle profile and same dependent pathways with WT‐diploid EpiSCs. To further assess genomic integrity of haEpiSCs, we compared their genomes to the genome of a male mouse kidney from 129Sv/Jae strain using deep sequencing and performed CNV analysis. The results revealed that our haEpiSCs did not present obvious copy numbers duplication or deletion in a haploid state (Figure 1I), indicating that haEpiSCs maintained genomic integrity in cell culture without genomic mutations.
3.2. Molecular characterization of haEpiSCs
To characterize our newly established haEpiSCs, we examined the expression files of specific genes by qPCR. Results demonstrated that haEpiSCs expressed pluripotent genes (Oct4 and Nanog) and EpiSC specific genes (Nodal, FGF5, and Cldn6), that resembled to the WT‐diploid EpiSCs control (Figure 2A). Since the subcellular localization of TFE3 was a widely used sensitive marker to distinguish the naïve state and primed state of pluripotency, 42 we performed immunostaining of TFE3 in haEpiSCs and haESCs. All TFE3 in haEpiSCs located in cytoplasm rather than in the nucleus, which was different from that of haESCs, indicating that haEpiSCs were at primed pluripotent state in deed (Figure 2B). According to previous reports, female EpiSCs exhibited one XCI and showed the accumulation of the repressive histone 3 lysine 27 trimethylation (H3K27me3) chromatin. 15 , 43 To assess the X chromosome activity of haEpiSCs, we detected the expression of H3K27me3 in haEpiSCs and female WT‐diploid EpiSCs. It showed that H3K27me3 was not enriched in the nuclei of haEpiSCs, which meant haEpiSCs did not undergo XCI like female WT‐diploid EpiSCs (Figure 2C). Furthermore, qPCR results revealed that Xist was downregulated and Tsix was upregulated in haEpiSCs, compared with that in female diploid EpiSCs (Figure 2D). It also proved that the sole X chromosome of each haEpiSC was activated.
FIGURE 2.
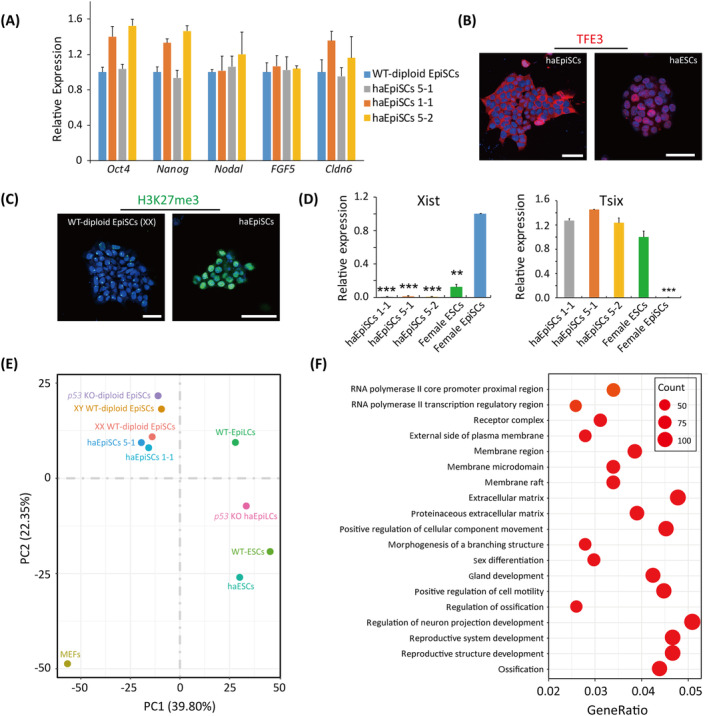
Molecular and transcriptome identities of haEpiSCs. A, Expression levels of pluripotency (Oct4 and Nanog) and EpiSCs specific genes (Nodal, FGF5, and Cldn6) in haEpiSCs and wild‐type WT‐diploid EpiSCs determined by qPCR. Data were represented as the mean ± SEM. B, Immunofluorescence of TFE3 in haEpiSCs and haESCs. DNA was stained with DAPI. Scale bar = 50 μm. C, Immunofluorescence of H3K27me3 in haEpiSCs and WT‐diploid EpiSCs (XX). DNA was stained with DAPI. Scale bar = 50 μm. D, Expression levels of Xist and Tsix in haEpiSCs, female ESCs and female EpiSCs determined by qPCR. t test, **P < .001, ***P < .001. Data were represented as the mean ± SEM. E, Principal component analysis (PCA) of RNA‐seq data from haEpiSCs, WT‐diploid EpiSCs, p53 KO‐diploid EpiSCs (diploid EpiSCs derived from p53‐KO epiblast), WT‐EpiLCs (EpiLCs derived from differentiated WT‐ESCs in culture), p53 KO‐haEpiLCs (EpiLCs derived from differentiated p53 KO‐haESCs in culture), WT‐ESCs, haESCs, and MEFs. The results showed that haEpiSCs were close to WT‐diploid EpiSCs on both PC1 and PC2 axes, and far away from WT‐EpiLCs and p53 KO‐diploid haEpiLCs. F, Differentially expressed genes ontologies in haEpiSCs and haESCs
To further elucidate the properties of haEpiSCs, we performed RNA‐seq analysis to know the transcriptional states of haEpiSCs (a parthenogenetic line [haEpi 5‐1] and an androgenetic line [haEpi 1‐1]), WT‐diploid EpiSCs (XX and XY), p53 KO‐diploid EpiSCs, WT‐Epiblast like cells (EpiLCs), p53 KO‐haploid EpiLCs, haESCs, WT‐diploid ESCs, and mouse embryonic fibroblasts (MEFs). For overall expression of genes, MEFs had a wider expression, whereas haEpiSCs shared the similar expression distribution with WT‐diploid EpiSCs (Figure S2A). Furthermore, there was a high correlation (R 2 > 0.9) between haEpiSCs and WT‐diploid EpiSCs at the global transcriptome level, showing a close genetic relationship (Figure S2B). Principal component analysis based on DEGs showed that haEpiSCs extremely resembled WT‐diploid EpiSCs and p53 KO‐diploid EpiSCs on both PC1 and PC2 axes, but separated from the clusters of WT‐EpiLCs, p53 KO‐haploid EpiLCs, haESCs, WT‐diploid ESCs, and MEFs (Figure 2E). Moreover, haEpiSCs located between MEFs and ESCs in PC1, indicating their limited pluripotency compared to ESCs. To comprehensively understand the differences between haESCs and haEpiSCs, we identified 2141 DEGs between haEpiSCs and haESCs and performed functional annotation. According to the GO analysis, 2141 DEGs were mostly enriched with term related to the regulation of neuron projection development, reproductive system development, reproductive structure development, and extracellular matrix (Figure 2F). In addition, KEGG pathway analysis revealed that most of the downregulated genes were correlated with pluripotency, metabolism, and glycosphingolipid biosynthesis (Figure S2C).
3.3. Differentiation potentials of haEpiSCs
To test the differentiation potentials of our haEpiSCs, we first detected the expression of typical pluripotent markers in haEpiSCs by immunostaining. NANOG was observed positive in haEpiSCs, but exhibited lower expression level than that in haESCs (Figure 3A), which was consistent with previously reported WT‐diploid EpiSCs. 21 OCT4 was also positive in haEpiSCs (Figure 3B), whose expression was driven by an Oct4 PE regulatory site distinct from that in haESCs (Figure 3C). Both haEpiSCs and WT‐diploid EpiSCs showed positivity of AP activity (Figure S3A). Differentiation was further confirmed using embryoid body (EB) formation. Approximately 6 days post random differentiation, round and smooth EBs formed from haEpiSCs (Figure S3B), which expressed differentiated genes representing three germ layers (Cdx2, Bmp4, and Nestin), rather than EpiSC specific and pluripotent genes (Figure 3D). In addition, neural differentiation of haEpiSCs was induced by a chemical defined medium according to a previous report. 44 One week later, neural precursors marker‐PAX6 was observed in the cell culture by immunostaining indicating (Figure 3E). For a longer differentiation period, immunostaining results showed that other neural lineage markers (SOX1 and TUJ1) were also detected in the cultures (Figure 3F). The percentages of SOX1 and TUJ1 positive cells in the cultures were 57.7% and 3% (Figure 3G), respectively. Furthermore, qPCR analysis of neural specific markers (Nestin, Pax6, and Tuj1) also confirmed the neural lineage identity of these differentiated cells (Figure 3H). Next, we examined differentiation potential of haEpiSCs to PGCs according to a previous protocol. 27 Typical PGCLC aggregates formed on day 4 when floating cultured in GMEM with 15% KSR (GK15) and with cytokines including BMP4 (Figure 3I). Flow cytometry analysis of haEpiSCs‐derived 4‐day aggregates for the PGC specific markers integrin β3 and SSEA1 showed that around 10.8% cells were double‐positive (Figure 3J). It indicated that haEpiSCs could differentiate into PGC stage somehow. Altogether, these data demonstrated that haEpiSCs held pluripotency in vitro. To address the differentiation potentials of haEpiSCs in vivo, we injected 1 × 10⁶ haEpiSCs into limbs of 8‐week‐old male SCID mice. Standard teratoma formed 3 weeks post injection (Figure S3C) and had tissues representing three germ layers according to H&E analysis (Figure 3K). Next, we performed chimera production to further assess the differentiation potential of haEpiSCs in vivo. GFP‐labeled haEpiSCs and haESCs (Figure S3D) were microinjected into blastocyst and transferred to the oviducts of pseudopregnant mice separately. Only GFP‐labeled haESCs could contribute to postimplantation epiblast, whereas GFP‐labeled haEpiSCs could not (Figure 3L; Figure S3E). It was consistent with previous reported EpiSCs, which further confirmed EpiSC nature of haEpiSCs.
FIGURE 3.
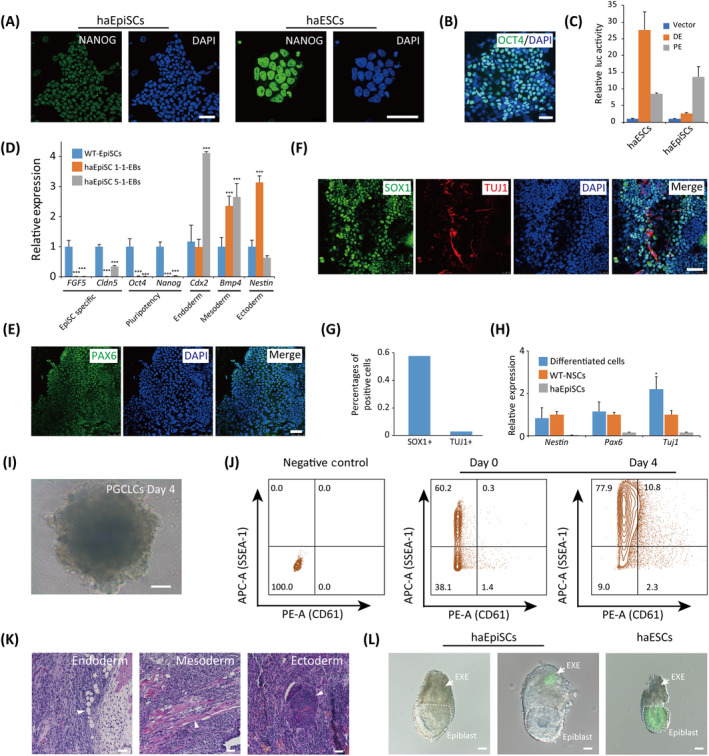
Differentiation potentials of haEpiSCs. A, Immunofluorescence of NANOG in haEpiSCs and haESCs. DNA was stained with DAPI. Scale bar = 50 μm. B, Immunofluorescence of OCT4 in haEpiSCs. DNA was stained with DAPI. Scale bar = 50 μm. C, Quantification of Oct4 distal enhancer (DE) and proximal enhancer (PE) reporter gene activity in haEpiSCs and haESCs. Relative luciferase activity was normalized to the activity of the empty vector. Data are represented as the mean ± SEM. D, Expression levels of EpiSCs specific (FGF5 and Cldn5), pluripotency (Oct4 and Nanog) and differentiation genes (Cdx2, Bmp4, and Nestin) in EBs derived from haEpiSCs 1‐1 and haEpiSCs 5‐1 determined by qPCR. haEpiSCs as control. t test, ***P < .001. Data are represented as the mean ± SEM. E, Immunofluorescence of PAX6 in neural differentiation cell cultures of haEpiSCs. DNA was stained with DAPI. Scale bar = 50 μm. F, Double immunostaining of SOX1 and TUJ1 in neural differentiation cell cultures of haEpiSCs. DNA was stained with DAPI. Scale bar = 50 μm. G, Percentages of SOX1 and TUJ1 positive cells in neural differentiation cell cultures of haEpiSCs. SOX1, 57.7% and TUJ1, 3%. H, Expression levels of neural lineage specific genes (Nestin, Pax6, and Tuj1) in neural differentiation cell cultures of haEpiSCs, compared to differentiated cells and WT‐NSCs (derived from brain) determined by qPCR. t test, *P < .05. Data were represented as the mean ± SEM. I, Morphology of haEpiSCs‐derived aggregates on days 4 of PGCLC induction. Scale bar = 100 μm. J, FACS analysis of integrin β3 (CD61) and SSEA‐1 positive cells in the 4‐day aggregates derived from haEpiSCs. K, Teratoma formed from haEpiSCs identified by hematoxylin and eosin staining. Scale bar = 100 μm. White arrow indicates gut epithelium (endoderm), muscle (mesoderm), and neural tissue (ectoderm). L, Morphology of chimeric embryos at E6.5 derived from GFP‐labeled haEpiSCs and haESCs. Scale bar = 100 μm. White arrow indicates EXE and dotted lines indicates Epiblast
3.4. A genome‐wide screen for reprogramming with haEpiSCs
To explore the feasibility of using haEpiSCs in a genome‐wide screening, we performed reprogramming experiment with high‐throughput mutant haEpiSC library (Figure 4A). Since WT‐diploid EpiSCs could revert to ESCs stage through overexpression of naïve specific transcription factors (Klf4 or Nr5a2) and culturing in N2B27/2iL medium, 15 , 45 we adopted this N2B27/2iL medium as a screening medium either. Although SSEA‐1 was an extensively used pluripotent marker in various experimental procedures, 43 expression of SSEA‐1 in haEpiSCs was obviously lower than that in haESCs (Figure 4B). Hence, the increase of SSEA‐1 by sorting antibody indicating was applied as the readout system for reprogramming procedure (Figure 4A). To introduce massive mutations into haEpiSCs, PB‐SA‐based (carrying a GFP cassette) gene trap vectors (Figure 4A) were eletroporated into haEpiSCs. Nearly 5 days post transfection, GFP positive cells were sorted by FACS for further culture. Mutated haEpiSCs could be indicated by GFP positive (Figure 4C), and then cultured in N2B27/2iL medium to initiate reprogramming. Approximately 3 to 5 days later, reversed ESCs (rESCs) colonies emerged in the reprogrammed cell cultures (Figure 4D). SSEA‐1 positive cells were enriched from the reprogrammed cell cultures, with WT‐haEpiSCs without mutation as controls (one in ESCs medium, the other in EpiSCs medium). About 20.9% of SSEA‐1 positive cells were sorted for further culture (Figure 4E), which we termed rESCs. Not only standard “domed” naïve colonies were observed in rESCs (Figure 4F), but also pluripotent and naïve markers were positive in rESCs (Figure S4A,B). Thereafter, we performed Splinkerette PCR (Figure S4C) and deep sequencing to elucidate these insertions. According to the deep sequencing, we could unambiguously identify approximately 7 million insertions totally, 49.3% of which integrated into the sense orientation, whereas 50.7% in the antisense orientation (Figure S4D). About 49.8% of the insertions were mapped to the intron regions, whereas 3.3% to the exons and 2.0% to the promoters, respectively (Figure S4E).
To further investigate these insertions, we performed KEGG analysis. The results revealed that most insertions were related to Tyrosine metabolism, Serotonergic synapse, and other biological processes (Figure 4G). Multiple insertions were mapped to Insulin pathway, PI3K‐Akt pathway, and other essential pathways (Table 1). Top 10 frequency insertions including Hs3st3b1 were listed (Figure 4H).
TABLE 1.
Summary of insertions mapped to some critical pathways
| Insulin pathway | PI3K‐Akt pathway | Hippo pathway | MAPK pathway | EGFR inhibitor resistance | Jak‐STAT pathway | Pluripotency | Wnt signaling pathway |
|---|---|---|---|---|---|---|---|
| Prkci | Sis | Prkci | Sis | Sis | Sis | Isl1 | Chd8 |
| Ppp1cb | Pkn2 | Smad7 | Traf2 | Rps6kb1 | Aox2 | Pax6 | |
| Ppp1r3a | Sgk3 | Ppp1cb | Rps6ka3 | Nras | Il27ra | Nras | |
| Mknk2 | Sgk1 | Dlg4 | Mknk2 | Stat2 | Mapk13 | ||
| Rps6kb1 | Chad | Bmp8b | Nras | Csf2rb2 | |||
| Prkag3 | Syk | Ywhaq | Gng12 | ||||
| Nras | Rps6kb1 | Pard6a | Map3k12 | ||||
| G6pc3 | Ywhaq | Ctgf | Ecsit | ||||
| Phka2 | Nras | Actb | Mapk13 | ||||
| Sorbs1 | Gng12 | Bmp8a | Flna | ||||
| Gys2 | Itga3 | Angpt1 | |||||
| Pygm | Gng7 | Pla2g4e | |||||
| Prkab2 | Gys2 | ||||||
| Rhoq | G6pc3 | ||||||
| Reln | |||||||
| Stk3 | |||||||
| Col1a1 | |||||||
| Vwf | |||||||
| Angpt1 |
3.5. Hs3st3b1‐KO promotes reprogramming of EpiSCs to ground state
Hs3st3b1 gene encodes an enzyme named heparan sulfate glucosamine 3‐O‐sulfotransferase 3B1 (Hs3st3b1), which is a key component in generating heparan sulfate fine structures that involved in diverse biologic activities. 46 As Hs3st3b1 was the top 1 inserted gene along with the screening (Figure 4H; Figure S5A, B), we designed specific sgRNAs (Figure S5C) to introduce Hs3st3b1 mutations in WT‐diploid EpiSCs. Around 48 hours post transfection, EpiSCs for Cas9‐GFP positive cells (9.9%, Figure S5D) were sorted for further culturing. We randomly picked eight subclones and identified KO‐3#, KO‐5# and KO‐7# were Hs3st3b1‐KO subclones (Figure 5A). The three Hs3st3b1‐KO subclones did not show obvious morphological change in EpiSCs medium (Figure S5E). However, they had higher expression of Rex1 (naïve gene) and lower expression of Cldn6 (primed gene) than those in WT‐diploid EpiSCs (Figure 5B). Thereafter, we compared percentages of SSEA‐1+ cells in Hs3st3b1‐KO EpiSCs and WT‐diploid EpiSCs with specific antibody by FACS. The results demonstrated that the percentages of SSEA‐1+ cells in Hs3st3b1‐KO EpiSCs were significantly higher than those in WT‐diploid EpiSCs (Figure 5C). These SSEA‐1+ EpiSCs were harvested and cultured in N2B27/2iL medium for reprogramming. After a reprogramming period of 20 days, AP positive experiment was performed to identify the well‐reprogrammed rESCs (Figure 5D). Interestingly, Hs3st3b1‐KO EpiSCs could be converted to rESCs with standard naïve colonies (Figure 5E) and showed AP positive (Figure 5F; Figure S5F), whereas WT‐diploid EpiSCs could hardly realize this phenotype. Thereafter, qPCR results demonstrated that Hs3st3b1‐KO rESCs expressed naïve marker genes, compared to WT‐diploid ESCs and WT‐diploid EpiSCs (Figure 5G). Overall, Hs3st3b1‐KO facilitated reprogramming of EpiSCs to ground state rESCs, which proved that Hs3st3b1 was a key modulator for reprogramming process.
FIGURE 5.
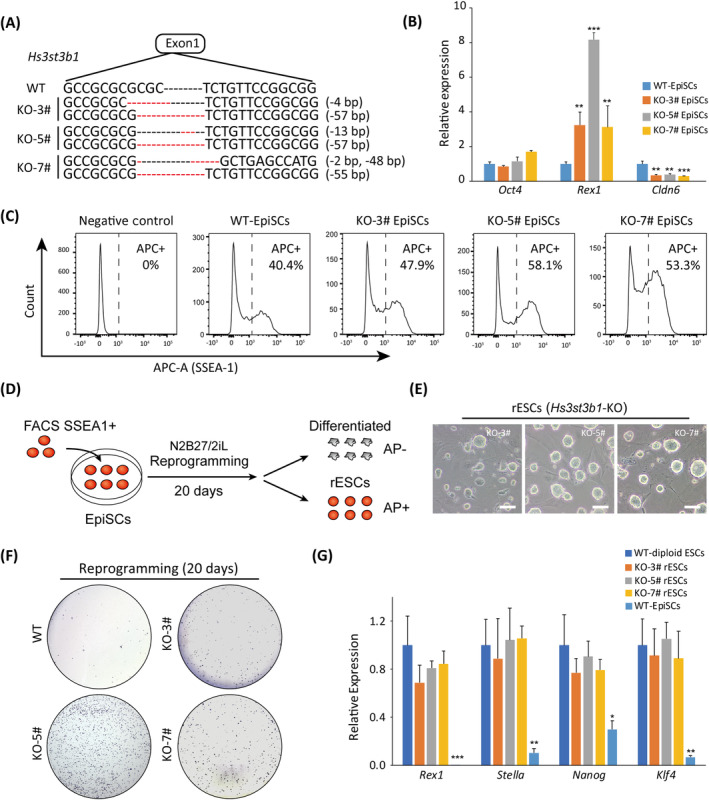
Validation of Hs3st3b1‐knockout (KO) for reprogramming assays. A, Hs3st3b1‐deleted genotypes in subclones of KO‐3#, KO‐5#, and KO‐7#. B, Expression levels of pluripotent (Oct4 and Rex1) and EpiSC marker gene (Cldn6) in Hs3st3b1‐KO EpiSCs. t test, **P < .01, ***P < .001. Data were represented as the mean ± SEM. C, FACS analysis of SSEA‐1 positive cells in Hs3st3b1 KO EpiSCs and wild‐type (WT)‐EpiSCs. The percentages of SSEA‐1 positive cells in WT‐EpiSCs and Hs3st3b1 KO EpiSCs (KO‐3#, KO‐5#, and KO‐7#) were 40.4%, 47.9%, 58.1%, and 53.3%, respectively. MEFs were used as a negative control. D, Schematic overview of the reprogramming assay in N2B27/2iL medium. E, Images of rESCs derived from KO‐3#, KO‐5#, and KO‐7# in N2B27/2iL medium. Scale bar = 100 μm. F, Commitment test after knocking out of Hs3st3b1 on the reprogramming day 20. Alkaline phosphatase (AP) staining was utilized to visualize ESC colonies. G, Expression levels of naïve marker genes (Rex1, Nanog, Stella, and Klf4) in the Hs3st3b1‐KO rESCs. t test, *P < .05, **P < .05, ***P < .001. Data were represented as the mean ± SEM
4. DISCUSSION
Our data showed that it was feasible to derive haEpiSCs from mouse implantation embryos at E6.5. Detailed molecular characterization showed that haEpiSCs maintained haploidy and pluripotency in long‐term cell culture, with an intact genome. haEpiSCs presented a primed pluripotent state in many aspects including cell‐cycle dependent pathways and differentiation potentials, compared to naïve haESCs. The addition of IWP‐2 in the culture medium facilitated the derivation and subsequent culturing of haEpiSCs. As previously described, growth and status of human ESCs and induced pluripotent stem cells could be favored when treated with Wnt inhibitor (IWP‐2). 47 Similar phenomenon was observed in mouse WT‐diploid EpiSCs. 21 , 48 Therefore, inhibition of Wnt pathway was helpful for self‐renewal of haEpiSCs, which guaranteed that haEpiSCs could expand to numerous cell‐counts without differentiation. It was necessary for genome‐wide high‐throughput genetic screening.
Although haEpiLCs were generated via differentiation of haESCs in vitro, 8 , 49 they were not authentic EpiSCs originated from postimplantation epiblast. WT‐diploid EpiLCs by differentiation exhibited significant developmental difference from WT‐diploid EpiSCs derived from postimplantation epiblast, especially in germ cell specification. 27 , 50 Besides, already reported haploid cell lines had been proved to be powerful tools to generate massive homozygous phenotypes, taking advantages in various forward genetic screening. 6 , 9 , 11 Herein, it is important to establish haEpiSCs, which not only have a set of chromosomes, but also share major similarities with epiblast. Derivation of haEpiSCs seemed quite difficult before, because of more severe diploidization during differentiation in vivo. Breakthroughs that inhibiting of diploidization via gene editing 24 , 51 or supplementing of inhibitors 8 , 52 made it possible to derive haEpiSCs. In our study, the deletion of p53 was a key strategy to obtain haEpiSCs. As p53 was a critical gene involved in multiple biological processes, 53 whether our p53‐null haEpiSCs had limited developmental potentials that needed further investigation. Nevertheless, our haEpiSCs did not show any CNV mutations according to genomic integrity analysis (Figure 1I), demonstrating that genome of haEpiSCs was intact.
Reprogramming factors were primarily discovered by testing candidate genes that were implicated in the WT‐diploid ESCs. 54 , 55 Our findings focused on key regulators hindering reprogramming through a high‐throughput genetic screening using haEpiSCs. It was a proof‐of‐concept experiment to generate tremendous homozygous mutations with haEpiSCs. In such a design, substantial candidate genes (such as Hs3st3b1) hampering reprogramming were uncovered, which would be very useful resource for reprogramming studies.
5. CONCLUSION
In conclusion, we obtained haEpiSCs from mouse implantation embryos at E6.5, which maintained durable haploidy and pluripotency with an epiblast nature. Genome‐wide genetic screening of haEpiSCs provided a platform to study net‐work of reprogramming or other crucial biological processes. We testified that Hs3st3b1‐KO was of benefit for reprogramming of EpiSCs to rESCs at a naïve state.
CONFLICT OF INTEREST
All of the authors declared no potential conflicts of interest.
AUTHOR CONTRIBUTIONS
Q.G.: conception and design, collection and/or assembly of data; W.H.Z.: collection and/or assembly of data, data analysis and interpretation; Y.D.Z., Y.R.T., Y.N.W., J.X.Z., M.Y.G., M.X., C.M.Y., H.Y.W.: collection and/or assembly of data; L.Y.L., Y.L.: manuscript writing; L.S.: conception and design, financial support, manuscript writing, final approval of manuscript.
ETHICS APPROVAL AND CONSENT TO PARTICIPATE
All experiments were guided by the Institutional Animal Care and Use Committee of Nankai University, and all experiments conformed to the relevant regulatory standards.
Supporting information
FIGURE S1 Derivation of HaEpiSC Lines.
(A) A schematic overview of the establishment of haEpiSCs from mouse post‐implantation epiblast. Newly sorted haploid p53‐KO haESCs were injected into the blastocysts. The reconstructed embryos were transferred to the oviducts of pseudopregnant CD‐1 mice at 0.5 day.p.c, and subsequently developed to E6.5 stage for the establishment of haEpiSCs. Factors and inhibitors including activin A, bFGF and IWP‐2 were added into the medium.
(B) Summary of haEpiSC lines established from mouse post‐implantation embryos. HaEpiSCs 1‐1 and 1‐2 were derived from androgenetic haESCs and the other ones were derived from parthenogenetic haESCs.
(C) Cell‐cycle profiles of WT‐diploid ESCs and WT‐diploid EpiSCs. The percentage of G0/G1, S and G2/M phase in WT‐diploid ESCs (26.0%, 60.3% and 13.7%) and WT‐diploid EpiSCs (26.2%, 45.7% and 28.1%), respectively.
Related to Figure 1.
FIGURE S2 RNA‐Seq Analysis of HaEpiSCs.
(A) Gene expression distribution of haEpiSCs, WT‐diploid EpiSCs, p53 KO‐diploid EpiSCs (diploid EpiSCs derived from p53‐KO epiblast), WT‐EpiLCs (EpiLCs derived from differentiated WT‐ESCs in culture), p53 KO‐haEpiLCs (EpiLCs derived from differentiated p53 KO‐haESCs in culture), WT‐ESCs, haESCs and MEFs. MEFs had a wider expression, whereas haEpiSCs shared the similar expression distribution with WT‐diploid EpiSCs.
(B) Pearson correlation between each other among haEpiSCs, WT‐diploid EpiSCs, p53 KO‐diploid EpiSCs, WT‐EpiLCs, p53 KO‐haEpiLCs, WT‐ESCs, haESCs and MEFs. The results showed that haEpiSCs were close to WT‐diploid EpiSCs and far away from WT‐EpiLCs and p53 KO‐diploid haEpiLCs.
(C) Enrichment network visualization for differential expressed genes between haEpiSCs and haESCs. Each node represents an enriched term. Our results suggested that majority of differential expressed genes related to pluripotency and metabolism.
Related to Figure 2.
FIGURE S3 Pluripotency of HaEpiSCs.
(A) Alkaline phosphatase (AP) staining of haEpiSCs and WT‐diploid EpiSCs. Both of them showed positivity of AP activity.
(B) Images of haEBs derived from haEpiSCs. Scale bar, 100 μm.
(C) Teratoma derived from haEpiSCs in bright field.
(D) Images of the GFP‐labeling haESCs and haEpiSCs in merged form (bright field and FITC channel). Scale bar, 100 μm.
(E) Summary of donor cells contributed into Epiblast via blastocyst microinjection.
Related to Figure 3.
FIGURE S4 High‐throughput Genetic Screening in HaEpiSCs.
(A) Immunofluorescence of OCT4 and NANOG in rESCs. DNA was stained with DAPI. Scale bar, 50 μm.
(B) Expression levels of pluripotent and EpiSC specific genes (Rex1, Nanog and FGF5) in WT‐diploid ESCs, WT‐diploid EpiSCs and rESCs determined by qPCR. The expression levels of these marker genes in the rESCs sub‐lines resembled to that in WT‐diploid ESCs, rather than that in WT‐diploid EpiSCs. Data were represented as the mean ± SEM.
(C) Splinkerette PCR analysis of the insertion sites in the rESCs. The smear bands presented multiple different insertions.
(D) Proportion of the insertional orientation (sense/antisense) after piggyBac integration. 49.3% of the insertions were located to the sense orientation.
(E) Proportion of integration sites across various genomic regions: promoters (1 kb upstream of the transcription starting sites), 5’‐UTR, exons, introns, 3’‐UTR and intergenic regions.
Related to Figure 4.
FIGURE S5 Validation of a Candidate Gene for Reprogramming Assays.
(A) Sense (red) and antisense (blue) insertions in Hs3st3b1. The rectangles indicated the respective exons, and the size of triangle meant insert numbers.
(B) Statistics of reads and independent insertions for both the selected and the control population.
(C) DNA information for KO of Hs3st3b1 in WT‐EpiSCs using the CRISPR/Cas9 system.
(D) Percentage of Cas9‐GFP positive cells in the transfected WT‐EpiSCs 2 days after transfection by FACS indicating. WT‐EpiSCs without transfection were used as a negative control.
(E) Images of KO‐3#, KO‐5# and KO‐7# in EpiSCs medium, which was similar to that of WT‐EpiSCs. Scale bar, 100 μm.
(F) The numbers of AP positive colonies on the reprogramming day 20, which were counted according to Figure 5F.
Related to Figure 5.
Table S1 Primer sequences.
ACKNOWLEDGMENTS
We thank Qian Liu, Daolei Dou, and Xiangshuai Zhao for their help with fluorescence‐activated cell sorting. This work was supported by the National Key Research and Development Program of China (2018YFC1004101 and 2019YFA0109901 to Ling Shuai), the National Natural Science Foundation of China (32022025, 31671538, and 31872841 to Ling Shuai), the Strategic Collaborative Research Program of the Ferring Institute of Reproductive Medicine, Ferring Pharmaceuticals and Chinese Academy of Sciences, Grant No. FIRMD181102, and the Open Fund of Tianjin Central Hospital of Gynecology Obstetrics/Tianjin Key Laboratory of human development and reproductive regulation (2019XHY08 to Ling Shuai).
Gao Q, Zhang W, Zhao Y, et al. High‐throughput screening in postimplantation haploid epiblast stem cells reveals Hs3st3b1 as a modulator for reprogramming. STEM CELLS Transl Med. 2021;10:743–755. 10.1002/sctm.20-0468
Qian Gao, Wenhao Zhang, and Yiding Zhao are co‐first authors.
Funding information Open Fund of Tianjin Central Hospital of Gynecology Obstetrics/Tianjin Key Laboratory of human development and reproductive regulation, Grant/Award Number: 2019XHY08; Strategic Collaborative Research Program of the Ferring Institute of Reproductive Medicine, Ferring Pharmaceuticals and Chinese Academy of Sciences, Grant/Award Number: FIRMD181102; National Natural Science Foundation of China, Grant/Award Numbers: 31872841, 31671538, 32022025; National Key Research and Development Program of China, Grant/Award Numbers: 2019YFA0109901, 2018YFC1004101
Contributor Information
Luyuan Li, Email: liluyuan@nankai.edu.cn.
Yan Liu, Email: 30819007@nankai.edu.cn.
Ling Shuai, Email: lshuai@nankai.edu.cn.
DATA AVAILABILITY STATEMENT
The data that support the findings of this study are available from the corresponding author upon reasonable request. The raw sequence data reported in this paper were deposited and the Gene Expression Omnibus accession number for the RNA‐seq data reported in this paper is GEO: GSE 164250.
REFERENCES
- 1. Cui T, Li Z, Zhou Q, et al. Current advances in haploid stem cells. Protein Cell. 2019;11:23‐33. [DOI] [PMC free article] [PubMed] [Google Scholar]
- 2. Li Y, Shuai L. A versatile genetic tool: haploid cells. Stem Cell Res Ther. 2017;8:197. [DOI] [PMC free article] [PubMed] [Google Scholar]
- 3. Wutz A. Haploid animal cells. Development. 2014;141:1423‐1426. [DOI] [PubMed] [Google Scholar]
- 4. Leeb M, Dietmann S, Paramor M, Niwa H, Smith A. Genetic exploration of the exit from self‐renewal using haploid embryonic stem cells. Cell Stem Cell. 2014;14:385‐393. [DOI] [PMC free article] [PubMed] [Google Scholar]
- 5. Monfort A, Di Minin G, Postlmayr A, et al. Identification of Spen as a crucial factor for Xist function through forward genetic screening in haploid embryonic stem cells. Cell Rep. 2015;12:554‐561. [DOI] [PMC free article] [PubMed] [Google Scholar]
- 6. Elling U, Taubenschmid J, Wirnsberger G, et al. Forward and reverse genetics through derivation of haploid mouse embryonic stem cells. Cell Stem Cell. 2011;9:563‐574. [DOI] [PMC free article] [PubMed] [Google Scholar]
- 7. Sagi I, Chia G, Golan‐Lev T, et al. Derivation and differentiation of haploid human embryonic stem cells. Nature. 2016;532:107‐111. [DOI] [PubMed] [Google Scholar]
- 8. He ZQ, Xia BL, Wang YK, et al. Generation of mouse haploid somatic cells by small molecules for genome‐wide genetic screening. Cell Rep. 2017;20:2227‐2237. [DOI] [PubMed] [Google Scholar]
- 9. Wang H, Zhang W, Yu J, et al. Genetic screening and multipotency in rhesus monkey haploid neural progenitor cells. Development. 2018;145:dev160531. [DOI] [PubMed] [Google Scholar]
- 10. Cui T, Jiang L, Li T, et al. Derivation of mouse haploid trophoblast stem cells. Cell Rep. 2019;26:407‐414. [DOI] [PubMed] [Google Scholar]
- 11. Peng K, Li X, Wu C, et al. Derivation of haploid trophoblast stem cells via conversion in vitro. iScience. 2019;11:508‐518. [DOI] [PMC free article] [PubMed] [Google Scholar]
- 12. Brons IG, Smithers LE, Trotter MW, et al. Derivation of pluripotent epiblast stem cells from mammalian embryos. Nature. 2007;448:191‐195. [DOI] [PubMed] [Google Scholar]
- 13. Tesar PJ, Chenoweth JG, Brook FA, et al. New cell lines from mouse epiblast share defining features with human embryonic stem cells. Nature. 2007;448:196‐199. [DOI] [PubMed] [Google Scholar]
- 14. Nichols J, Smith A. Naive and primed pluripotent states. Cell Stem Cell. 2009;4:487‐492. [DOI] [PubMed] [Google Scholar]
- 15. Guo G, Yang J, Nichols J, et al. Klf4 reverts developmentally programmed restriction of ground state pluripotency. Development. 2009;136:1063‐1069. [DOI] [PMC free article] [PubMed] [Google Scholar]
- 16. Bao S, Tang F, Li X, et al. Epigenetic reversion of post‐implantation epiblast to pluripotent embryonic stem cells. Nature. 2009;461:1292‐1295. [DOI] [PMC free article] [PubMed] [Google Scholar]
- 17. Gillich A, Bao S, Grabole N, et al. Epiblast stem cell‐based system reveals reprogramming synergy of germline factors. Cell Stem Cell. 2012;10:425‐439. [DOI] [PMC free article] [PubMed] [Google Scholar]
- 18. Gafni O, Weinberger L, Mansour AA, et al. Derivation of novel human ground state naive pluripotent stem cells. Nature. 2013;504:282‐286. [DOI] [PubMed] [Google Scholar]
- 19. Takashima Y, Guo G, Loos R, et al. Resetting transcription factor control circuitry toward ground‐state pluripotency in human. Cell. 2014;158:1254‐1269. [DOI] [PMC free article] [PubMed] [Google Scholar]
- 20. Theunissen TW, Friedli M, He Y, et al. Molecular criteria for defining the naive human pluripotent state. Cell Stem Cell. 2016;19:502‐515. [DOI] [PMC free article] [PubMed] [Google Scholar]
- 21. Sugimoto M, Kondo M, Koga Y, et al. A simple and robust method for establishing homogeneous mouse epiblast stem cell lines by wnt inhibition. Stem Cell Rep. 2015;4:744‐757. [DOI] [PMC free article] [PubMed] [Google Scholar]
- 22. Li W, Shuai L, Wan H, et al. Androgenetic haploid embryonic stem cells produce live transgenic mice. Nature. 2012;490:407‐411. [DOI] [PubMed] [Google Scholar]
- 23. Leeb M, Walker R, Mansfield B, Nichols J, Smith A, Wutz A. Germline potential of parthenogenetic haploid mouse embryonic stem cells. Development. 2012;139:3301‐3305. [DOI] [PMC free article] [PubMed] [Google Scholar]
- 24. Olbrich T, Mayor‐Ruiz C, Vega‐Sendino M, et al. A p53‐dependent response limits the viability of mammalian haploid cells. Proc Natl Acad Sci USA. 2017;114:9367‐9372. [DOI] [PMC free article] [PubMed] [Google Scholar]
- 25. Zhang W, Tian Y, Gao Q, et al. Inhibition of apoptosis reduces diploidization of haploid mouse embryonic stem cells during differentiation. Stem Cell Rep. 2020;15:185‐197. [DOI] [PMC free article] [PubMed] [Google Scholar]
- 26. Shuai L, Li W, Wan H, et al. Generation of Mammalian offspring by haploid embryonic stem cells microinjection. Curr Protoc Stem Cell Biol. 2014;31:1A.6.1‐1A.6.15. [DOI] [PubMed] [Google Scholar]
- 27. Hayashi K, Ohta H, Kurimoto K, Aramaki S, Saitou M. Reconstitution of the mouse germ cell specification pathway in culture by pluripotent stem cells. Cell. 2011;146:519‐532. [DOI] [PubMed] [Google Scholar]
- 28. Gao Q, Zhang W, Ma L, et al. Derivation of haploid neural stem cell lines by selection for a Pax6‐GFP reporter. Stem Cells Dev. 2018;27:479‐487. [DOI] [PubMed] [Google Scholar]
- 29. Bolger AM, Lohse M, Usadel B. Trimmomatic: a flexible trimmer for Illumina sequence data. Bioinformatics. 2014;30:2114‐2120. [DOI] [PMC free article] [PubMed] [Google Scholar]
- 30. Love MI, Huber W, Anders S. Moderated estimation of fold change and dispersion for RNA‐seq data with DESeq2. Genome Biol. 2014;15:550. [DOI] [PMC free article] [PubMed] [Google Scholar]
- 31. Zhou Y, Zhou B, Pache L, et al. Metascape provides a biologist‐oriented resource for the analysis of systems‐level datasets. Nat Commun. 2019;10:1523. [DOI] [PMC free article] [PubMed] [Google Scholar]
- 32. Chen S, Zhou Y, Chen Y, Gu J. fastp: an ultra‐fast all‐in‐one FASTQ preprocessor. Bioinformatics. 2018;34:i884‐i890. [DOI] [PMC free article] [PubMed] [Google Scholar]
- 33. Di Minin G, Postlmayr A, Wutz A. HaSAPPy: a tool for candidate identification in pooled forward genetic screens of haploid mammalian cells. PLoS Comput Biol. 2018;14:e1005950. [DOI] [PMC free article] [PubMed] [Google Scholar]
- 34. Zimin AV, Cornish AS, Maudhoo MD, et al. A new rhesus macaque assembly and annotation for next‐generation sequencing analyses. Biol Direct. 2014;9:20. [DOI] [PMC free article] [PubMed] [Google Scholar]
- 35. Harrow J, Denoeud F, Frankish A, et al. GENCODE: producing a reference annotation for ENCODE. Genome Biol. 2006;7 Suppl 1:S4.1‐S4.9. [DOI] [PMC free article] [PubMed] [Google Scholar]
- 36. Quinlan AR, Hall IM. BEDTools: a flexible suite of utilities for comparing genomic features. Bioinformatics. 2010;26:841‐842. [DOI] [PMC free article] [PubMed] [Google Scholar]
- 37. Yin T, Cook D, Lawrence M. ggbio: an R package for extending the grammar of graphics for genomic data. Genome Biol. 2012;13:R77. [DOI] [PMC free article] [PubMed] [Google Scholar]
- 38. Ashburner M, Ball CA, Blake JA, et al. Gene ontology: tool for the unification of biology. The Gene Ontology Consortium. Nat Genet. 2000;25:25‐29. [DOI] [PMC free article] [PubMed] [Google Scholar]
- 39. Kanehisa M, Goto S. KEGG: kyoto encyclopedia of genes and genomes. Nucleic Acids Res. 2000;28:27‐30. [DOI] [PMC free article] [PubMed] [Google Scholar]
- 40. Klipper‐Aurbach Y, Wasserman M, Braunspiegel‐Weintrob N, et al. Mathematical formulae for the prediction of the residual beta cell function during the first two years of disease in children and adolescents with insulin‐dependent diabetes mellitus. Med Hypotheses. 1995;45:486‐490. [DOI] [PubMed] [Google Scholar]
- 41. Liu L, Trimarchi JR, Keefe DL. Haploidy but not parthenogenetic activation leads to increased incidence of apoptosis in mouse embryos. Biol Reprod. 2002;66:204‐210. [DOI] [PubMed] [Google Scholar]
- 42. Betschinger J, Nichols J, Dietmann S, Corrin PD, Paddison PJ, Smith A. Exit from pluripotency is gated by intracellular redistribution of the bHLH transcription factor Tfe3. Cell. 2013;153:335‐347. [DOI] [PMC free article] [PubMed] [Google Scholar]
- 43. Hayashi K, Surani MA. Self‐renewing epiblast stem cells exhibit continual delineation of germ cells with epigenetic reprogramming in vitro. Development. 2009;136:3549‐3556. [DOI] [PMC free article] [PubMed] [Google Scholar]
- 44. Ying QL, Stavridis M, Griffiths D, Li M, Smith A. Conversion of embryonic stem cells into neuroectodermal precursors in adherent monoculture. Nat Biotechnol. 2003;21:183‐186. [DOI] [PubMed] [Google Scholar]
- 45. Guo G, Smith A. A genome‐wide screen in EpiSCs identifies Nr5a nuclear receptors as potent inducers of ground state pluripotency. Development. 2010;137:3185‐3192. [DOI] [PMC free article] [PubMed] [Google Scholar]
- 46. Shukla D, Liu J, Blaiklock P, et al. A novel role for 3‐O‐sulfated heparan sulfate in herpes simplex virus 1 entry. Cell. 1999;99:13‐22. [DOI] [PubMed] [Google Scholar]
- 47. Blauwkamp TA, Nigam S, Ardehali R, Weissman IL, Nusse R. Endogenous Wnt signalling in human embryonic stem cells generates an equilibrium of distinct lineage‐specified progenitors. Nat Commun. 2012;3:1070. [DOI] [PMC free article] [PubMed] [Google Scholar]
- 48. Sumi T, Oki S, Kitajima K, Meno C. Epiblast ground state is controlled by canonical Wnt/beta‐catenin signaling in the postimplantation mouse embryo and epiblast stem cells. PLoS One. 2013;8:e63378. [DOI] [PMC free article] [PubMed] [Google Scholar]
- 49. Shuai L, Wang Y, Dong M, et al. Durable pluripotency and haploidy in epiblast stem cells derived from haploid embryonic stem cells in vitro. J Mol Cell Biol. 2015;7:326‐337. [DOI] [PubMed] [Google Scholar]
- 50. Hayashi K, Ogushi S, Kurimoto K, Shimamoto S, Ohta H, Saitou M. Offspring from oocytes derived from in vitro primordial germ cell‐like cells in mice. Science. 2012;338:971‐975. [DOI] [PubMed] [Google Scholar]
- 51. He W, Zhang X, Zhang Y, et al. Reduced self‐Diploidization and improved survival of semi‐cloned mice produced from androgenetic haploid embryonic stem cells through overexpression of Dnmt3b. Stem Cell Rep. 2018;10:477‐493. [DOI] [PMC free article] [PubMed] [Google Scholar]
- 52. Takahashi S, Lee J, Kohda T, et al. Induction of the G2/M transition stabilizes haploid embryonic stem cells. Development. 2014;141:3842‐3847. [DOI] [PubMed] [Google Scholar]
- 53. Hafner A, Bulyk ML, Jambhekar A, Lahav G. The multiple mechanisms that regulate p53 activity and cell fate. Nat Rev Mol Cell Biol. 2019;20:199‐210. [DOI] [PubMed] [Google Scholar]
- 54. Feng B, Jiang J, Kraus P, et al. Reprogramming of fibroblasts into induced pluripotent stem cells with orphan nuclear receptor Esrrb. Nat Cell Biol. 2009;11:197‐203. [DOI] [PubMed] [Google Scholar]
- 55. Silva J, Nichols J, Theunissen TW, et al. Nanog is the gateway to the pluripotent ground state. Cell. 2009;138:722‐737. [DOI] [PMC free article] [PubMed] [Google Scholar]
Associated Data
This section collects any data citations, data availability statements, or supplementary materials included in this article.
Supplementary Materials
FIGURE S1 Derivation of HaEpiSC Lines.
(A) A schematic overview of the establishment of haEpiSCs from mouse post‐implantation epiblast. Newly sorted haploid p53‐KO haESCs were injected into the blastocysts. The reconstructed embryos were transferred to the oviducts of pseudopregnant CD‐1 mice at 0.5 day.p.c, and subsequently developed to E6.5 stage for the establishment of haEpiSCs. Factors and inhibitors including activin A, bFGF and IWP‐2 were added into the medium.
(B) Summary of haEpiSC lines established from mouse post‐implantation embryos. HaEpiSCs 1‐1 and 1‐2 were derived from androgenetic haESCs and the other ones were derived from parthenogenetic haESCs.
(C) Cell‐cycle profiles of WT‐diploid ESCs and WT‐diploid EpiSCs. The percentage of G0/G1, S and G2/M phase in WT‐diploid ESCs (26.0%, 60.3% and 13.7%) and WT‐diploid EpiSCs (26.2%, 45.7% and 28.1%), respectively.
Related to Figure 1.
FIGURE S2 RNA‐Seq Analysis of HaEpiSCs.
(A) Gene expression distribution of haEpiSCs, WT‐diploid EpiSCs, p53 KO‐diploid EpiSCs (diploid EpiSCs derived from p53‐KO epiblast), WT‐EpiLCs (EpiLCs derived from differentiated WT‐ESCs in culture), p53 KO‐haEpiLCs (EpiLCs derived from differentiated p53 KO‐haESCs in culture), WT‐ESCs, haESCs and MEFs. MEFs had a wider expression, whereas haEpiSCs shared the similar expression distribution with WT‐diploid EpiSCs.
(B) Pearson correlation between each other among haEpiSCs, WT‐diploid EpiSCs, p53 KO‐diploid EpiSCs, WT‐EpiLCs, p53 KO‐haEpiLCs, WT‐ESCs, haESCs and MEFs. The results showed that haEpiSCs were close to WT‐diploid EpiSCs and far away from WT‐EpiLCs and p53 KO‐diploid haEpiLCs.
(C) Enrichment network visualization for differential expressed genes between haEpiSCs and haESCs. Each node represents an enriched term. Our results suggested that majority of differential expressed genes related to pluripotency and metabolism.
Related to Figure 2.
FIGURE S3 Pluripotency of HaEpiSCs.
(A) Alkaline phosphatase (AP) staining of haEpiSCs and WT‐diploid EpiSCs. Both of them showed positivity of AP activity.
(B) Images of haEBs derived from haEpiSCs. Scale bar, 100 μm.
(C) Teratoma derived from haEpiSCs in bright field.
(D) Images of the GFP‐labeling haESCs and haEpiSCs in merged form (bright field and FITC channel). Scale bar, 100 μm.
(E) Summary of donor cells contributed into Epiblast via blastocyst microinjection.
Related to Figure 3.
FIGURE S4 High‐throughput Genetic Screening in HaEpiSCs.
(A) Immunofluorescence of OCT4 and NANOG in rESCs. DNA was stained with DAPI. Scale bar, 50 μm.
(B) Expression levels of pluripotent and EpiSC specific genes (Rex1, Nanog and FGF5) in WT‐diploid ESCs, WT‐diploid EpiSCs and rESCs determined by qPCR. The expression levels of these marker genes in the rESCs sub‐lines resembled to that in WT‐diploid ESCs, rather than that in WT‐diploid EpiSCs. Data were represented as the mean ± SEM.
(C) Splinkerette PCR analysis of the insertion sites in the rESCs. The smear bands presented multiple different insertions.
(D) Proportion of the insertional orientation (sense/antisense) after piggyBac integration. 49.3% of the insertions were located to the sense orientation.
(E) Proportion of integration sites across various genomic regions: promoters (1 kb upstream of the transcription starting sites), 5’‐UTR, exons, introns, 3’‐UTR and intergenic regions.
Related to Figure 4.
FIGURE S5 Validation of a Candidate Gene for Reprogramming Assays.
(A) Sense (red) and antisense (blue) insertions in Hs3st3b1. The rectangles indicated the respective exons, and the size of triangle meant insert numbers.
(B) Statistics of reads and independent insertions for both the selected and the control population.
(C) DNA information for KO of Hs3st3b1 in WT‐EpiSCs using the CRISPR/Cas9 system.
(D) Percentage of Cas9‐GFP positive cells in the transfected WT‐EpiSCs 2 days after transfection by FACS indicating. WT‐EpiSCs without transfection were used as a negative control.
(E) Images of KO‐3#, KO‐5# and KO‐7# in EpiSCs medium, which was similar to that of WT‐EpiSCs. Scale bar, 100 μm.
(F) The numbers of AP positive colonies on the reprogramming day 20, which were counted according to Figure 5F.
Related to Figure 5.
Table S1 Primer sequences.
Data Availability Statement
The data that support the findings of this study are available from the corresponding author upon reasonable request. The raw sequence data reported in this paper were deposited and the Gene Expression Omnibus accession number for the RNA‐seq data reported in this paper is GEO: GSE 164250.