Abstract
While diffusion MRI (dMRI) is currently the most widely used in vivo imaging tool for studying brain connectivity, the biological validity of the tractography techniques based on dMRI is often debated. The wide presence of topographic regularity in various brain circuits provides a unique opportunity to examine and improve the reliability of tractography results. In this work, we develop a novel framework for the analysis of the topographic regularity of brain connectivity generated by modern FOD-based tractography techniques. Our method is based on the consistency between the mathematical property of smooth vector field flows and topographically regular fiber tracts. The main idea of our method is that we compute a principal vector field (PVF) for a given tractogram from the FODs by solving a Markov Random Field problem. By quantifying the consistency between each tract and the PVF, we develop a Vector Flow Deviation (VFD) measure and apply it to filter out topographically irregular tracts. In our experiments, we successfully applied our method to remove irregular fiber tracts in two fiber bundles with known connectopy: the visual pathway and the colossal motor pathway, which were reconstructed from the multi-shell diffusion imaging data of the Human Connectome Project (HCP). We also performed quantitative evaluation based on a G2SD distance proposed in previous work to quantitatively demonstrate the effectiveness of our filtering method.
1. Introduction
Diffusion MRI (dMRI) is currently the most widely used in vivo imaging tool for studying human brain connectivity. While there has been tremendous progress in improving both the spatial and angular resolution of dMRI, especially the multiband and multishell imaging popularized by the Human Connectome Project (HCP) [1], there is still much debate about how to relate these complicated connectome imaging data to the underlying brain circuits [2], especially the validity of the commonly used tractography techniques [3]. For several major neurocircuitries, a striking property is their fiber pathways follow a topography-preserving relation when they travel between anatomical regions [4,5]. The wide presence of such topography-preserving connectivity, i.e., connectopy [5]. provides a great opportunity to examine and improve the biological validity of tractography techniques [6,7]. Using the fiber orientation distributions (FODs) reconstructed from connectome imaging data, we develop here a novel method to construct a vector field flow representation of topographically regular fiber pathways. We then apply this novel representation to develop a tractogram filtering method to improve the topographic regularity of fiber bundles with known connectopy.
The wide presence of connectopy in various brain regions were first identified in post-mortem studies such as the retinotopy of the visual pathways [8,9]. The in vivo characterization of anatomical topography in the early visual system was first achieved with the popularization of electrophysiological studies [10]. With task-based functional MRI (tfMRI), the topographically ordered mapping between anatomy and function in various brain regions have been revealed in vivo including the retinotopic organization of axons in the visual system [11], somatotopic organization of the motor and sensory pathways [12], the tonotopic organization of the auditory pathways [13], and the anatomy of cortico-striatal pathways [14]. In contrast to the rich literature on functional connectopy, very limited in vivo research has been conducted on the structural connectopy of tractography techniques. Recently a novel FOD-based tractography method was developed [6] by incorporating topographic regularity and achieved improved regularity for the reconstruction of visual pathways and corticospinal tracts. In addition, A quantitative measure called group graph spectral distance (G2 SD) was proposed [7] to evaluate the topographical regularity of fiber tracts from any tractography techniques and then applied for the filtering of irregular tracts.
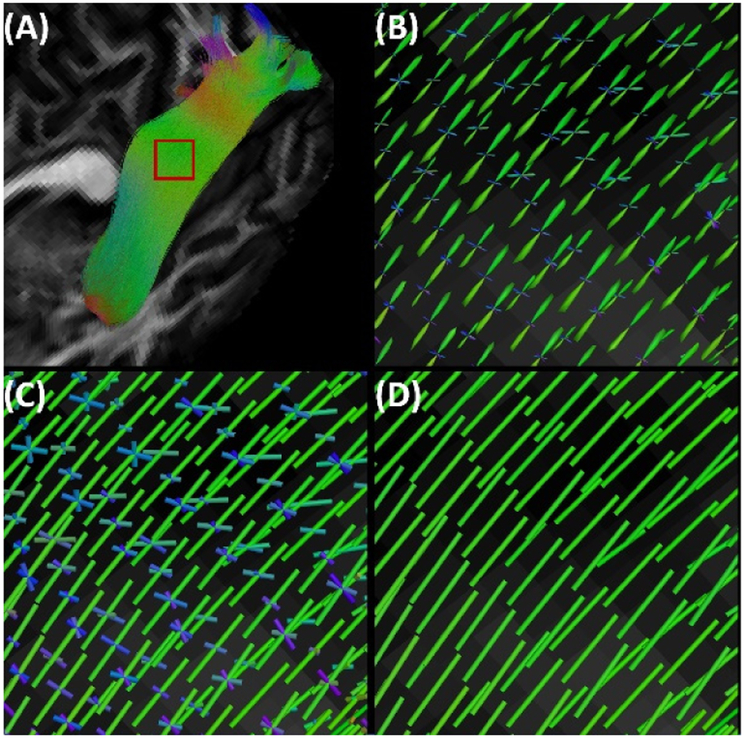
Instead of modeling the regularity among fiber tracts, which can be affected by tractography techniques and various parameters, the novel method we develop in this work directly considers how the connectopy of the anatomical pathways are represented in the dMRI data. Using the FODs (Figure 1(A)) reconstructed from the connectome imaging data, our main idea is to extract an underlying vector field that supports the topographically regular fiber bundle (Figure 1(A)). This work is achieved by formulating and solving a Markov Random Field (MRF) problem[15] from the peak fields of the FODs (Figure 1(C)). After that, we develop a quantitative measure to evaluate how well the fiber tracts fit as the flows of the vector field (Figure 1(D)). Using HCP data, we demonstrate our method in filtering the tractograms of two fiber bundles with known connectopy: the visual pathway [11] and the callosal motor pathways[16]. We also quantify the effectiveness of our method with the independent G2SD measure from a previous work on topographic tract filtering [7].
Figure 1.
A vector field flow representation for the visual pathway bundle. (A) Fiber bundle from FOD-based tractography. The red box is the ROI used for visualization in (B)-(D). (B) The FODs in the ROI. (C) The multiple peaks of the FODs. (D) The vector field extracted from the FOD peaks. Note that we use the QIT software ( http://cabeen.io/qitwiki) for visualization of all FOD peaks and vector fields as sticks in this work.
2. Method
2.1. Vector Field Flows for Topographically Regular Tracts
In neuroscience, topographic regularity is commonly understood as the preservation of spatial relationships of axonal fibers as they traverse the space and connect distant brain regions [4]. Following this idea, the tracts of a topographically regular fiber bundle should not intersect, and the points on the tracts need to preserve their relative topological relation along the bundle. This characteristic is consistent with the flows induced by a smooth vector field. More specifically, for a continuously differentiable vector field v(x) in R3, its flows are integral curves defined as the solution of the following ordinary differential equation (ODE):
| (1) |
where Ω is a bounded open set in R3.
From the theory of the ODE and differential manifolds [17], the flows of a vector field intersect (asymptotically) only at the stationary points (v(x) =0). Moreover, the local flows are diffeomorphisms which preserve the topological structure (details can be found in [17]). For example, the local flows map a connected open set to another connected open set, and the map is one to one. This property means the flows automatically satisfy the neuroscientific understanding of topographic regularity. Interestingly, this definition was naturally adopted in the original tractography algorithm by Basser et al. [18], where the streamlines were defined as the flows of the field of principal eigenvectors from the tensor model. The challenge, however, is that field of eigenvectors from the tensor model are not smooth vector fields accurately depicting the underlying white matter anatomy. The flows from the eigenvector fields are thus not appropriate for studying fiber pathways passing through regions with crossings. Modern tractography techniques use advanced models such as the fiber orientation distribution (FOD) to better resolve crossing fibers [19,20]. With the ability of more faithfully representing multiple fiber directions, the FOD representation provides the opportunity to truly analyze fiber tracts as flows of vector fields and study their topographic regularity. Given any fiber bundle from FOD-based tractography, the main technical hurdle is thus to extract the associated vector field from the FOD fields. Once this vector field is computed, we can quantify the degree of the tracts as vector field flows.
2.2. Vector Field Computation from FODs
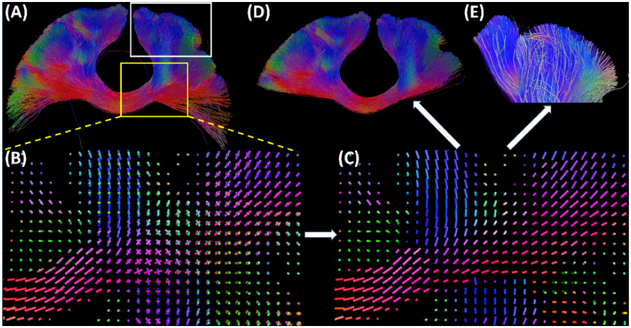
For the FOD represented as spherical harmonics at each voxel, we extract its peaks as local maxima on a spherical mesh and denote them as a set of normalized vectors v1, v2, …, which is called a multi-valued directional (MVD) in graphics literature[21]. Because the FOD is symmetric with respect to the origin of the sphere, we only take one direction from each pair of symmetric peaks. For each direction, we associate a magnitude. For example, they can be the FOD values in corresponding directions. The collection of the directionals over the image volume is called an MVD field (Figure 2(B)). Typically, the number of peaks in FODs are chosen to be less than 4 that matches the sparsity assumption in FOD reconstruction algorithms [20].
Figure 2.
Main steps in our topographic tract filtering algorithm. (A) Input tracts of the callosal motor (CM) pathway from FOD-based tractography. (B) The field of MVD from FOD peaks for the ROI highlighted by the yellow box in (A). (C) The PVF for the CM pathways computed by solving the MRF model. (D) The preserved fiber tracts after removing 30% of tracts with high VFD value. (E) For the ROI highlighted by the white box in (A), the 10% of tracts with the highest VFD values are plotted as white tubes together with the original input tracts. This help visualize the irregularity of the filtered tracts by our algorithm.
Given a tractogram of a fiber bundle, we will compute a principal vector field (PVF) to perform vector field flow analysis. To extract the PVF directly from an MVD field, we formulate and solve a Markov Random Field (MRF) problem. Specially, once the MVD field is computed, we only need to assign an index to the set of vectors (directionals) at each voxel to define a vector field over the brain volume. For a voxel p, we denote lp as the index into the directional at this voxel. The vector field decomposition then is essentially an integer programming problem. To extract a smooth vector field, we will introduce regularization between neighboring voxels by measuring the angular differences of vectors. Overall, we maximize the log likelihood of the posterior distribution of MRF [22] as defined in equation (2):
| (2) |
where Ω is the image domain under consideration, N denotes the neighborhood of voxels, lp is the index of the directional at the p-th voxel. There are two factor terms: the unary factor θp and the pairwise factor θpq.
At each voxel, the decomposed vector should be close to the tangent vector of a tract passing through this voxel. If there is more than one tract passing through this voxel, we use the average tangent vectors. Moreover, the vector field should follow a relatively high probability of direction (strong diffusion) whenever possible. The unary factor θp is thus defined as follows:
| (3) |
where F is the associated FOD magnitude of the directional vlp and up is the normalized average tangent vector of the tracts that passing voxel p. For a voxel p where there is no tract passing, up is set to be 0. When the directional vector is aligned to the tangent vector, the absolute value of the inner product is large, and a higher probability directional contributes more to the unary factor. The regularization parameter λ2 is set to be in proportion to the density of fiber tracts in the voxel, i.e., λ2 (p)= k*d(p), where d(p) is the number of tracts passing through voxel p and k is a positive number.
For smoothness regularization, the pairwise factor θpq is defined as follows:
| (4) |
The pairwise factor measures the similarity of the directional vectors of each pair in the neighborhood system N. In our implementation, we use the 6-connected neighborhood system.
Numerically, we use the max-sum Belief Propagation (BP) algorithm [15] to solve the MRF problem for efficient computation, which generates a smooth PVF that supports the tractogram under consideration.
2.3. Measure for Topographic Regularity
The smooth principle vector field (PVF) generated in section 2.2 is consistent with the trend of the fiber bundle. To remove irregular fiber tract that do not follow the PVF, we define a measure called Vector Flow Deviation (VFD) in (5) to quantify the consistency between a tract T(t) and the PVF as:
| (5) |
where the integral is defined over the tract T, ut is the normalized tangent vector of T at point T(t), vT(t) is the normalized PVF at point T(t), and L(T) is the length of the tract. The VFD measure computes the mean square error between the tangent vector of the tract and the vector field. Based on the uniqueness theorem from ODE, VFD(T) = 0 (tangent vector of T is perfectly aligned along the vector field pointwise) if and only if T is an integral curve of the vector field.
Given a set of precomputed input tracts and the corresponding FOD data, we can develop a topographic tract filtering method based on the VFD measure. As summarized in Figure 2, we first compute the MVD (Figure 2 (B)) from the FODs and then obtain the PVF (Figure 2 (C)) by solving the MRF optimization problem. Finally, we compute the VFD to measure the topographic regularity of each tract and generate the tracts to be preserved (Figure 2(D)) and removed (Figure 2 (E)). Our algorithm is independent of the tractography algorithm used to generate the fiber tracts. For different fiber bundles, we only need to adjust the threshold value for the VFD measure. Solving the MRF contributes most to the computational cost of our algorithm. The whole algorithm usually takes 5-8 minutes for 10000 tracts on a 2.8G HZ 2-core Laptop.
3. Experimental Results
In this section, we present experimental results to demonstrate our topographic tract filtering algorithm based on vector field flows. The preprocessed MRI data of 30 subjects released from the HCP were used in our experiments. From the multi-shell diffusion MRI data, FODs were first computed using the method in [20] before the vector field analysis. We applied our method to filter two fiber bundles: optic radiation of the visual pathway and the colossal motor (CM) pathway which are known to have topographic regularity. The inputs to our method are tractograms of around 10K tracts reconstructed by FOD-based tractography in MRtrix [23] and related anatomical ROIs. For the optic radiation, the lateral geniculate nucleus (LGN) region detected based on the method in [24] was used as the seed ROI and the V1 cortex region from FreeSurfer was used as the inclusion ROI. For the CM pathways, the corpus callosum ROI from FreeSurfer segmentation was used as the seed ROI, and the precentral gyrus from both hemispheres was used as the inclusion ROIs. For our method, the parameters used in the MRF model for vector field extraction are set as λ1 = 1, λ3 = 10, and k = 0.1 for all experiments. The Belief Propagation (BP) algorithm typically converges within 4-6 iterations. The filtering threshold for the CM pathway is set to remove 30% of the tracts, and the visual pathway to remove 40% of the tracts for all subjects.
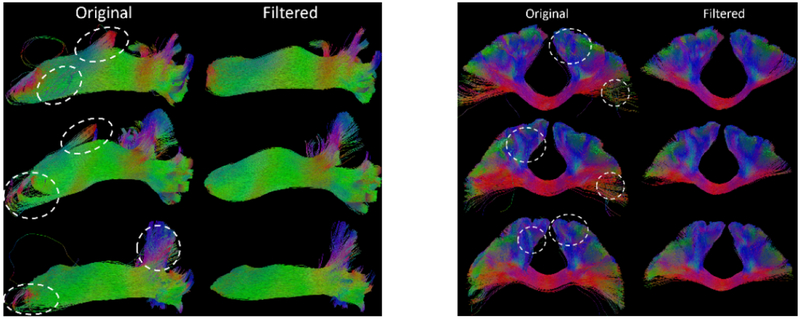
Three representative examples for the filtering of the visual and CM pathway are shown in Figure 3. We can see clearly that our method can remove the outlier tracts and generate much cleaner fiber bundles based on the parameters discussed above. For visual inspection, some regions have been highlighted with the dashed white ellipsoids on the original input bundles.
Figure 3.
Representative tract filtering results from 3 HCP subjects for the visual (left) and CM (left) pathway. For each case, regions with outlier tracts were highlighted on the input tracts.
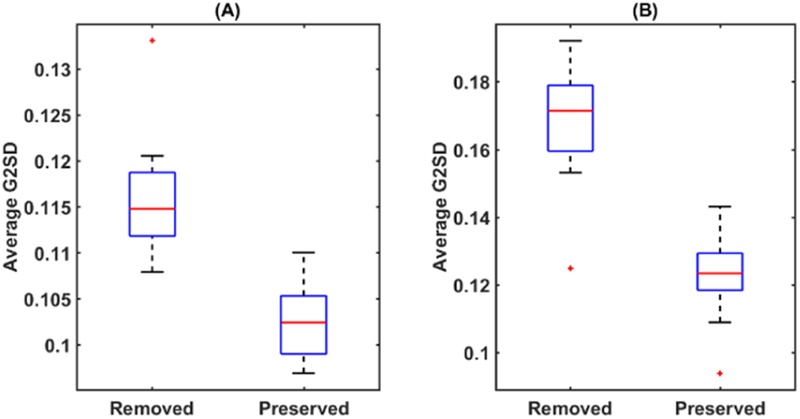
Besides visual assessment, we also conducted quantitative evaluations using the group graph spectral distance (G2SD) proposed in [7]. The G2SD distance is low for topographically organized tracts and high for irregular tracts. For each bundle, we calculated the G2SD measure for the removed tracts after filtering and the tracts that were preserved. Based on our filtering parameters, 40% of the tracts were removed, and 60% of the tracts were preserved for the visual pathway; 30% of the tracts were removed, and 70% of the tracts were preserved for the CM pathway. The G2SD measure was calculated for each tract, and a mean value was calculated for the removed and preserved bundle for each subject. The boxplots of the mean G2SD values of the removed and preserved bundle were shown in Figure 4. We can see clearly that our method correctly removed the tracts with higher G2SD measure for both bundles, which shows high consistency of our method with previous work on topographic filtering [7].
Figure 4.
Box plots of the average G2SD measures of the removed and preserved bundle of 30 HCP subjects. (A) Visual pathway; (B) CM pathway.
4. Conclusions
Mapping the connectivity of brain circuits is fundamentally important for our understanding of the functions of the human brain. One main challenge in connectome research is the high degree of false positives and negatives in tractography results. To improve the biological validity of fiber tracking, we develop in this work a novel method for studying the topographic regularity in fiber tracts from FOD-based models. The key idea in our method is to reconstruct a smooth vector field that supports the tractogram of a given fiber bundle and quantify the topographic regularity of each tract by evaluating its validity as a vector field flow. In our experimental results, we demonstrated both qualitatively and quantitatively the effectiveness of our method in removing irregular tracts from fiber bundles. While we only demonstrated our methods on two fiber bundles, our method is general and can be applied to study other major fiber bundles. Besides tract filtering, the analysis of vector field flows from FOD models may also provide a novel opportunity to identify connectome signatures independent of tractography. For future work, we will examine the impact of different dMRI acquisition protocols on the performance of our method. We will also apply our method to different fiber bundles and compare with other tract filtering methods.
Acknowledgement
This work was in part supported by NIH grants RF1AG056573, R01EB022744, U01EY025864, P41EB015922, U01AG051218.
References
- 1.Van Essen DC, Ugurbil K, Auerbach E et al. (2012) The Human Connectome Project: a data acquisition perspective. Neuroimage 62 (4):2222–2231 [DOI] [PMC free article] [PubMed] [Google Scholar]
- 2.Jbabdi S, Sotiropoulos SN, Haber SN, Van Essen DC, Behrens TE (2015) Measuring macroscopic brain connections in vivo. Nature Neuroscience 18:1546. [DOI] [PubMed] [Google Scholar]
- 3.Maier-Elein KH, Neher PF, Houde J-C et al. (2017) The challenge of mapping the human connectome based on diffusion tractography. Nature Communications 8 (1): 1349. [DOI] [PMC free article] [PubMed] [Google Scholar]
- 4.Patel GH, Kaplan DM, Snyder LH (2014) Topographic organization in the brain: searching for general principles. Trends Cogn Sci 18 (7):351–363 [DOI] [PMC free article] [PubMed] [Google Scholar]
- 5.Jbabdi S, Sotiropoulos SN, Behrens TE (2013) The topographic connectome. Current Opinion in Neurobiology 23 (2):207–215 [DOI] [PMC free article] [PubMed] [Google Scholar]
- 6.Aydogan DB, Shi Y (2018) Tracking and validation techniques for topographically organized tractography. Neuroimage 181:64–84 [DOI] [PMC free article] [PubMed] [Google Scholar]
- 7.Wang J, Aydogan DB, Varma R, Toga AW, Shi Y (2018) Modeling topographic regularity in structural brain connectivity with application to tractogram filtering. NeuroImage 183:87–98 [DOI] [PMC free article] [PubMed] [Google Scholar]
- 8.Lister WT, Holmes G (1916) Disturbances of Vision from Cerebral Lesions, with Special Reference to the Cortical Representation of the Macula. Proc R Soc Med 9 (Sect Ophthalmol):57–96 [PMC free article] [PubMed] [Google Scholar]
- 9.Ebeling U, Reulen HJ (1988) Neurosurgical topography of the optic radiation in the temporal lobe. Acta Neurochir (Wien) 92 (1-4):29–36 [DOI] [PubMed] [Google Scholar]
- 10.Tootell RB, Switkes E, Silverman MS, Hamilton SL (1988) Functional anatomy of macaque striate cortex. II. Retinotopic organization. J Neurosci 8 (5): 1531–1568 [DOI] [PMC free article] [PubMed] [Google Scholar]
- 11.Engel SA, Rumelhart DE, Wandell BA et al. (1994) fMRI of human visual cortex. Nature 369 (6481):525. [DOI] [PubMed] [Google Scholar]
- 12.Yousry TA, Schmid UD, Jassoy AG et al. (1995) Topography of the cortical motor hand area: prospective study with functional MR imaging and direct motor mapping at surgery. Radiology 195 (l):23–29 [DOI] [PubMed] [Google Scholar]
- 13.Bilecen D, Scheffler K, Schmid N, Tschopp K, Seelig J (1998) Tonotopic organization of the human auditory cortex as detected by BOLD-FMRI. Hear Res 126 (1–2): 19–27 [DOI] [PubMed] [Google Scholar]
- 14.Haber SN, Knutson B (2010) The reward circuit: linking primate anatomy and human imaging. Neuropsychopharmacology 35 (l):4–26 [DOI] [PMC free article] [PubMed] [Google Scholar]
- 15.Pearl J (1988) Probabilistic reasoning in intelligent systems : networks of plausible inference. The Morgan Kaufmann series in representation and reasoning. Morgan Kaufmann Publishers, San Mateo, Calif. [Google Scholar]
- 16.Wahl M, Lauterbach-Soon B, Hattingen E et al. (2007) Human motor corpus callosum: topography, somatotopy, and link between microstructure and function. J Neurosci 27 (45): 12132–12138 [DOI] [PMC free article] [PubMed] [Google Scholar]
- 17.Conlon L (2001) Differentiable manifolds. Birkhäuser advanced texts, 2nd edn. Birkhäuser, Boston [Google Scholar]
- 18.Basser PJ, Pajevic S, Pierpaoli C, Duda J, Aldroubi A (2000) In vivo fiber tractography using DT-MRI data. Magnetic Resonance in Medicine 44 (4):625–632 [DOI] [PubMed] [Google Scholar]
- 19.Tournier JD, Calamante F, Connelly A (2007) Robust determination of the fibre orientation distribution in diffusion MRI Non-negativity constrained super-resolved spherical deconvolution. NeuroImage 35 (4):1459–1472 [DOI] [PubMed] [Google Scholar]
- 20.Tran G, Shi Y (2015) Fiber Orientation and Compartment Parameter Estimation from Multi-Shell Diffusion Imaging. IEEE Trans Med Imaging 34 (11):2320–2332 [DOI] [PMC free article] [PubMed] [Google Scholar]
- 21.Vaxman A, Campen M, Diamanti O et al. (2016) Directional field synthesis, design, and processing. Paper presented at the SIGGRAPH ASIA 2016 Courses, Macau, [Google Scholar]
- 22.Szeliski R, Zabih R, Scharstein D et al. (2008) A Comparative Study of Energy Minimization Methods for Markov Random Fields with Smoothness-Based Priors. IEEE Transactions on Pattern Analysis and Machine Intelligence 30 (6): 1068–1080 [DOI] [PubMed] [Google Scholar]
- 23.Tournier JD, Calamante F, Connelly A (2012) MRtrix: Diffusion tractography in crossing fiber regions. Int J Imaging Syst Technol 22 (l):53–66. doi: 10.1002/ima.22005 [DOI] [Google Scholar]
- 24.Kammen A, Law M, Tjan BS, Toga AW, Shi Y (2016) Automated retinofugal visual pathway reconstruction with multi-shell HARDI and FOD-based analysis. Neuroimage 125:767–779 [DOI] [PMC free article] [PubMed] [Google Scholar]


