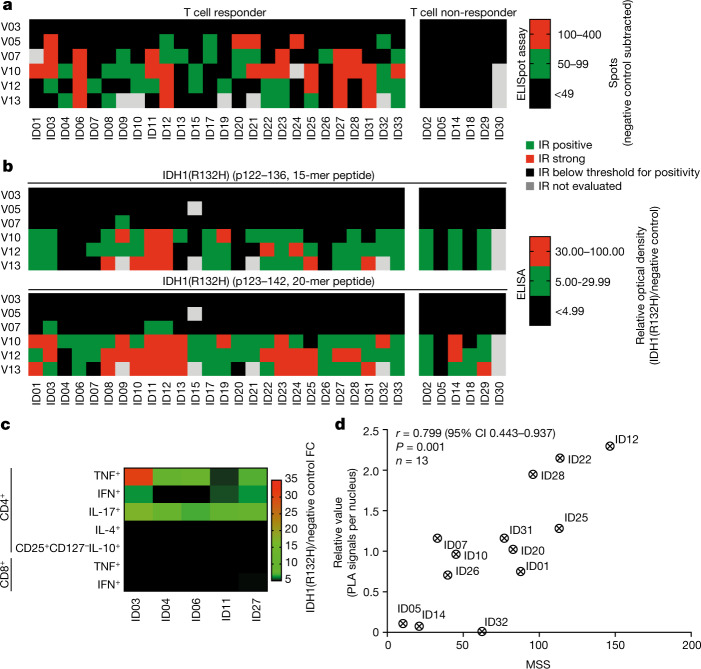
Fig. 2. Cellular and humoral immunogenicity of IDH1-vac.
a, b, Semi-quantitative analysis of T cell (a) and B cell (b) immune responses (IR) in all patients in the IDS measured by IFNγ enzyme-linked immunosorbent spot (ELISpot) assay (a) or IDH1 peptide enzyme-linked immunosorbent assay (ELISA) (b) (n = 30 patients). Patients are classified as T cell responders (n = 24 patients) and non-responders (n = 6 patients) on the basis of specific spot count cut-off of 50 as defined in the study protocol. Response for each visit (V) is shown. c, Flow cytometric effector phenotyping of peripheral IDH1-vac-induced T cells (single live CD3+ cells) from available patient samples with high MSS (n = 5 patient samples). Relative values after re-stimulation with IDH1(R132H) peptide compared to negative control peptide (myelin oligodendrocyte glycoprotein; MOG) are shown. FC, fold-change. Gating strategy is shown in Extended Data Fig. 4c. d, Correlation of intratumoral IDH1(R132H) peptide presentation at baseline (quantified by PLA signal) with the magnitude and sustainability of specific peripheral T cell responses (quantified by the MSS; see Extended Data Fig. 5). r, Pearson correlation coefficient. Patient ID numbers are shown in a–d.

