

Abstract
Spermatogenesis in mammals is a cyclic process of spermatogenic cell development in the seminiferous epithelium that can be subdivided into 12 subsequent stages. Histological staging analysis of testis sections, specifically of seminiferous tubule cross-sections, is the only effective method to evaluate the quality of the spermatogenic process and to determine developmental defects leading to infertility. Such staging analysis, however, is tedious and time-consuming, and it may take a long time to become proficient. We now have developed a Computerized Staging system of Spermatogenesis (CSS) for mouse testis sections through learning of an expert with decades of experience in mouse testis staging. The development of the CSS system comprised three major parts: 1) Developing computational image analysis models for mouse testis sections; 2) Automated classification of each seminiferous tubule cross-section into three stage groups: Early Stages (ES: stages I-V), Middle Stages (MS: stages VI-VIII), and Late Stages (LS: stages IV-XII); 3) Automated classification of MS into distinct stages VI, VII-mVIII, and late VIII based on newly developed histomorphological features. A cohort of 40 H&E stained normal mouse testis sections was built according to three modules where 28 cross-sections were leveraged for developing tubule region segmentation, spermatogenic cells types and multi-concentric-layers segmentation models. The rest of 12 testis cross-sections, approximately 2314 tubules whose stages were manually annotated by two expert testis histologists, served as the basis for developing the CSS system. The CSS system’s accuracy of mean and standard deviation (MSD) in identifying ES, MS, and LS were 0.93 ± 0.03, 0.94 ± 0.11, and 0.89 ± 0.05 and 0.85 ± 0.12, 0.88 ± 0.07, and 0.96 ± 0.04 for one with 5 years of experience, respectively. The CSS system’s accuracy of MSD in identifying stages VI, VII-mVIII, and late VIII are 0.74 ± 0.03, 0.85 ± 0.04, and 0.78 ± 0.06 and 0.34 ± 0.18, 0.78 ± 0.16, and 0.44 ± 0.25 for one with 5 years of experience, respectively. In terms of time it takes to collect these data, it takes on average 3 hours for a histologist and 1.87 hours for the CSS system to finish evaluating an entire testis section (computed with a PC (I7–6800k 4.0 GHzwith 32GB of RAM & 256G SSD) and a Titan 1080Ti GPU). Therefore, the CSS system is more accurate and faster compared to a human histologist in staging, and further optimization and development will not only lead to a complete staging of all 12 stages of mouse spermatogenesis but also could aid in the future diagnosis of human infertility. Moreover, the top-ranking histomorphological features identified by the CSS classifier are consistent with the primary features used by histologists in discriminating stages VI, VII-mVIII, and late VIII.
Keywords: Mouse testis histology, Sperm development, Mouse testicular section images, Seminiferous tubules, Computerized staging of spermatogenesis, Spermatogenic cell segmentation, Deep learning
1. Introduction
Mammalian sperm production is a highly complex yet efficient developmental process, generating hundreds of millions of motile sperm per ejaculation. A key element to this massive sperm production is the continuous and cyclical nature of spermatogenesis taking place inside the seminiferous tubules packed within the testis. The testes are capable of producing male germ cells through spermatogenesis, secreting androgen through Leydig cell that maintains male sexual characteristics Clermont (1972). Due to the similarity of mammalian testis structure and sperm development, human sperm production is usually modeled on mouse testes. Mouse spermatogenesis is a continuous, cyclical and synchronized process taking place in the epithelium of the seminiferous tubules. The specific associations of germ cells at different steps of their development in tubule cross-sections are called “stages” or “phases” of spermatogenesis (Ahmed and de Rooij, 2009). During spermatogenesis, stem spermatogonia transform within the seminiferous tubules through subsequent types of undifferentiated and differentiating spermatogonia, into spermatocytes that carry out the process of meiosis, and further into round and elongated spermatids that transform into spermatozoa. The development of successive associations of types of spermatogonia, spermatocytes, and round and elongated spermatid are key factors in determining the epithelial stages in cross-sections of seminiferous tubules. The cycle of the mouse seminiferous epithelium is arbitrarily subdivided into 12 subsequent stages (I-XII) by using developmental steps in the acrosomic system and nucleus of spermatids Oakberg (1956) (Fig. 1).
Fig. 1.
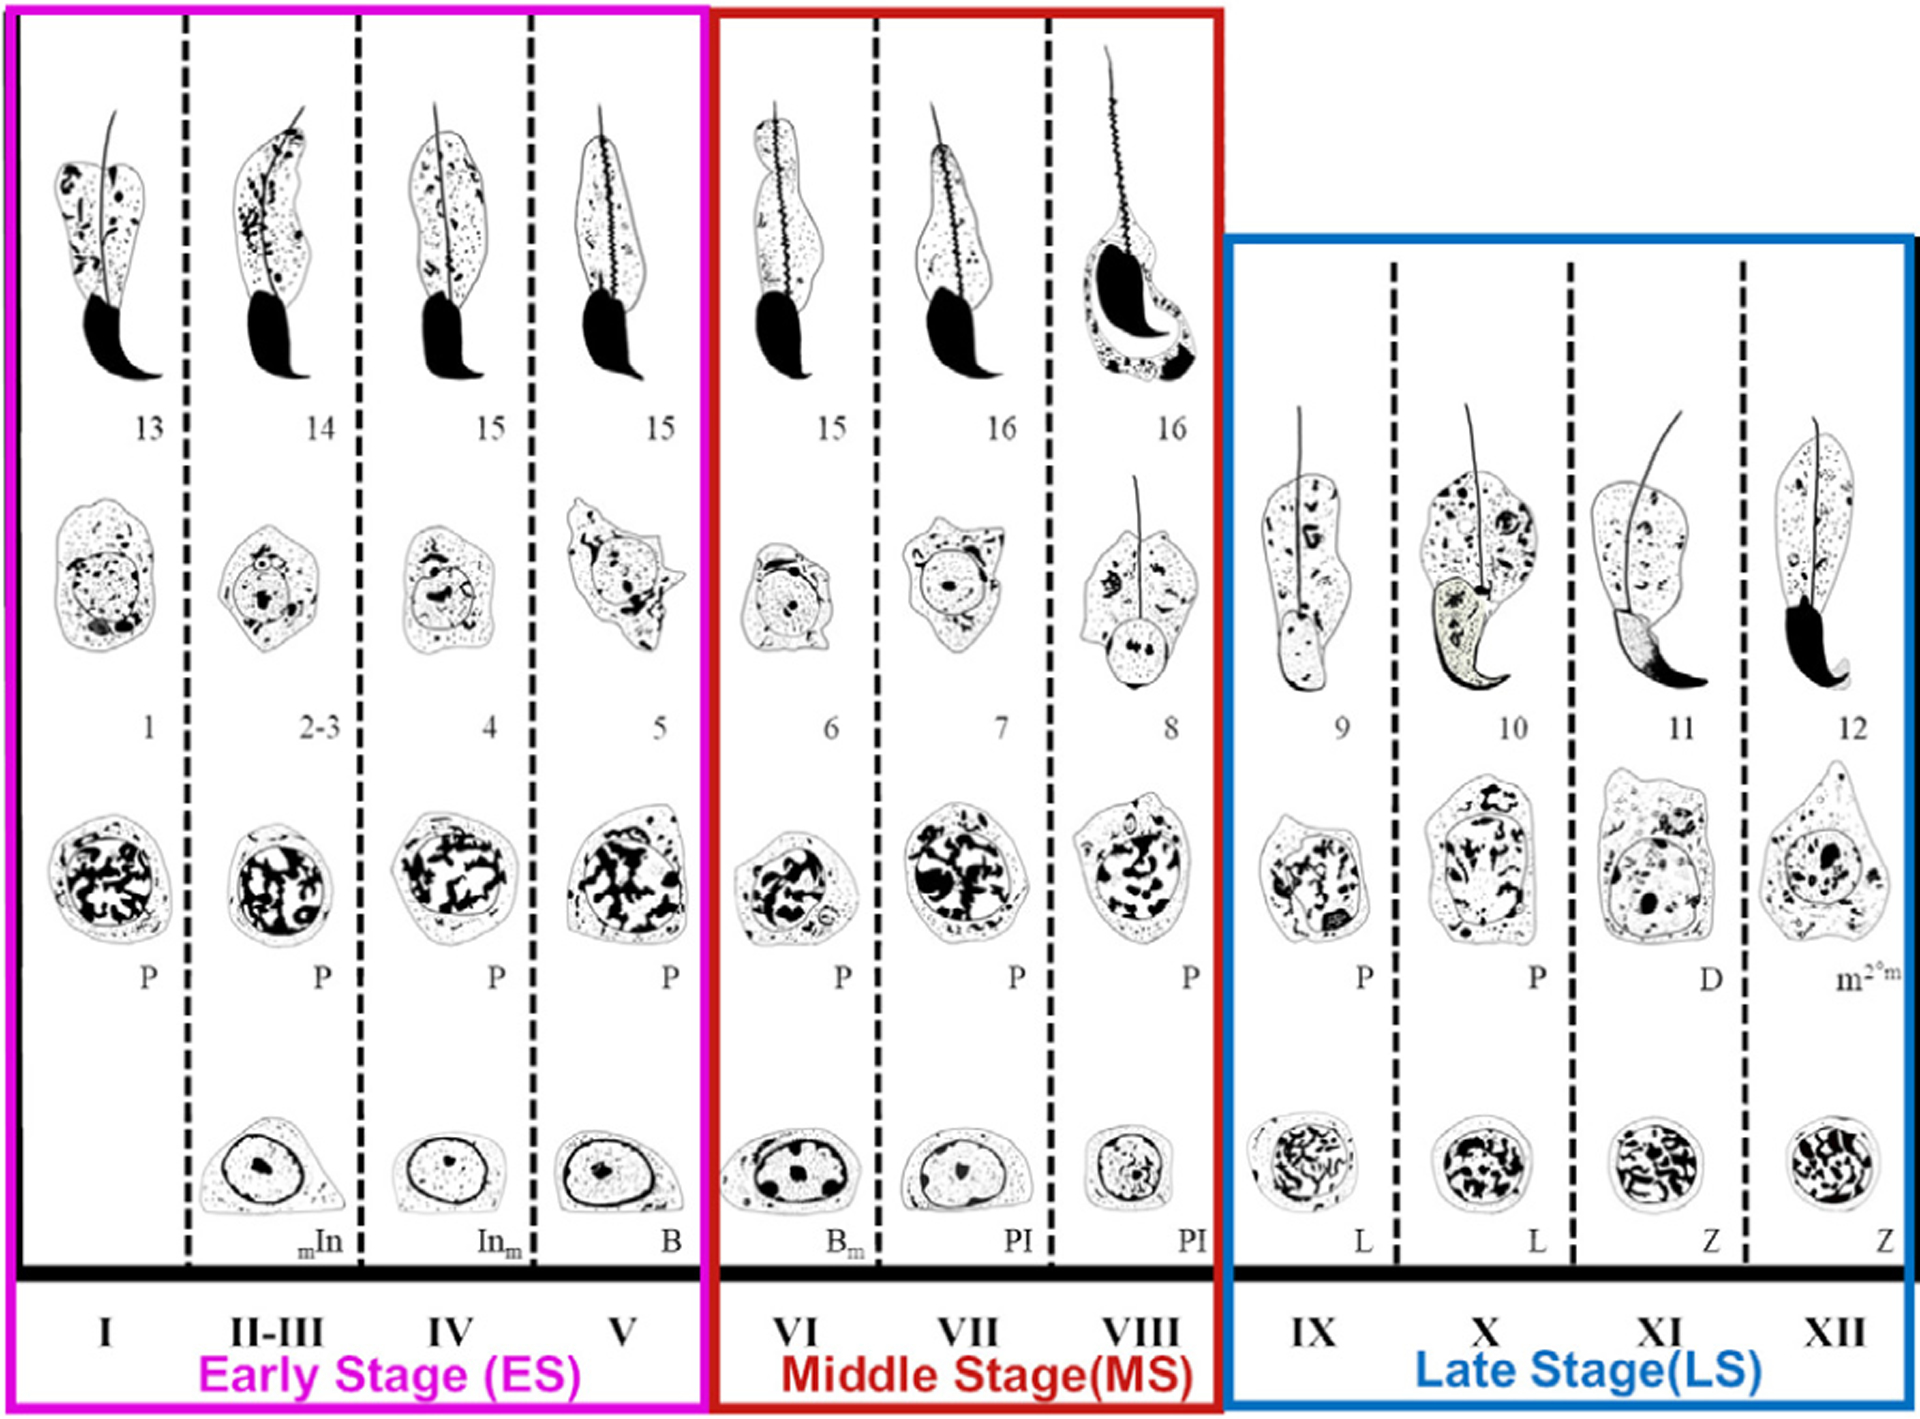
Illustration of the stages of spermatogenesis in the mouse (Adapted from Russell et al. (1993)). Early (I-V), middle (VI-VIII), and late (IX-XII) stages of seminiferous tubule epithelial cycle were defined in this paper. Various types of developing spermatogonial cells (In and B), spermatocytes (PI, L, Z, P, D, and m2), and various steps of developing spermatids from 1 to 16. Spermatid development is divided into sixteen steps, so 1 to 16 represent each of sixteen steps of developing spermatids.
Identification and analysis of those stages in testicular sections are key to understand histopathological changes of spermatogenic cells of animals suffering from infertility (VanGompel and Xu, 2010; Li et al., 2019a). Moreover, a proper identification of the epithelial stages is of key importance to determine protein/mRNA expression of fertility genes during germ cell development or when one wants to analyze the spermatogenic defects in infertile mice (Ahmed and de Rooij, 2009). A mouse testis section contains hundreds of seminiferous tubules (Fig. 2(b)). Each tubule cross-section (Fig. 2(c)) contains multiple types of spermatogenic cells in specific concentric layers Russell et al. (1993) (Fig. 2(c–h)). A seminiferous tubule cross-section contains various types of spermatogenic cells with distinct and complex morphological features, and consecutive stages have small or even subtle differences, which makes it difficult to identify and distinguish each stage. However, most studies describing the epithelial stages are based on Periodic Acid Schiff (PAS) and hematoxylin-stained sections and are based primarily upon the changes of the acrosome and nuclear morphology of the younger generation of spermatids. In some circumstances, PAS-hematoxylin stained sections are not available, such as with immunohistochemistry, or when characteristic spermatogenic cell types are missing, as in young mice and some mutant mice, making stage identification much more difficult (Ahmed and de Rooij, 2009). We aimed to develop a fast staging method of tubule cross-sections stained by the generally available H&E methodology. Stage identification has been used by reproduction labs around the world yet only a few manage to attain the level of mastery to produce unequivocal analysis. We started off by subdividing the cycle of the seminiferous epithelium into three-stage groups (see Fig. 1): Early Stages (ES: I-V), Middle Stages (MS: VI-VIII) and Late Stages (LS: IX-XII) (Hess and de Franca, 2008; Meistrich and Hess, 2013). MS tubules are harder to distinguish from each other even by seasoned histologists. Given the difficulty in distinguishing stage VII and early or middle VIII (mVIII) stage without acrosome staining, we decided only to use VII-mVIII as the category closest to VII. We hoped that the computerized system could learn and eventually distinguish VII and early or mVIII based on H&E staining.
Fig. 2.
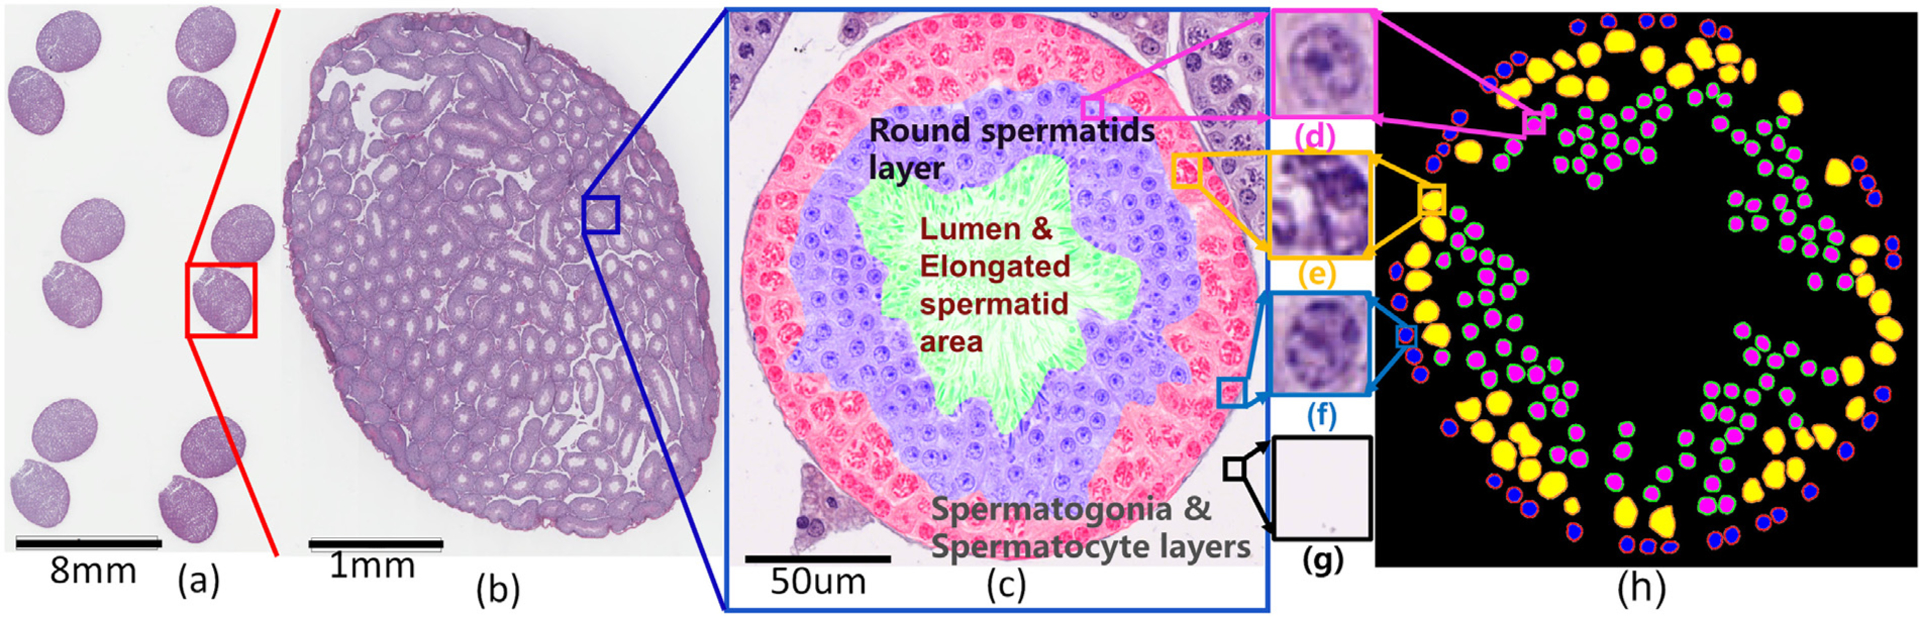
H&E stained slide of mouse testicular sections at different resolutions and a cross-section of a tubule with types of spermatogenic cells and multi-concentric-layers at 400X magnification. Images at different magnifications of H&E stained mouse testicular cross-sections from a slide image to a tubule section with three main types of spermatogenic cells and three concentric-layers. (a) a digitalized Whole Slide Image (WSI) at 100X magnification, (b) a testicular cross-section at 200X magnification, (c) a tubule cross-section from (b) in Stage VII at 400X magnification showing three concentric layers of spermatogenic cells, round spermatids (purple), spermatogonia and spermatocyte regions (red). The middle of a tubule (c) is the lumen with elongated spermatids and/or sperm in green. Between tubules are the background regions (g) in white. Distinct morphological differences in staining and texture between round spermatid (d), spermatocyte (e), and spermatogonium (f) are highlighted. The manually annotated mask (h) of three types of spermatogenic cells from (c).
In recent years, with the rapid development of whole slide digital scanners, tissue slides can be stored in digital image form Bera et al. (2019). It makes a computerized quantitative analysis of histopathological images possible. The development of a Computerized Staging of Spermatogenesis (CSS) system can help histologists in making more accurate staging decisions. High-resolution Whole Slide Image (WSI) of a mouse testis section covers a very large area, and each WSI contains many tubule cross-sections (Fig. 2(a) and (b)). Each mouse testis section comprises hundreds of seminiferous tubule cross-sections (see Fig. 2(b)). There are different types of spermatogenic cells laying in concentric layers in each tubule (Figs 2 (c–g)). In general, a seminiferous tubule cross-section represents one epithelial stage and shows three major types of spermatogenic cells: round spermatids (Fig. 2(d)), spermatocytes (Fig. 2(e)), and spermatogonia (Fig. 2(f)). These cell types form concentric layers: round spermatids (purple region in Fig. 2(c)), spermatogonia and spermatocytes (see red region in Fig. 2(c)), the lumen and elongated spermatid (green region in Fig. 2(c)), and background (white region in Fig. 2(c)) regions. Automated segmentation of different spermatogenic cells and distinguishing concentric-layers in a tubule is a challenging task. Fig. 2(h) shows the manual segmentation for three types of spermatogenic cells and three concentric layers in a mouse seminiferous tubule.
2. Previous work and novel contributions
Stage-identifying criteria are based on the successive cellular associations appearing in any one given area of the seminiferous tubule. Based on Oakberg’s 12-stage classification scheme, Ahmed and de Rooij (2009) summarized all stage-identifying criteria that can be used in the ideal situation as well as in hematoxylin-only stained sections and/or when some spermatogenic cell types are missing. Seminiferous tubules are the basic biological structure as part of the criteria for staging. The epithelial cell types in a seminiferous tubule are the most important in staging. The identification and segmentation of a tubule and its epithelial cells represent the first step in the development of a computerized staging system. To improve the speed and accuracy of staging, Hess and Chen (1992) developed a computer program to aid in tracking male germ cells in different mammals. Fakhrzadeh et al. (2012) presented an active contour model based approach for fully automated segmentation of seminiferous tubules. Fakhrzadeh et al. (2013) further presented a graph-cut based approach for epithelial cell segmentation in testicular tissue and subsequently presented a computerized staging method to analyze mink testis tissue in Fakhrzadeh et al. (2017). However these approaches were developed using immunohistochemically stained images involving a Gata-4 antibody to stain the acrosomes of round spermatids in the mink Spörndly-Nees (2018). A convolutional neural network was presented in Lee et al. (2018) for tubule structure segmentation using fluorescence microscope images. In the present study Xu et al. (2019b), we developed a computational approach employing Hematoxylin and Eosin (H&E) stained images of mouse testis sections. H&E represents the most common form of tissue staining to evaluate tissue morphology. Handcraft features have been used for describing the morphology of tissue samples. A Derivative-of-Gaussian (DtG) filter can be used for edge detection, retinal vascular segmentation and texture analysis. Basic Image Features (BIFs) was used in Reis et al. (2017) to classify breast cancer matrix maturity. The calculation method of BIFs were to divide the output results obtained after the convolution of an image with a group of DtG filters into seven categories. Each category corresponds to the distinction of different local image structures based on local symmetric types: Slopes, radially dark and light blobs, dark and light lines, saddle points, and flat regions (Griffin, 2007; Crosier and Griffin, 2010). In Lee et al. (2017); Lu et al. (2018); Wang et al. (2018); Whitney et al. (2018); Li et al. (2019b), the textural heterogeneity measurements of tissue or nuclear feature were used for diagnosis or prognosis of cancers. In Lee et al. (2017), nuclear shape and architecture was developed with respect to benign tissues for predicting biochemical recurrence in prostate cancer. Lu et al. (Lu et al., 2018) proved that nuclear shape and orientation features from H&E images can predict survival in early-stage estrogen receptor-positive breast cancers. Whitney et al. (2018) and Li et al. (2019b) used quantitative nuclear histomorphometric features to predict Oncotype DX risk categories in ductal carcinoma in situ. Lewis et al. (2014) used graph-based features, allowing for capture of spatial distribution, arrangement and architecture of individual types of nuclei or lymphocytes to identify aggressive versus indolent p16-positive oropharyngeal squamous cell carcinoma.
In recent years, deep learning based detection and segmentation models have been shown to effectively address some of most challenging problems in histological image analysis (Xu et al., 2016b). A convolutional neural network was presented in Lee et al. (2018) for tubule structure segmentation in fluorescence microscopy images. Kao (2018) presented a deep learning model for classifying normal and abnormal seminiferous tubules. We developed ResNet based models for seminiferous tubule segmentation in mouse testis sections and types of spermatogenic cells and multi-concentric layers segmentation in seminiferous tubules (Xu et al., 2019b). Sirinukunwattana et al. (2017) provided an overview of gland segmentation in colon histology, where most of the segmentation schemes were based on deep convolutional neural networks (LeCun et al., 2015). Recently, U-Net (Ronneberger et al., 2015) based frameworks have attracted considerable attention to the problem of medical image segmentation (Ibtehaz and Rahman, 2020). U-Net can capture and utilize global context information on semantic segmentation tasks, which is fitted to our task of region segmentation according to the histological distribution of the different regions shown in Fig. 2(c).
Inspired by these studies, we aimed to develop a CSS system of mouse spermatogenesis based on quantitative image analysis in mouse testis sections. The organization of different types of spermatogenic cells in concentric layers within cross-sections of the seminiferous tubules is the key factor to discriminate different developmental steps, especially Stages VI-VIII. Also, the visual recognition, semi-quantification and integration of multiple morphological features of the different spermatogenic cells and concentric layers in seminiferous tubules are the key to stage-identifying criteria. In order to further identify Stages VI, VII-mVIII, and late VIII in MS, the segmentation of different spermatogenic cells and different concentric layers was the fundamental step. Then new histomorphological features were developed for quantifying tubules and subsequently leveraged to discriminate the stages in mouse testis sections. There are three segmentation models: seminiferous tubule segmentation (Fig. 7(b)), types of spermatogenic cell (spermatids, spermatocytes, and spermatogonia) (Fig. 2 (c–h)) segmentation, and multi-concentric-layers (Spermatogonial & Spermatocyte layer, round spermatids layer, and elongated spermatid area) (Fig. 2(c)) segmentation. According to the distribution of nuclei in Fig. 8 (b–f), we chose segmantic segmentation methods using U-Net instead of the time-consuming pixel-wise method (Xu et al., 2019b) due to the large numbers of seminiferous tubules in a section.
Fig. 7.
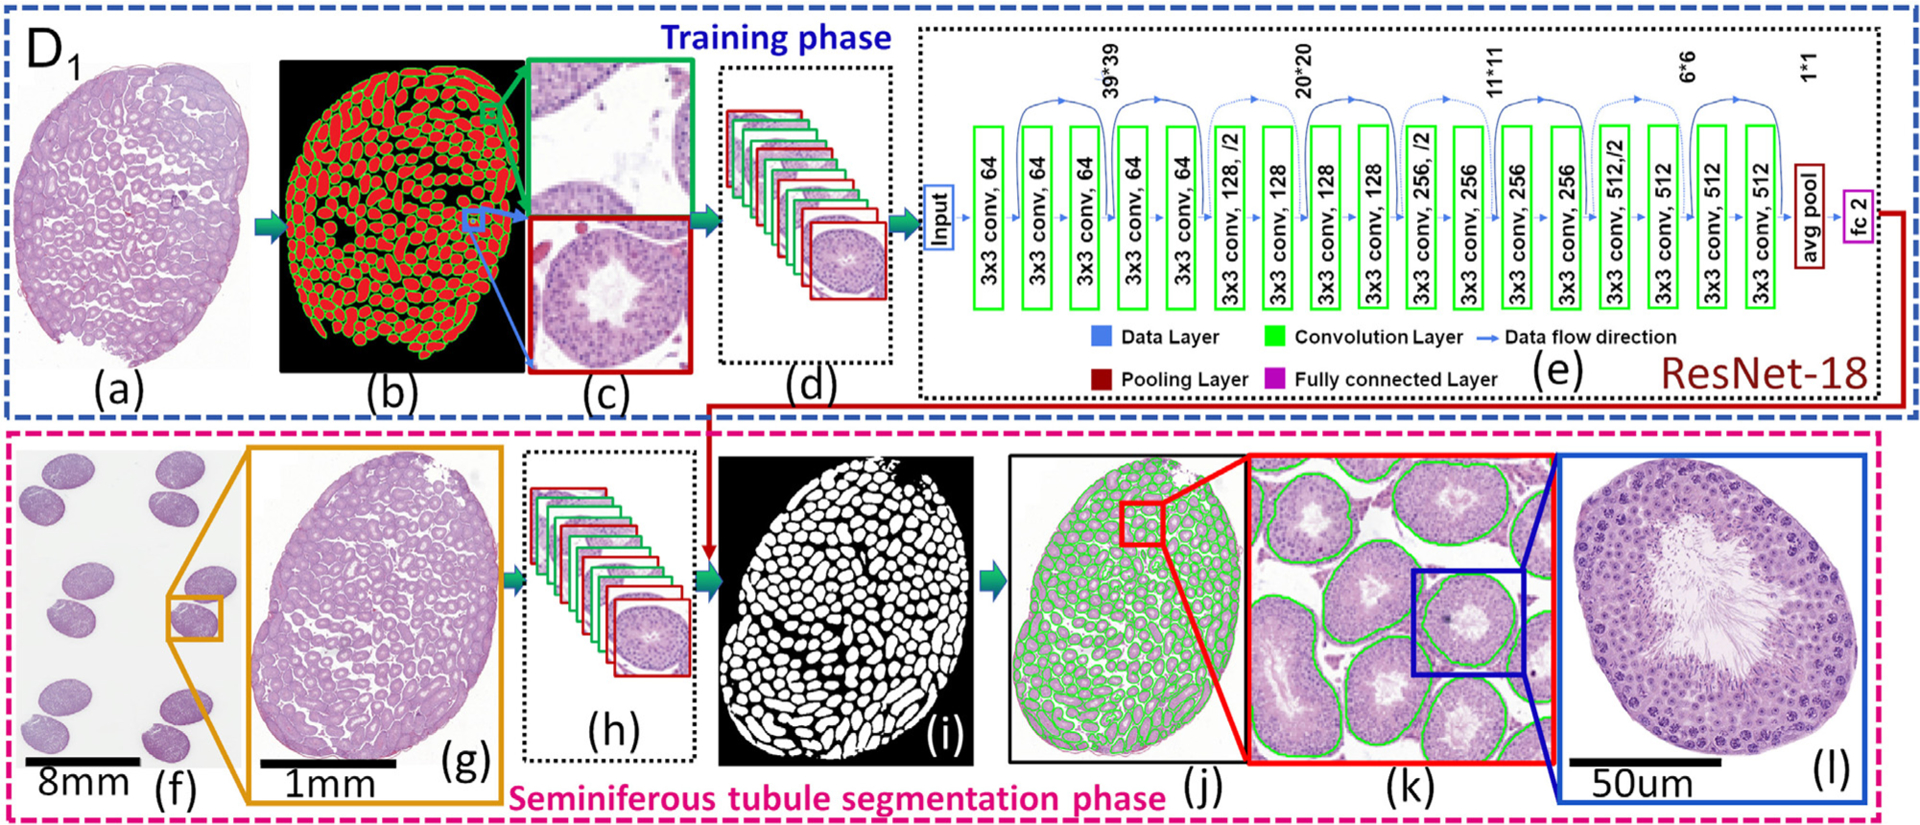
The flowchart of seminiferous tubule segmentation. It comprises training (a-e) and seminiferous tubule segmentation (f-l) phases.
Fig. 8.
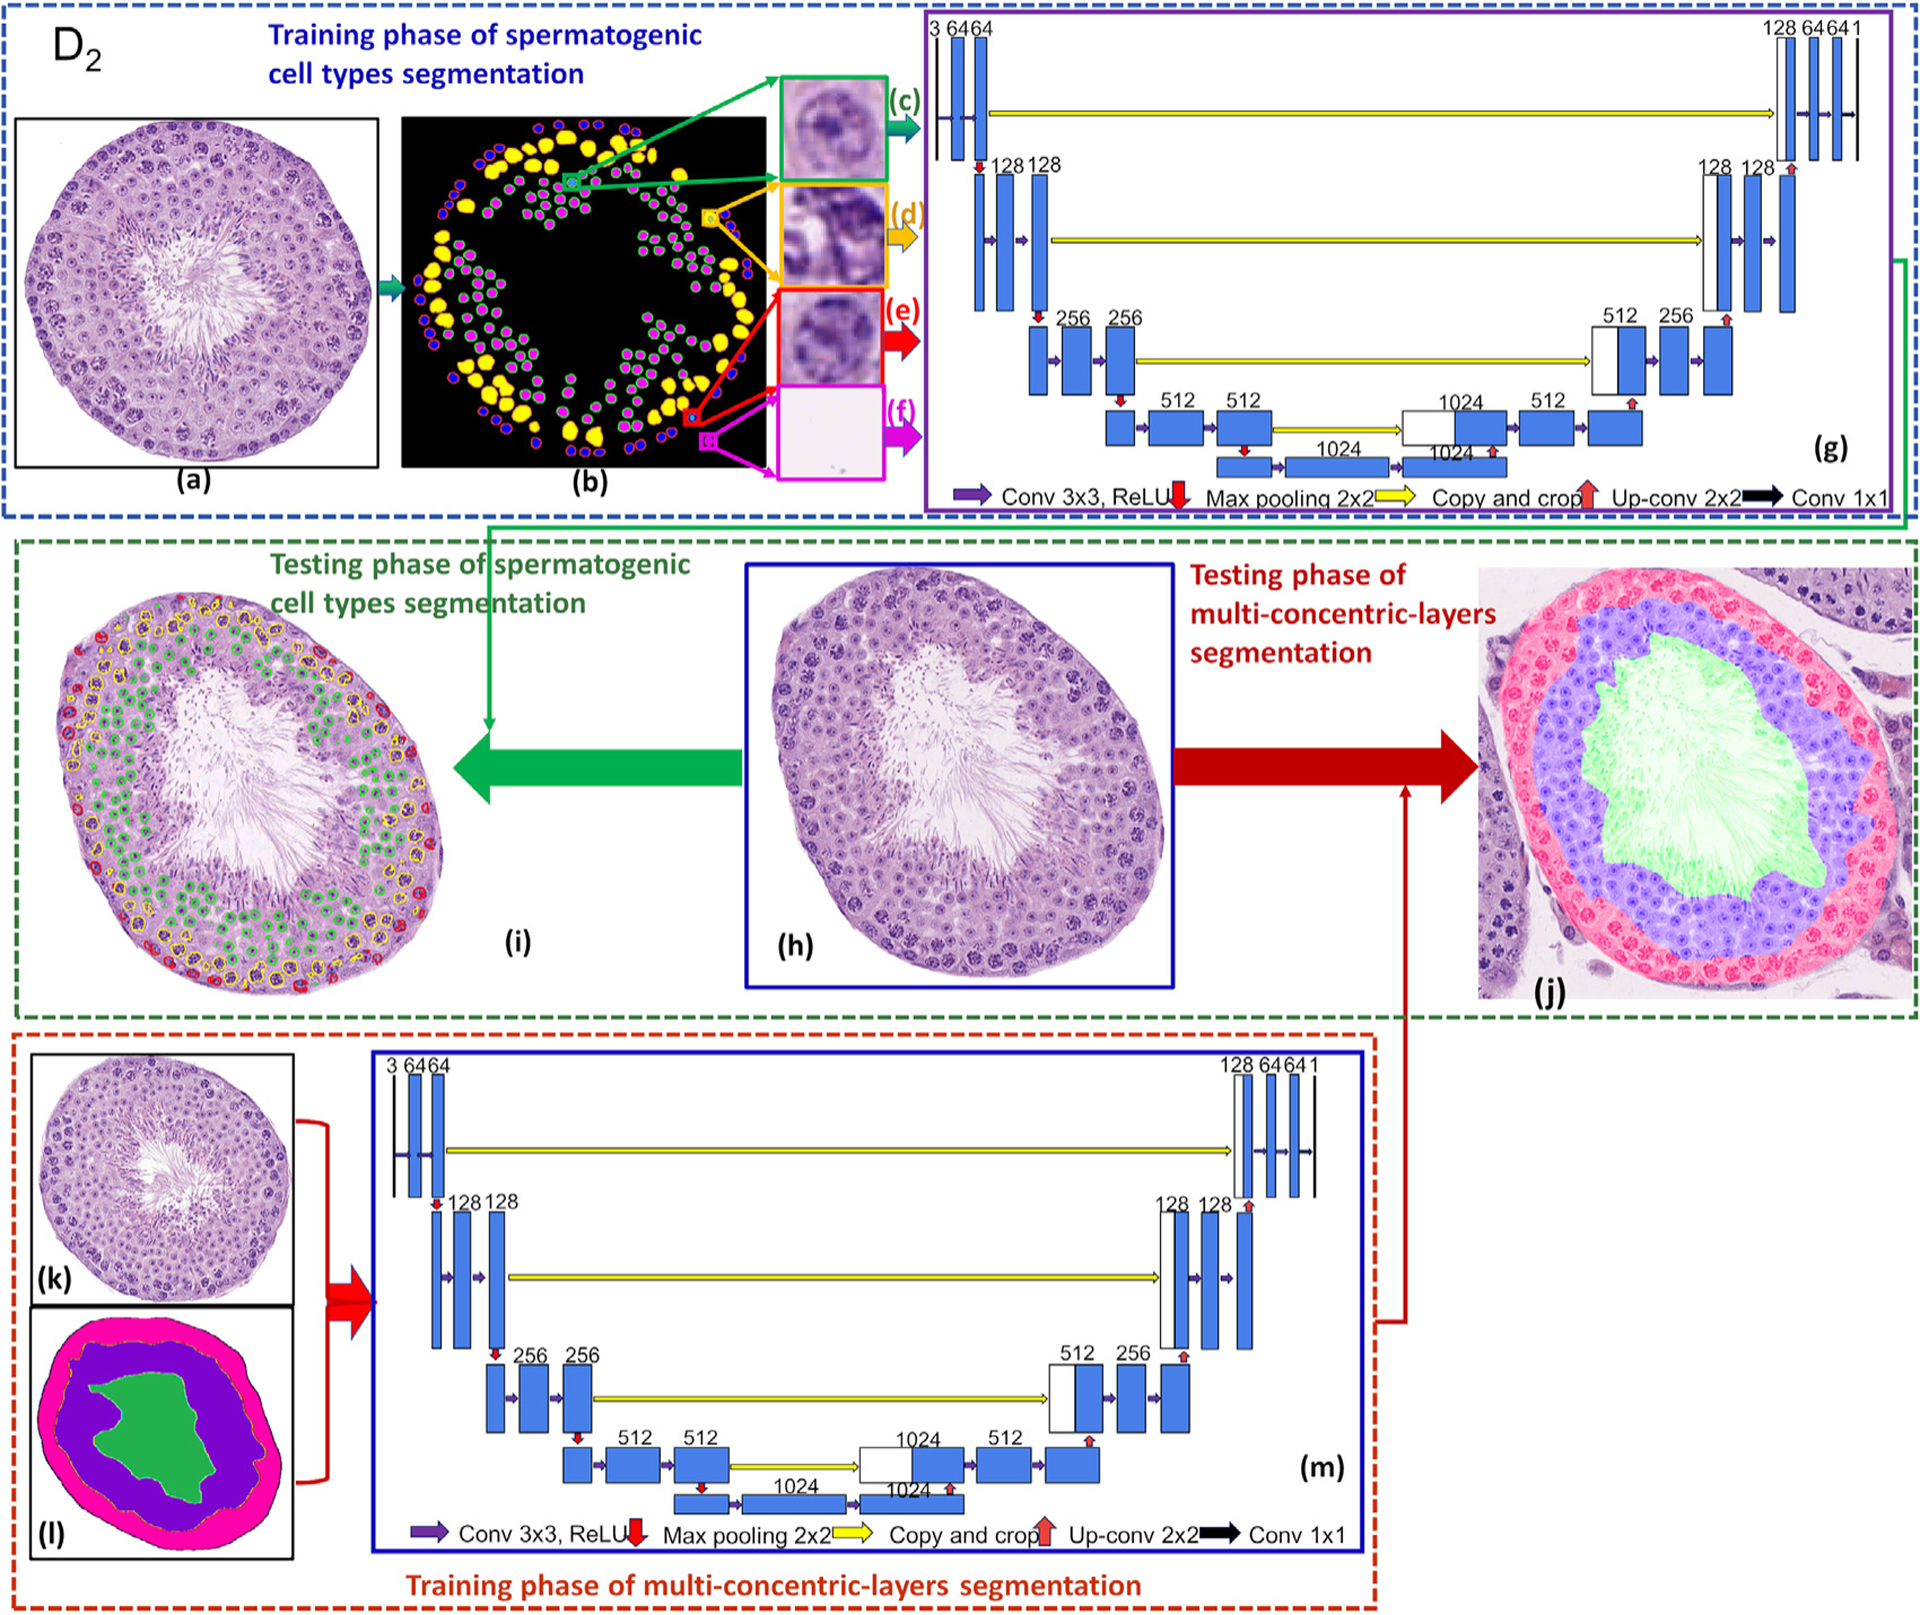
The flowchart of types of spermatogenic cells and multi-concentric-layers segmentation.
The developmental stages in MS are harder to discriminate by histologists. Histologists discriminate stages VI, VII-mVIII, and late VIII based on the visualization of the association of various types of spermatogenic cells and multi-concentric-layers. We concluded that there are two critical factors in discriminating stages VI, VII-mVIII, and late VIII: 1) the association of different spermatogenic cells and different concentric layers; 2) the elongated spermatids area in each tubule. The CSS system includes three modules: 1) The segmentation of seminiferous tubules in testis sections, types of spermatogenic cells, and multi-concentric-layers in a tubule. Then based on the segmentation results, types of spermatogenic cells and multi-concentric-layers, cell- and region-level based features were extracted for quantifying MS tubules; 2) Classification of seminiferous tubules in a mouse testis section into three initial stage groups: ES (stages I-V), MS (stages VI-VIII), and LS (stages IV-XII); 3) Classification of MS into Stages VI, VII-mVIII, and late VIII.
The novel contributions of this study:
To the best of our knowledge, this is the first report on the development of computerized staging of the spermatogenic process(CSS system) in mouse H&E stained testis sections based on quantitative image analysis.
The CSS system was developed for identifying three stage groups (ES, MS, and LS). In addition, the MS tubules were further discriminated into VI, VII-mVIII, and late VIII stages.
A seminiferous tubule segmentation model was developed for the identification of tubules in mouse testicular sections. Also, types of spermatogenic cells and multi-concentric-layers segmentation models were developed to identify types of spermatogenic cells and multi-concentric-layers in seminiferous tubules.
- A set of quantitative histomorphological features were developed for discriminating tubules in stages VI-VIII:
- Derivative-of-Gaussian (DtG) filter was leveraged to extract elongated spermatids orientation entropy, which is the primary feature for discriminating tubules in stages VI-VIII;
- The significant histomorphological features chosen by the CSS system were spermatogonial textures, elongated spermatids orientation and spermatid textures, which are the primary features of stage-identifying criteria by histologists in discriminating stages VI, VII-mVIII, and late VIII.
3. Materials and methods
3.1. Dataset description
Mice used were housed and maintained under specific pathogen-free conditions in a temperature- and humidity-controlled animal facility at Nanjing Medical University, China. Mice were maintained on a 12h-light-12h-dark cycle with free access to water and food. The Institutional Animal Care and Use Committee (IACUC) of Nanjing Medical University, China, approved all animal work. Mouse strains were on the C57BL/6 genetic background.
Adult mouse testes were collected and fixed in Hartman’s Fixative (Sigma, H0290) for 24 hours first, cut in halves, and fixed for another 24hr at room temperature. Fixed testes were embedded in paraffin and cross-sectioned at 5 μm. Each slide contained 6 testis sections that were processed for H&E staining (VanGompel and Xu, 2010) (Fig. 2(a)). Images were captured on a 3DHISTECH Pannoramic SCAN II at 40X magnification with a resolution of 0.23 μm per pixel and processed using ImageScope software. The size of each digitized Whole Slide Image (WSI) was around 21000 × 23000 pixels and the compressed storage space was approximately 1.5GB. A total of 162 testis sections from 27 slides were captured. 40 high-quality testis sections (not from consecutive sections) were carefully chosen from the 27 WSIs for this study. A detailed description of the three datasets is presented in Table 1.
Table 1.
Summary of datasets studied in the paper and their corresponding purpose, training and testing sets, annotations, and modules to three datasets.
| Datasets | Purpose | Training and testing sets | Annotations as the groundtruth | Modules | ||||
|---|---|---|---|---|---|---|---|---|
| (# of sections) | Training | Testing | (see Fig. 4) | (see Fig. 3) | ||||
| 40 | 28 | D1 | Developing quantitative image analysis models | Seminiferous tubule segmentation | 14 sections | 14 sections | By a histologist (HL) with 5 years experiences |
Module 1a |
| D2 | Types of spermatogenic cells and multi-concentric-layers segmentation and histomorphological features extraction for MS Tubules | 172 MS tubules | 171 MS tubules | Modules 1b & 1c | ||||
| 12 | D3 | Training and testing the CSS system as well as compared to a human histologist with 5 year experiences | 6 sections | 6 sections | By a well-known histologist (DR) | Modules 2b & 3 | ||
3.1.1. Manual annotation
The developmental stages of seminiferous tubules in testis sections were manually evaluated based on different modules (see Table 1) by histologists DR and HL who have been working on mouse testis histology for many years. As one of these (DR) has an exceptionally large experience in this field, his opinion on how to subdivide the cycle of the seminiferous epithelium in H&E stained testis sections was taken as a reference base in order to minimize the variation between the individual histologists. The differences between the epithelial stages in sections not stained by the PAS technique have been described in detail previously (Ahmed and de Rooij, 2009). The stage evaluation was done according to the description of the stages in the paper. Table 2 describes the stage-identifying criteria when annotating the tubules in a testis section (Fig. 4). Three datasets were built from 40 mouse testicular sections (Table 1). The flowchart of generating the basis for distinguishing developmental stages is shown in Fig. 4. In D3, the stage (stages I-XII) of spermatogenesis for each seminiferous tubule were annotated by DR (Fig. 4(b)). Then based on tubule segmentation results (Fig. 4(c)), the tubules in different stages were shown in different false-colors (Fig. 4(d,e)). In the study of Modules 2 and 3, the annotation of developmental stages by DR served as the basis for comparing the results obtained by the CSS system and histologist HL in the staging of spermatogenesis.
Table 2.
Description of the stage-identifying criteria.
| Spermatogenesis Stages | Description | |
|---|---|---|
| Early Stages(ES) | I-II | Pachytenes are small and close to the basal membrane. |
| Spermatogonia are dividing in both stages. | ||
| III | There are young (small In spermatogonia and no spermatogonial divisions). Rare stage. | |
| IV | Large or dividing In spermatogonia and B spermatogonia in telophase of mitosis. | |
| Pachytenes are somewhat larger and not so close to the basal lamina as in stages I-II. | ||
| V | Young (small) B spermatogonia and elongated spermatids not yet at the lumen. | |
| Middle Stages (MS) | VI | Large or dividing B spermatogonia or preleptotene spermatocytes in telophase. |
| Elongated spermatids at the tubule lumen. | ||
| VII-mVIII | Preleptotenes are larger but did not yet enter leptotene. | |
| Spermiation did not not yet occur. Spermatids are still round | ||
| Late VIII | Spermiation is taking place or finished, preleptotenes are entering leptotene. | |
| Spermatids are still round | ||
| Late Stages (LS) | IX | Spermatids are no longer round but not yet elongated |
| X | Spermatids are elongating but did not yet flatten completely | |
| XI | Spermatids have flattened completely | |
| XII | All tubule sections in which meiotic divisions or secondary spermatocytes can be seen |
Fig. 4.
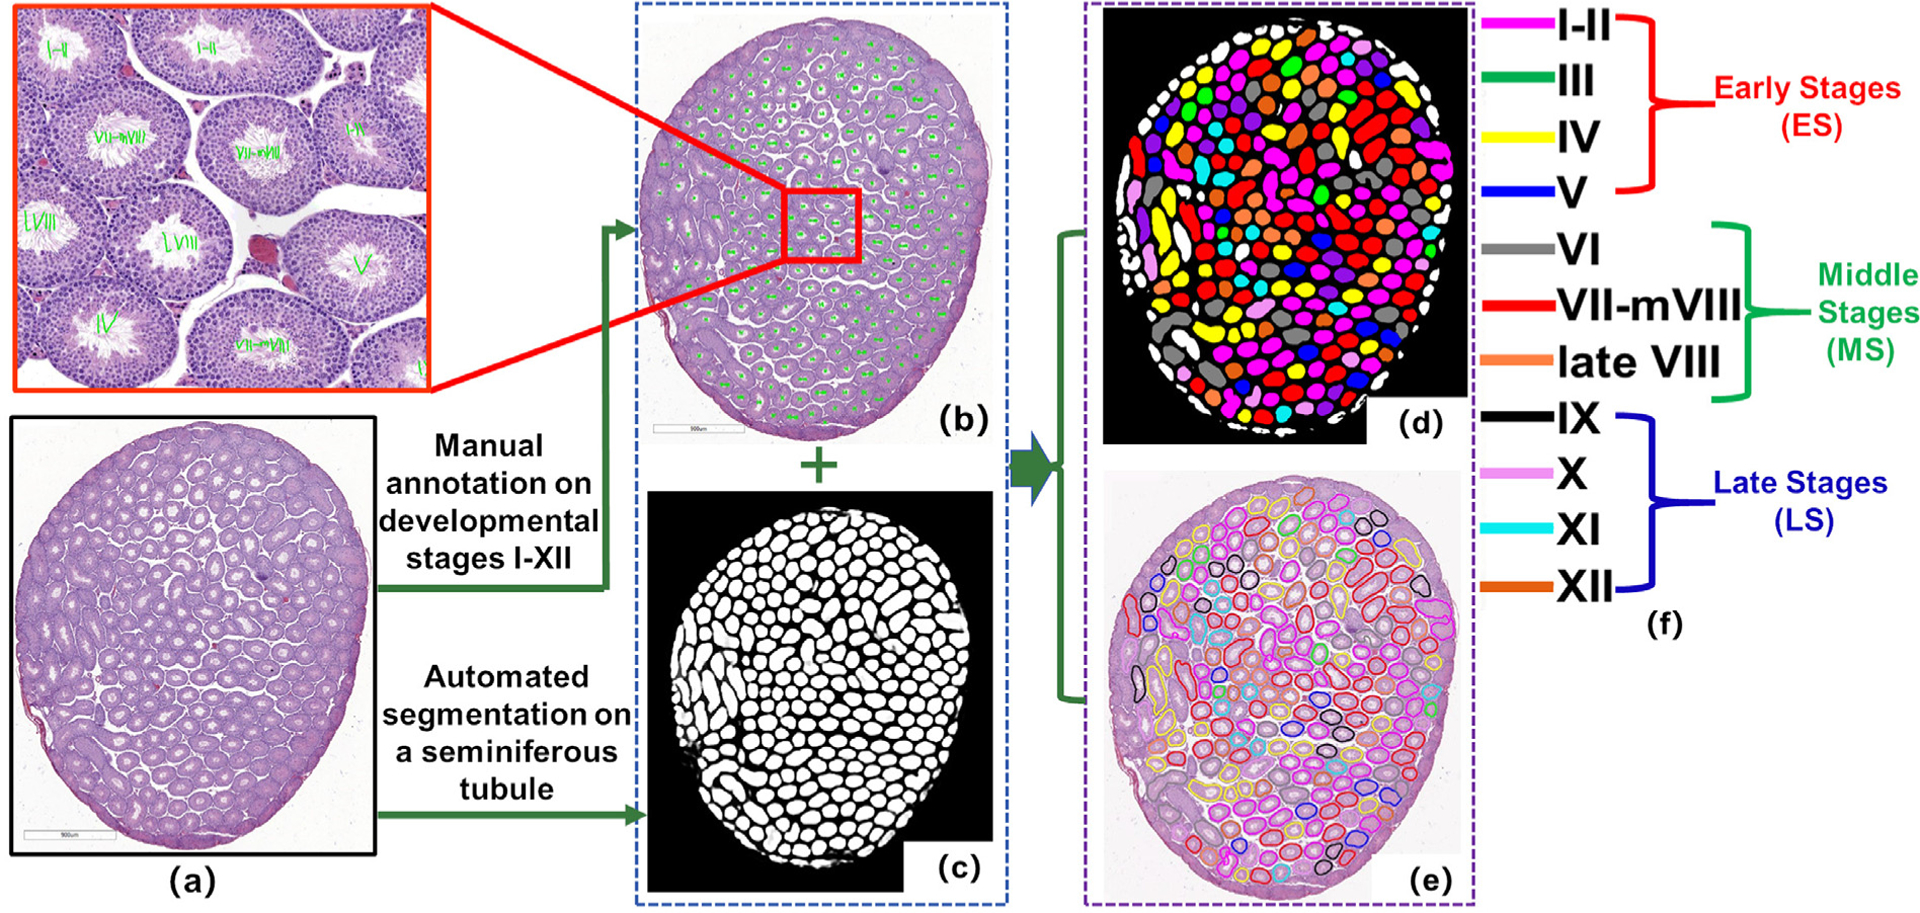
The diagram shows how the basis for distinguishing developmental stages I-XII is manually generated (b) by histologist DR in a mouse testicular section (a). The annotated tubule regions (d) and boundaries (e) shown in false-color (f) for (a) were generated based on the result of automated seminiferous tubule segmentation (c) and manual annotation (b) by histologist DR. For stage-identifying criteria see Table 2.
The detailed description on how three datasets were created is presented as follows:
3.1.2. Data set (D1) for seminiferous tubule regions segmentation
Figs. 7(a–d) show the process of generating training samples for seminiferous tubule region segmentation. Firstly, the boundaries of seminiferous tubule regions were manually annotated (Fig. 7(b)). A training set was subsequently built for identifying tubule regions in mouse testis sections based on the boundaries of annotated seminiferous tubule regions. The set includes two types of image patches: tubule and non-tubule patches, whose sizes are 39 × 39 pixels. Each image patch is a context patch which accommodates the local spatial dependencies among central pixel and its neighborhoods. Fig. 7(b) shows, the boundaries of tubules, tubule regions, and background in green, red, and black, respectively. Fig. 7(c) shows that randomly selected red patches whose central pixels are in the tubule region in Fig. 7(b) are tubule patches while green and black patches whose central pixels are on the boundary and background are non-tubule patches. These tubule and non-tubule patches built up the training set (see Fig. 7(d)).
3.1.3. Data set (D2) for types of spermatogenic cells segmentation
We focused on the segmentation of round spermatids (Fig. 8(c)), spermatocytes (Fig. 8(d)), spermatogonia (Fig. 8(e)) and background (Fig. 8(f)) in a cross-sectioned seminiferous tubule. The training set of U-Net was built by manually annotating index maps of three types of cells (Fig. 8(b)). The index map has the same size as the original image. The values of each pixel in different areas in the index map can be represented by category information. For example, the round spermatids are labeled as the first category, and the values of round spermatids in all the index maps are defined as 1. The corresponding training set generation method is shown in Figs. 8 (b–f), there are 4 categories of the entire label map, including round spermatids (green), spermatocytes (brown), spermatogonia (red), and the background (black) being labeled as 1, 2, 3, and 4, respectively.
3.1.4. Data set (D2) for multi-concentric-layers segmentation
The tubules in the training set were manually annotated with region index maps of three regions (Fig. 8(l)). There are 4 categories in the index maps, including the elongated spermatids region (light blue), the round spermatids region (yellow), the spermatogonial & spermatocyte region (brown), and the background (dark blue) being labeled as 1, 2, 3, and 4, respectively.
3.1.5. Data set (D3) for classification of three stage groups and MS tubules
From 12 testis sections, 6 were randomly chosen for training and the rest for testing. Manual annotations (Fig. 11(b)) were generated for each testis section (Fig. 11(a)). Training and testing sets of seminiferous tubules for the three stage groups (ES, MS, and LS) were generated (Fig. 11(c)). The training set comprised 427 ES, 320 MS, and 326 LS tubules (see Fig. 6(a)) from D3 for training while the testing set comprised 515 ES, 399 MS, and 327 LS tubules (see Fig. 6(b)). The numbers of tubules in training and testing sets for different stages were counted and the distribution of tubules across different stages was determined (Fig. 6). Note that the numbers of tubules in different stages across the training and testing sets are dependent on the partitioning of the images into training and testing sets.
Fig. 11.
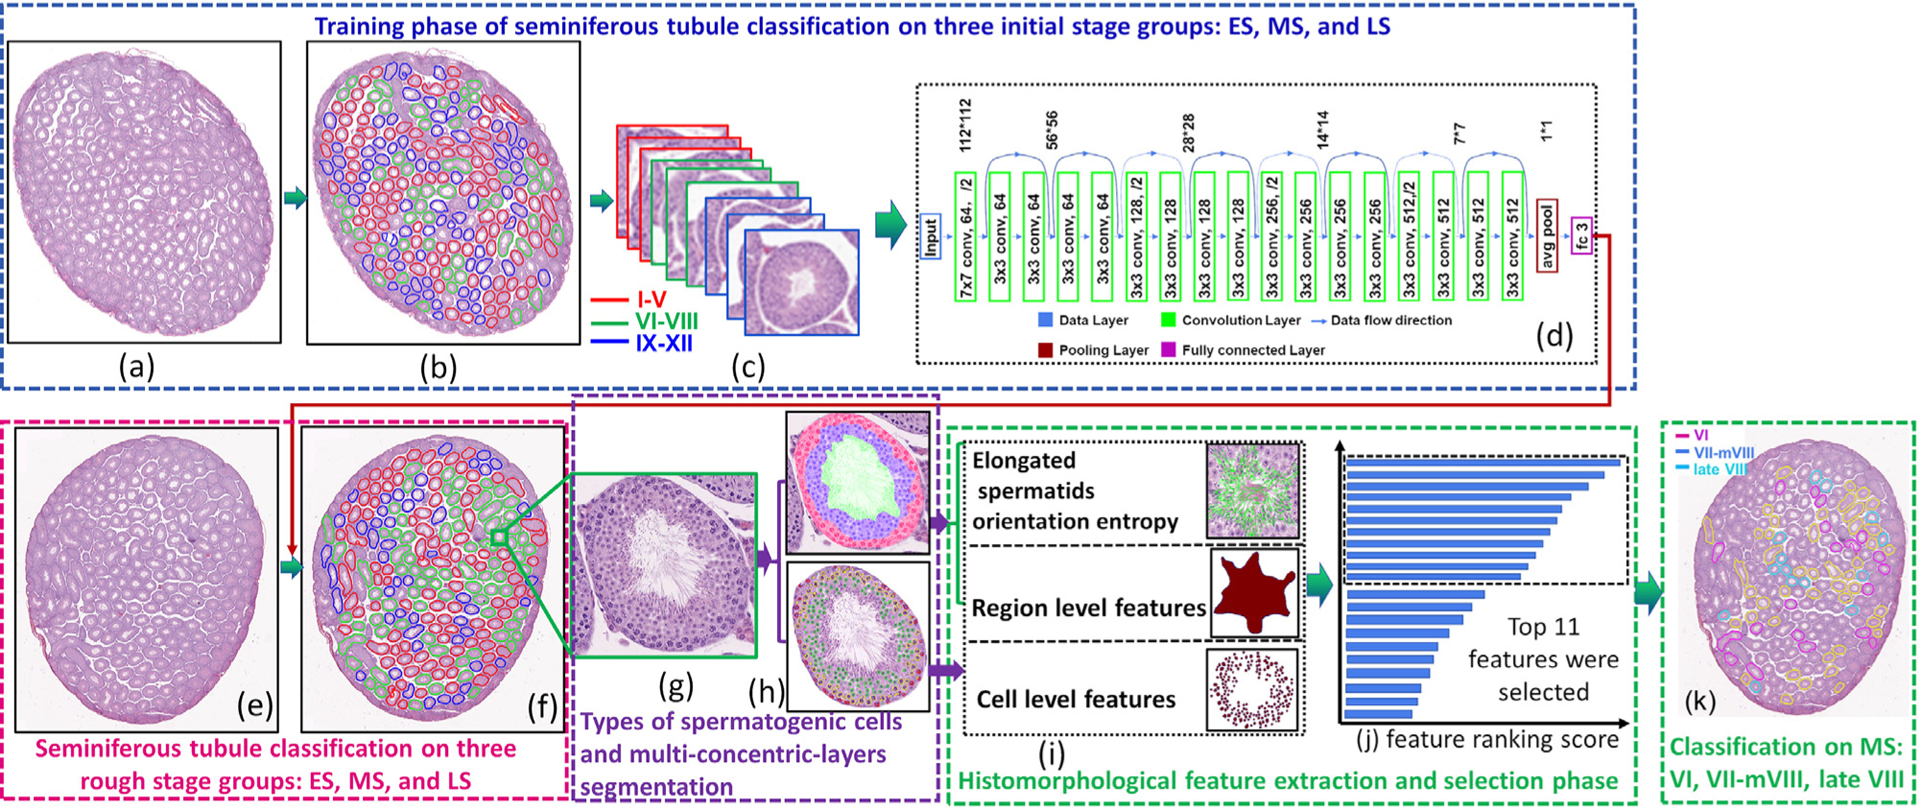
The flowchart of seminiferous tubule classification for Modules 2 and 3. It comprises training (a-d) and seminiferous tubule classification (e-g) phases.
Fig. 6.
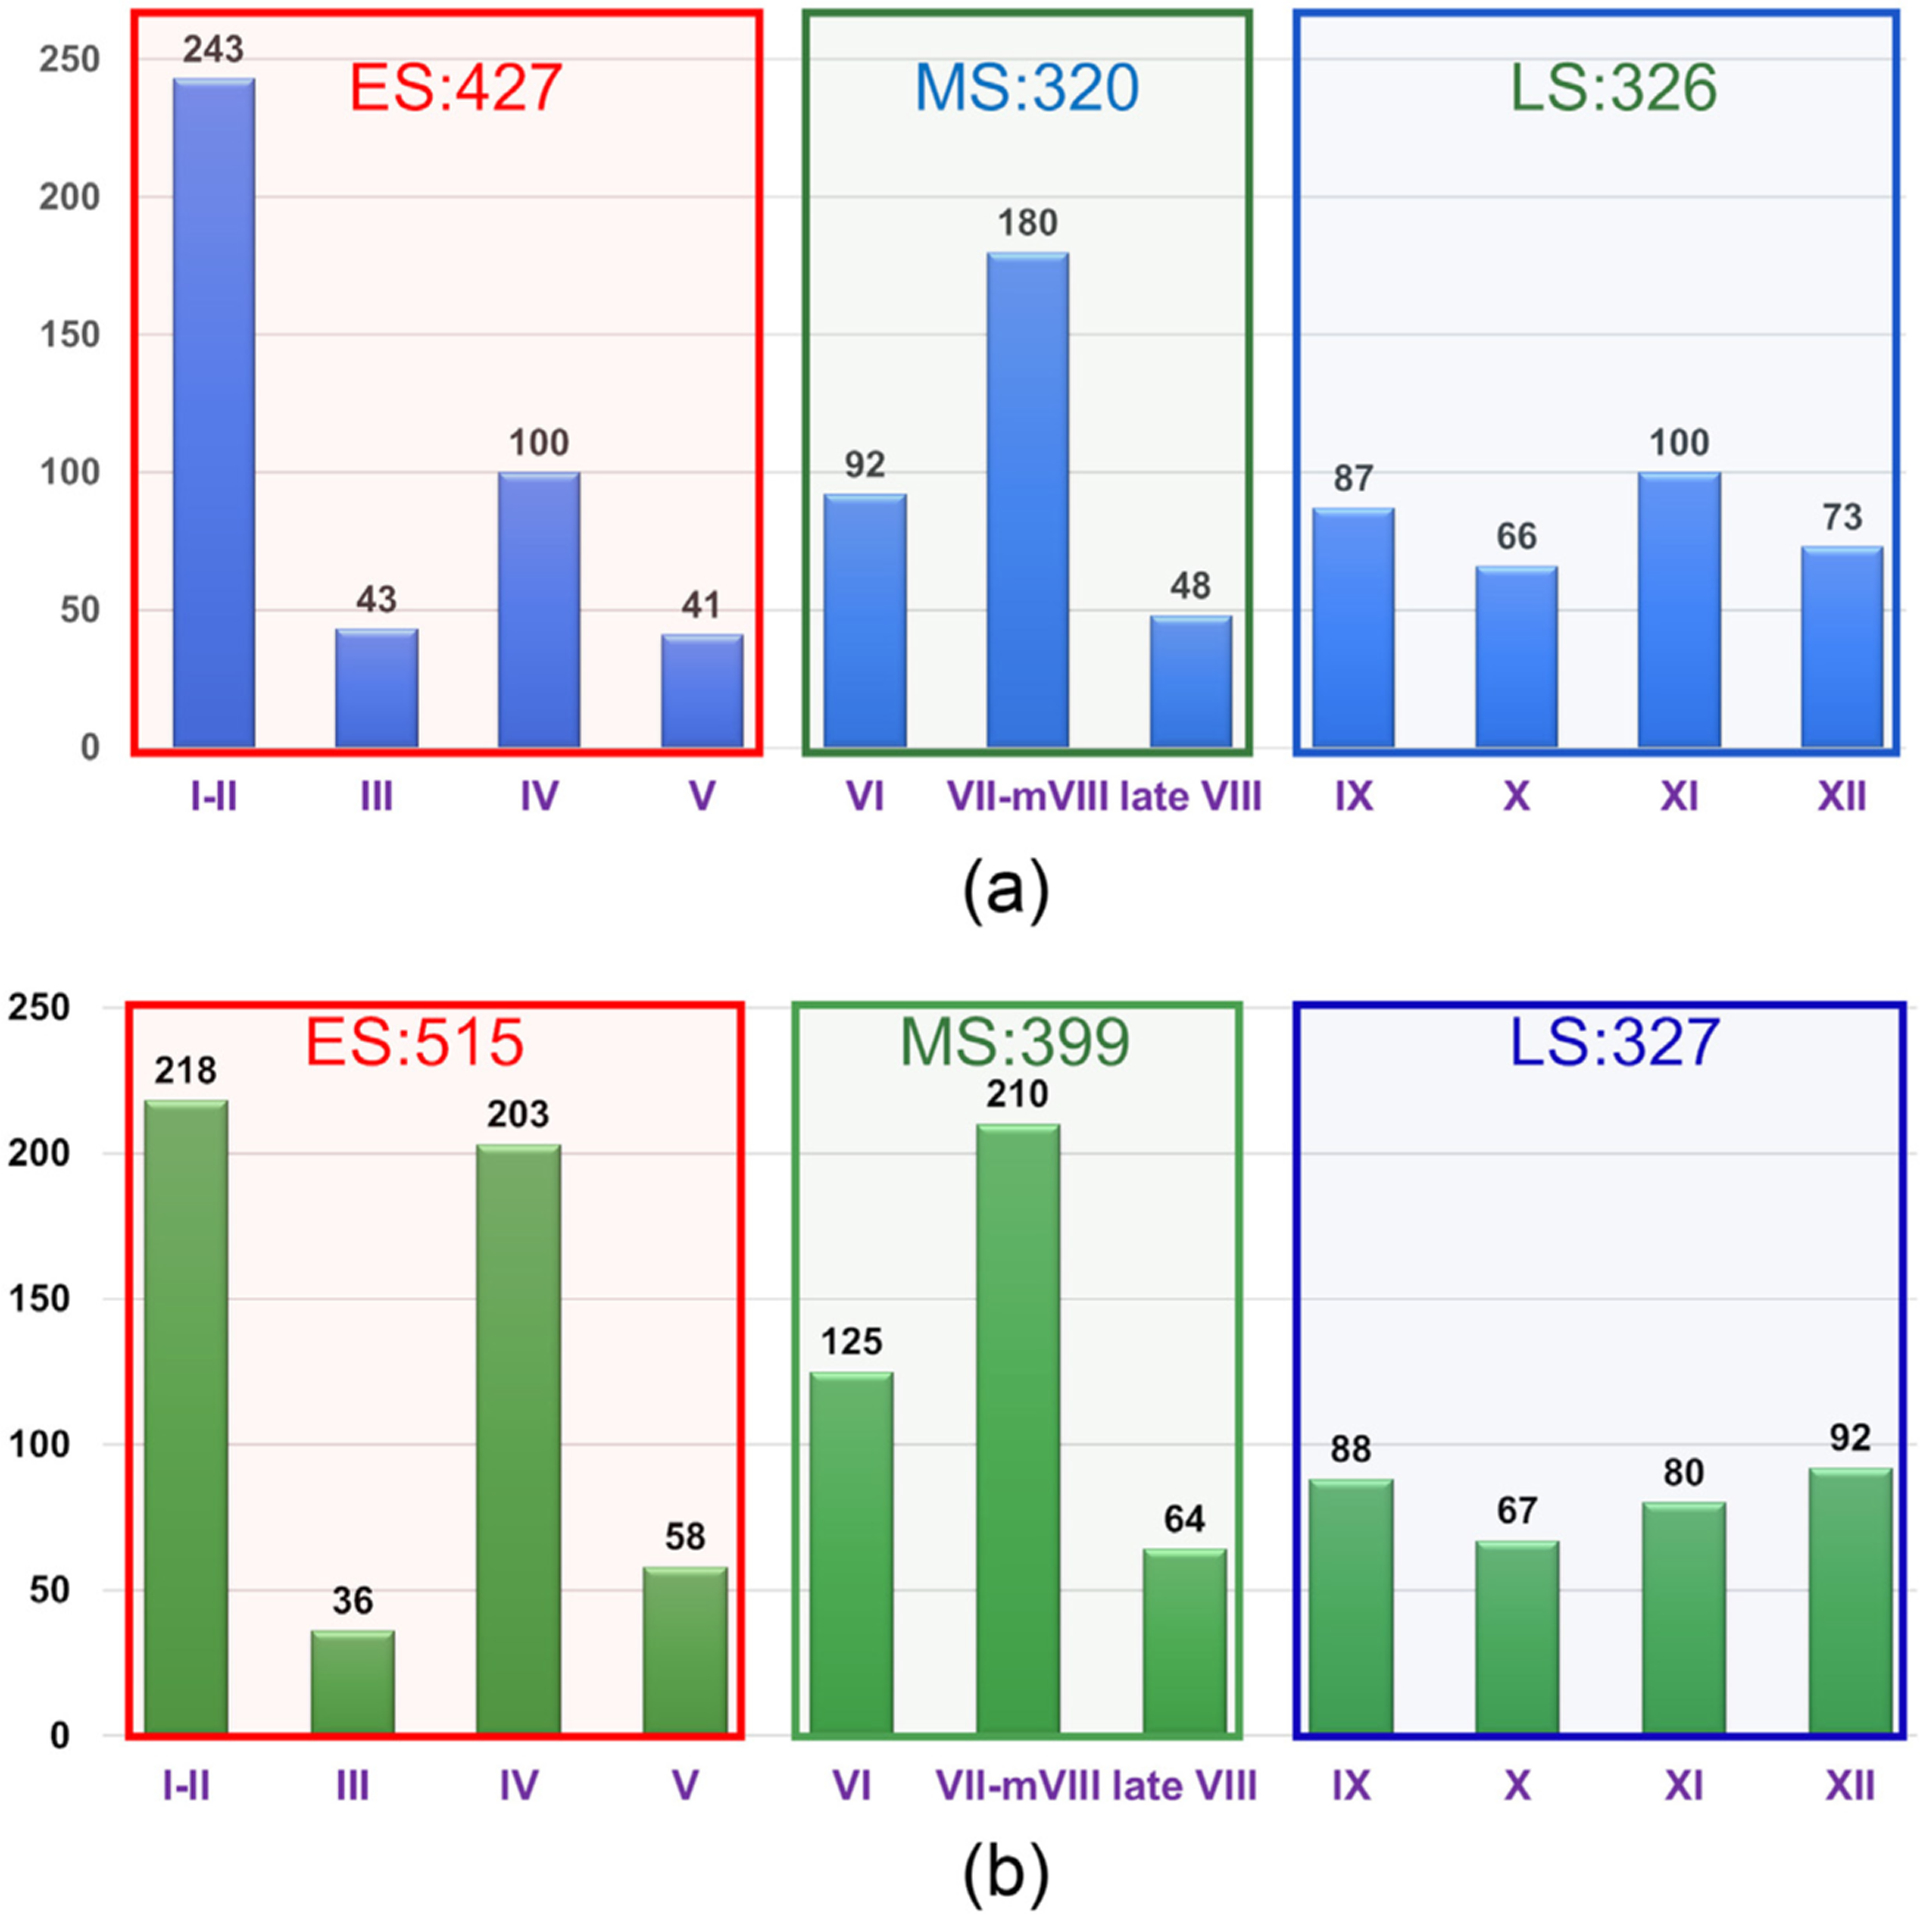
The distribution of tubules in 6 mouse testis sections of (a) training and of (b) 6 testing sets.
3.2. Computerized staging of spermatogenesis (CSS) system
The CSS system has three main modules: 1) Computational image analysis module which comprises: 1a) Tubule region segmentation model, 1b) Types of spermatogenic cells and multiconcentric-layers segmentation model, and 1c) Histomorphological features extraction which includes cell-level and region-level feature extraction; 2) Each seminiferous tubule in a testis section was classified into one of three initial stage groups: ES: I-V, MS: VI-VIII, and LS: IV-XII. As stages VI-VIII in MS are harder to discriminate by histologists, we chose MS for in-depth CSS staging analysis; 3) The seminiferous tubules in MS were further classified into VI, VII-mVIII, and late VIII. The overview of three modules in a mouse testis section is shown in Fig. 5. In this paper, we use “model” to represent the segmentation or feature extraction algorithms while “module” represents independent units that were used to construct the CSS system. Three segmentation models and a feature extraction model comprise the first module which is subsequently utilized in the next two modules.
Fig. 5.
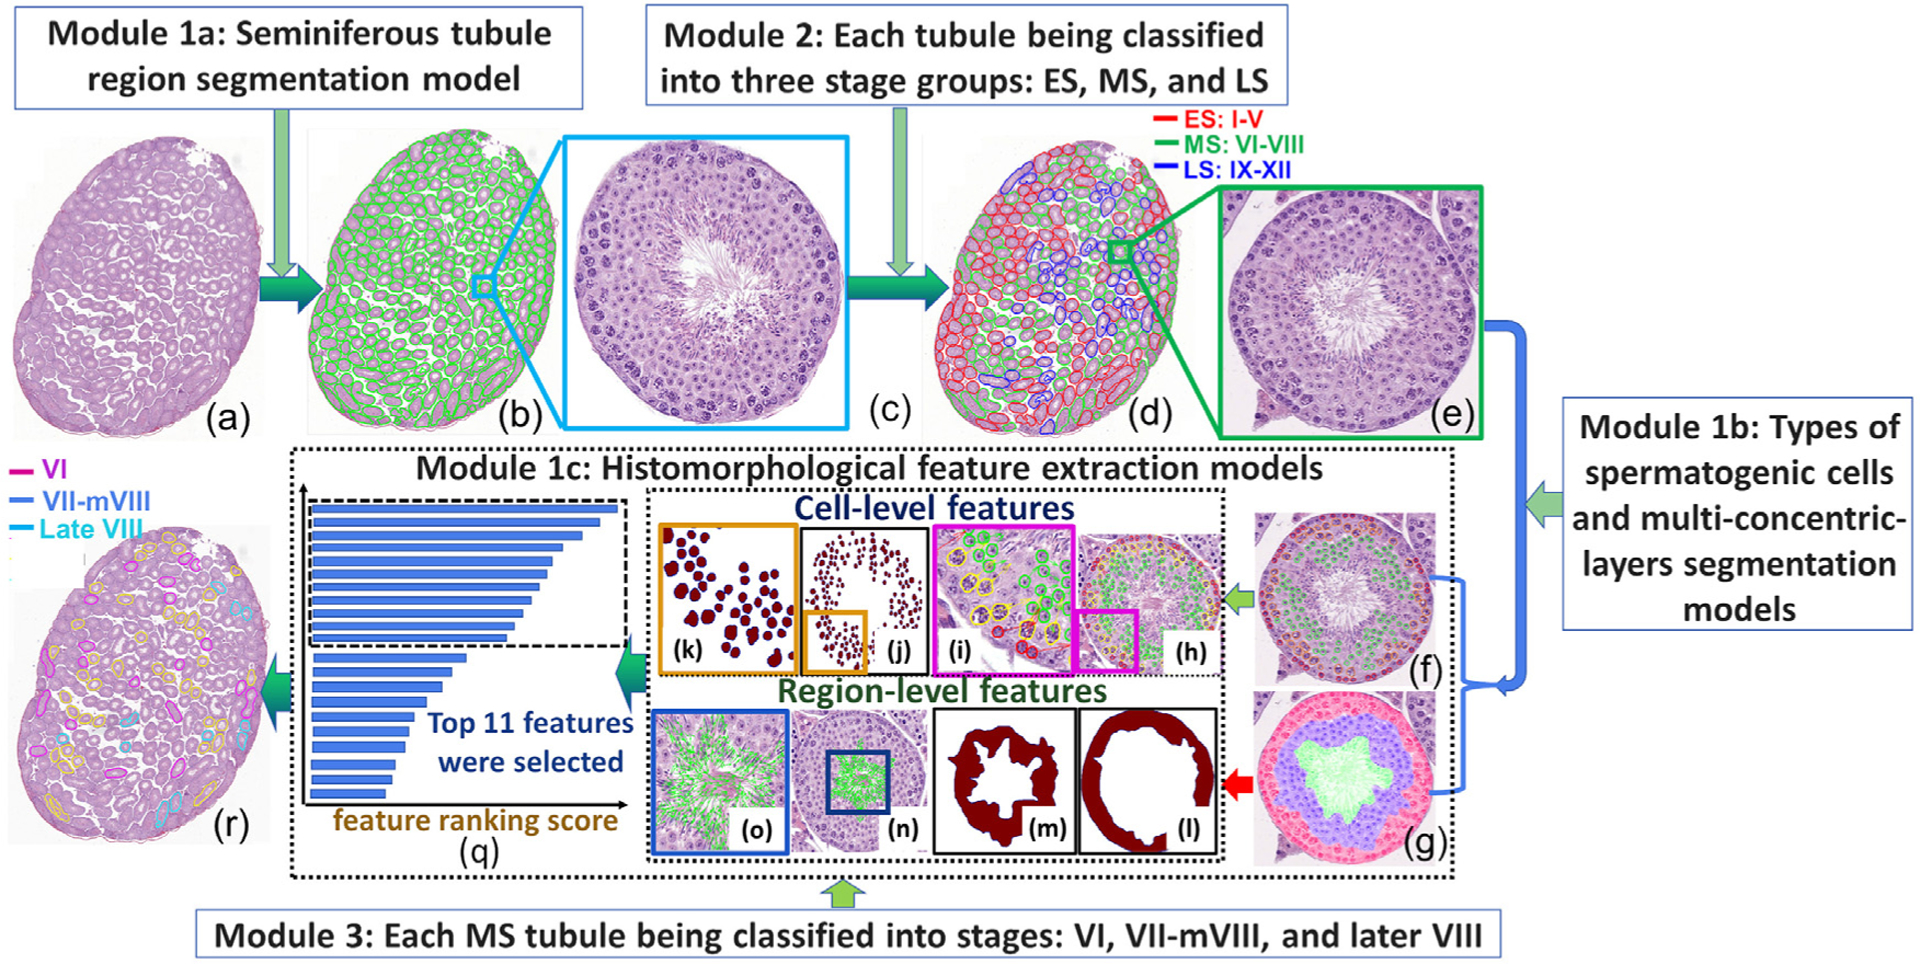
The diagram shows the flowchart of the CSS system with three modules for identifying (d) three initial stage groups and (r) stages VI, VII-mVIII, and late VIII in a mouse testicular section (a).
3.2.1. Computational image analysis module
This module comprises three segmentation models and a histomorphological feature extraction model. Seminiferous tubule segmentation model The aim is to develop a model for seminiferous tubule segmentation in a mouse testis section (Fig. 7). Seminiferous tubule segmentation is the first step in analyzing a mouse testis section. The flowchart for this procedure is shown in Fig. 7. It comprises training (Figs. 7 (a–e)) and seminiferous tubule segmentation phases (Figs. 7 (f–l)). Each mouse testis section was downsampled into 2X magnification (Figs. 7(a,g)) and the seminiferous tubule segmentation procedure was conducted under this magnification based on the lowest resolution to visualize the tubule regions. Different deep convolutional neural networks such as ResNet-50 He and et al. (2016), SE-ReSNet-50 Hu et al. (2018), AlexNet Krizhevsky et al. (2012), and ResNet-18 He and et al. (2016) models were evaluated for this segmentation task. ResNet-18 model was chosen since it is a popular model with fewer layers and more easy to implement. ResNet-18 also resulted in the best performance when compared to the other models.
Spermatogenic cell and multi-concentric-layers segmentation models in stages VI-VIII
As the association of types of spermatogenic cells in multi-concentric-layers at different developmental periods are the key factors to discriminate stages VI-VIII, spermatogenic cells and concentric layers identification and segmentation models are an important step in developing computerized staging system. The U-Net model was used here the architecture of which is shown in Fig. 8(g,m). The implementation of U-Net was based on Ronneberger et al. (2015).
3.2.1.0.1. U-Net for types of spermatogenic-cell segmentation.
The flowchart of the types of spermatogenic cells segmentation comprises training (Fig. 8 (a–g)) and types of spermatogenic cells segmentation phases (Fig. 8 (h–i)). Different from seminiferous tubule segmentation, we focus on round spermatids (see Fig. 8(c)), spermatocytes (Fig. 8(d)), spermatogonia (Fig. 8(e)), and background (Fig. 8(f)) in a cross-sectioned seminiferous tubule. The training set was built from Section 3.1.3.
The boundaries of three spermatogenic cells obtained by the segmentation model were used for subsequent feature extraction.
3.2.1.0.2. U-Net for multi-concentric-layers segmentation.
The flowchart of the multi-concentric-layers segmentation framework comprises training (Fig. 8 (k–m)) and multi-region segmentation phases (Fig. 8(h,j)). The training set of U-Net was built by manually annotating region masks of three regions (Fig. 8(l)). The training set was built from Section 3.1.4. The boundaries of three concentric layers obtained by the segmentation model were used for subsequent feature extraction.
3.2.2. Histomorphological feature extraction model for discriminating stages VI-VIII
Based on types of spermatogenic cells and multi-concentric-layers segmentation results in Section 3.2.1.2, histomorphological features were developed for discriminating stages VI, VII-mVIII, and late VIII. We developed 1) elongated spermatids orientation entropy, 2)cell-level, and 3) region-level features for quantitative representation of seminiferous tubules (Figs. 10).
Fig. 10.
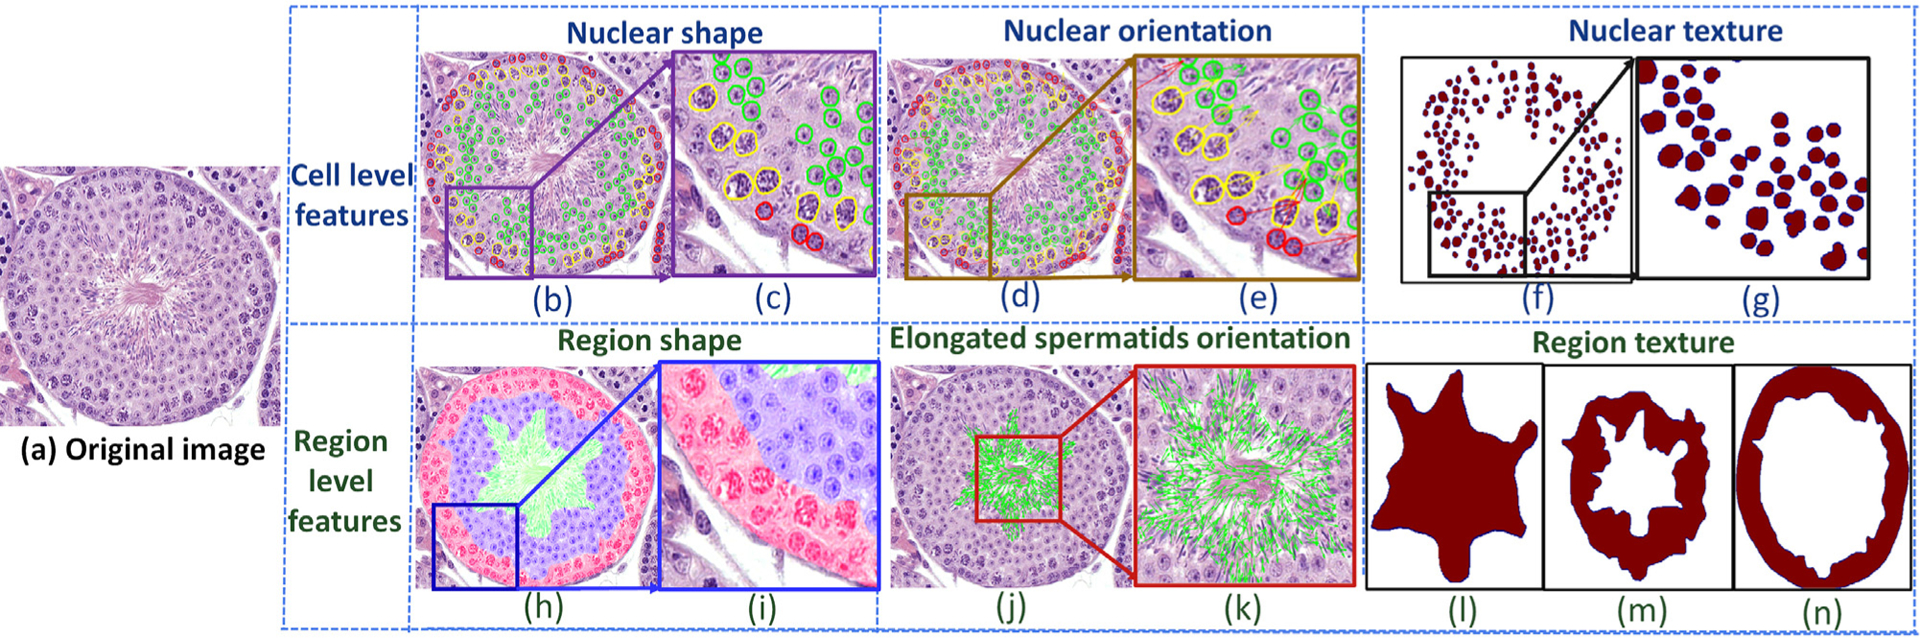
Quantitative histomorphometry feature map illustration of a tubule (a). The first and second rows show cell-level (b-g) and region-level (h-n) features, respectively. Cell-level features comprise nuclear shape (b,c), nuclear orientation (d,e), and nuclear texture (f,g). Region-level features comprise region shape (h,i), elongated spermatids orientation (j,k), and region textures (l,m,n).
3.2.2.0.3. Elongated spermatids orientation entropy (39 descriptors).
Based on the staging-identification criteria, elongated spermatids’ orientation is one of the primary features in discriminating VI, VII-mVIII, and late VIII. We presented a new feature set for describing elongated spermatids orientation entropy. Fig. 9 shows the procedure used to generate the features. The elongated spermatids orientation entropy needs to find the boundary of each elongated spermatid before performing the feature extraction. Therefore, our important premise for the calculation of the entropy of the elongated spermatids is to find a good way to describe the slender boundary (Fig. 9 (a–f)). With the segmentation results of the lumen and elongated spermatid area (Fig. 9(b,c)), a light line Derivative-of-Gaussian (DtG) filter response was employed for elongated spermatids segmentation in order to identify the elongated spermatids in the lumen and elongated spermatid area in the center of a seminiferous tubule (Fig. 9(d)). Then the directionality of each elongated spermatid is determined by performing principal component analysis on the Cartesian coordinate locations on the set of boundary points of each elongated spermatid. Second order statistics are calculated (e.g., contrast energy, entropy) on the orientation of all elongated spermatids within local clusters. A total of 13 second-order elongated spermatid orientation statistics was, thus, obtained for each elongated spermatids and the mean, median, and standard deviation measurements for each of these statistics aggregated across all the elongated spermatid in the lumen and elongated spermatids area of each tubule. These features explore whether elongated spermatids in the three phases of VI, VII-mVIII, and late VIII have different orientation disorder and associated entropy.
Fig. 9.
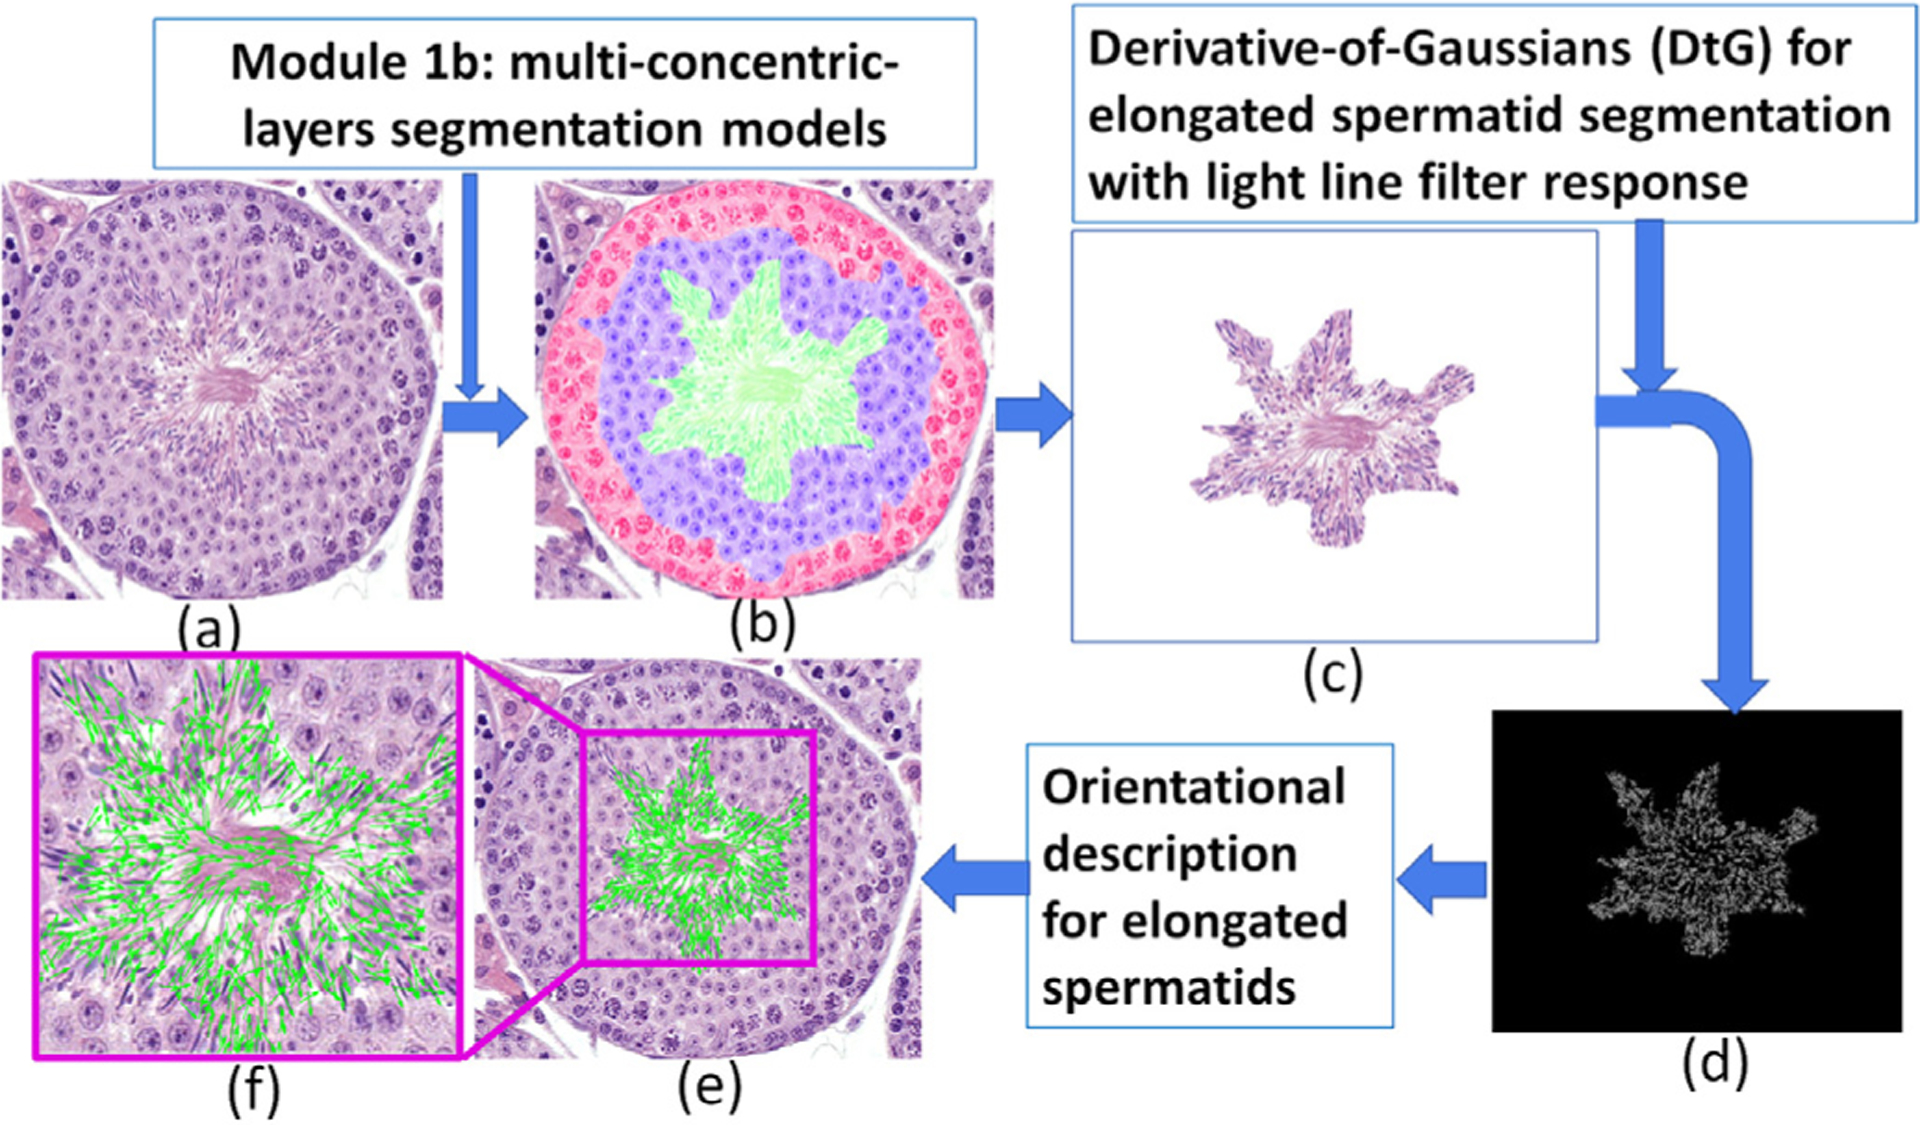
Derivative-of-Gaussian (DtG) with light line filter response for elongated spermatid orientation extraction.
3.2.2.0.4. Cell- and region-level features.
As the association of types of spermatogenic cells in multi-concentric-layers at different developmental periods are the key factors to discriminate stages VI-VIII, cell- and region-level features were developed for quantifying tubules in VI, VII-mVIII, and late VIII stages. Cell- and region-level based feature extraction methods (Fig. 10) were adapted from Wang et al. (2017): 1)cell-level features in this paper include: nuclear shape features (100 descriptors), nuclei orientation entropy (39 descriptors), nuclei texture (39 descriptors). 2) region-level features include region shape features (100 descriptors); region texture (39 descriptors).
3.3. Automated classifier building for classification of a seminiferous tubule into one of three stage groups: ES, MS, and LS
Our strategy is to classify each seminiferous tubule into one of three initial stage groups: ES, MS, and LS in a testis section image with a deep learning based model. As we had enough annotated tubules for three stage groups, we employed ResNet (He and et al., 2016) for seminiferous tubules classification. Figs. 11 (a–f) show the procedure for classifying a seminiferous tubule section into one of three stage groups: ES, MS, and LS with a ResNet. The architecture of ResNet is shown in Fig. 11(d).
3.4. Feature selection and classifier building for classification of MS tubules into stages VI, VII-mVIII, and late VIII
Seminiferous tubules that had been classified as MS were subsequently classified into stages VI, VII-mVIII, and late VIII. Based on the segmentation results on types of spermatogenic cells and multi-concentric-layer, cell- and region-level features and elongated spermatid orientation entropy features for each tubule were obtained with the feature extraction model developed in Section 3.2.2 (Fig. 11(i)). A total of 790-dimensional feature sets for each tubule were developed based on the histomorphological feature extraction model in Section 3.2.2. Then, we adopted Minimum Redundancy Maximum Relevance (mRMR) algorithm (Hanchuan Peng et al., 2005) and used 100 times 3-fold cross-validation to select the top 11 features with the highest frequency of occurrence from the feature sets as the final high discriminative features (see Fig. 11(j)). Table 3 shows the top 11 features selected by the mRMR algorithm.
Table 3.
A subset of 11 features selected from entire feature set.
| Feature type and category | Ranking | Description | |
|---|---|---|---|
| Spermatognial texture | 6 | Haralick:standard deviation of nuclear pixel intensity variance | |
| Spermatognial texture | 7 | Haralick:standard deviation of nuclear pixel intensity entropy | |
| Spermatognial texture | 8 | Haralick:standard deviation of nuclear pixel intensity contrast entropy inverse | |
| Cell-and region-level features | Elongated spermatids texture | 1 | Haralick:mode of region pixel intensity contrast variance |
| Elongated spermatids texture | 2 | Haralick:mean of region pixel intensity contrast entropy inverse | |
| Elongated spermatids texture | 3 | Haralick:standard deviation of region pixel intensity contrast entropy inverse | |
| Elongated spermatids texture | 4 | Haralick:mean of region pixel intensity contrast entropy | |
| Elongated spermatids texture | 5 | Haralick:standard deviation of region pixel intensity variance | |
| Elongated spermatids orientation entropy | Elongated spermatids orientation | 9 | Orientation Entropy:mean of elongated spermatids tensor entropy |
| Elongated spermatids orientation | 10 | Orientation Entropy:standard deviation of elongated spermatids tensor contrast entropy | |
| Elongated spermatids orientation | 11 | Orientation Entropy:standard deviation of elongated spermatids tensor contrast ave. |
While carrying out the feature selection, five different machine learning classifier, Linear Discriminant Analysis (LDA), Quadratic Discriminant Analysis (QDA), Support Vector Machine (SVM), Random Forest (RF), and Softmax regression combined with the top 11 features of different types of cell and regions are validated in the model set. Based on confusion matrix, the mRMR-Softmax is the best combination according to the classification accuracy of distinguishing stages VI, VII-mVIII, and late VIII. The entire process of CSS system is shown in Fig. 5.
4. Experimental designs and comparison strategies
To show the effectiveness of the CSS system, 6 experiments were designed.
4.1. Experiment 1: The CSS system for seminiferous tubule segmentation
The aim of this experiment is to show the effectiveness of the CSS system for tubule segmentation in testis sections in Module 1a. As Section 3.2.1 showed, the ResNet based model was leveraged for seminiferous tubule segmentation. The segmentation process includes training and testing phases, which can be described as follows:
4.1.1. Training phase
With the training set built in the previous section, a ResNet 18 model (He and et al., 2016) was trained with the training patches in the training set. The trained ResNet 18 model was then employed for seminiferous tubule segmentation (Fig. 7 (f–l)). The architecture of the ResNet-18 model is shown in Fig. 7(e). The network ends with a global average pooling layer and a 2-way fully-connected layer with softmax. The detailed description of the ResNet-18 can be found in He and et al. (2016).
4.1.2. Testing phase
The pixel-wise segmentation scheme (Fig. 7 (g–l)) was leveraged to tubule regions’ segmentation. Firstly, the trained ResNet and a sliding window scheme were integrated to choose the context image patches from Fig. 7(g). The window slides across the entire image row by row from upper left corner to the lower right with a step size of 1 pixel. Border padding is employed to address issues of boundary artifacts. The pixel-wise segmentation was achieved (Fig. 7(i)) by predicting the class probabilities of the central pixel of each context patch chosen by sliding window scheme. The segmentation results were then upsampled back into the original image size via bilinear interpolation (Fig. 7 (j–l)).
As the tubule segmentation is a relatively new problem, there are few approaches to compare with. Consequently, we compared the performance of our approach against two automated nuclear segmentation approaches: gLoG (Xu et al., 2016a) and CoNNACaeF (Xu et al., 2019a) for detecting and segmenting elliptic-like objects in histological images. The number of training and testing testis sections are shown in Table 4. The segmentation accuracy was determined in terms of segmentation accuracy in pixel-level as compared to manual annotation of tubule regions (Fig. 7(b)). Four quantitative measurements (Long et al., 2015): pixel accuracy, mean accuracy, mean IU, frequency weight IU were used.
Table 4.
The illustration of datasets studied in the paper and corresponding quantitative evaluation results for three segmentation results in Modules 1a and 1b with the CSS system.
| Segmentation | Datasets | Total | Patches | Models | Training Set | Testing Set | ||||
|---|---|---|---|---|---|---|---|---|---|---|
| # of patches | ||||||||||
| # of images | model set | validation set | Classification accuracy | # of images | Pixel accuracy | |||||
| Tubule | D1 | 28 | Tubule | ResNet-18 He and et al. (2016) | 14 | 105,072 | 23,459 | 96.25% | 14 | 93.84% |
| background | 103,790 | 20,723 | ||||||||
| Types of spermatogenic cells | D2 | 343 | round spermatid | U-Net | 172 | - | - | - | 171 | 92.95% |
| Ronneberger et al. (2015) | ||||||||||
| Multi-concentric-layers | Spermatocyte spermatogonia background elongated spermatids layer round spermatids layer spermatogonia & spermatocytes layer | 91.08% | ||||||||
4.2. Experiment 2: The CSS system for types of spermatogenic cells and multi-concentric-layer segmentation
The aim of this experiment is to show the effectiveness of the CSS for types of spermatogenic cells and multi-concentric-layers segmentation in MS tubules in Module 1b. Figs. 8 show the flowchart of types of spermatogenic cells and multi-concentric-layers segmentation in a tubule. The types of spermatogenic cells and multi-concentric-layer were segmented with the segmentation models developed in Section 3.2.1 (Fig. 8(i,j)). For region segmentation, we augmented the images horizontally, vertically, and rotated it every 90 degrees, which subsequently expanded D2 to six times in size. Meanwhile, we adopted transfer learning methods using the model parameters which had already been trained in (Ronneberger et al., 2015) as initialization parameters for the U-net model.
The number of training and testing tubules is shown in Table 4. The accuracy of segmentation results was determined in pixel-level as compared to manual annotation index map of types of spermatogenic cells and multi-concentric-layers in tubules.
4.3. Experiment 3: The CSS system for classification of each seminiferous tubule in a testis section into one of three initial stage groups: ES, MS, and LS
The aim of this experiment is to show the effectiveness of CSS system in discriminating three initial stage groups: ES, MS, and LS in testis sections in Module 2. The performance is shown by comparing the manual annotations by histologist DR in terms of classification accuracy across 6 testicular sections.
The seminiferous tubule segmentation model developed in Section 3.2.1 was first applied to all testis section images in both training and testing sets for identifying tubule regions (Fig. 5 (a–b)). Then a ResNet was leveraged to seminiferous tubule classification. The flowchart of Module 2 is shown in Figs. 11 (a–f). The classification procedure includes training and testing phases:
4.3.1. Training phase
The input image size to ResNet is 3 × 224 × 224. Firstly, we resized the original image of each seminiferous tubule to 3 × 500 × 500 (Figs. 11(c)). Then we introduced a crop cutting method to train the ResNet. The crop cutting method can effectively utilize the features in the central area of tubules, which is the key factor in discriminating three initial stage groups. During the training, the cropped images in the training set were augmented via horizontally flipped, vertically flipped, and rotated every 90°, so that the size of the training set was expanded to 6 times. The cropped images were then fed to the ResNet for training (Fig. 11(d)).
4.3.2. Testing phase
6 testis sections in the testing set comprise 515 ES, 399 MS, and 327 LS tubules. The distribution of tubules in different stages is shown in Fig. 6(b). In the testing phase, a similar crop cutting procedure was applied for each seminiferous tubule in the testicular section before feeding to the trained ResNet for prediction. Each tubule in the testis section was then sent to the trained ResNet for classification. Figs. 11 (e–f) show the flowchart on how the seminiferous tubules in a mouse testis section (Figs. 11(e)) were classified into one of three stage groups: ES, MS, and LS (Figs. 11(e)).
4.4. Experiment 4: The CSS system for classification of MS tubules into stages VI, VII-mVIII, late VIII
The aim of this experiment is to show the effectiveness of the CSS system in discriminating stages VI, VII-mVIII and late VIII in testis sections in Module 3. The performance is shown by comparing with the manual annotations in terms of classification accuracy across 6 testis sections. The flowchart of Module 3 is shown in Figs. 11 (f–k).
For all the tubules in the MS stage (Fig. 11 (f–g)), the types of spermatogenic cells and multi-concentric-layers were segmented with the segmentation models in Module 1b (Fig. 11 (g–h)). Then based on the segmentation results, elongated spermatids orientation entropy, region-level and cell-level features were extracted with histomorphological feature extraction models in Module 1c (Fig. 11 (h–i)). The 11 significant features were subsequently chosen via mRMR algorithm (see Fig. 11 (i–j)). Finally, the 11 features of a tubule were fed to a classifier for being identified as one of stages VI, VII-mVIII, late VIII (see Fig. 11 (j–k)).
4.5. Experiment 5: Comparison of CSS system VS a human histologist in classification of each seminiferous tubule into one of three stage groups: ES, MS, and LS as well as MS tubules into stages VI, VII-mVIII, late VIII in 6 mouse testis sections
The aim of this experiment is to compare the CSS system with two human histologists on 6 testis sections in terms of the performance with respect to discriminating developmental stages of each seminiferous tubule into one of three stage groups: ES, MS, and LS as well as MS tubules into stages VI, VII-mVIII, late VIII in 6 mouse testis sections. We compare the developmental stage results between the histologists HL and the CSS system in terms of time and accuracy for 6 testis sections.
4.6. Experiment 6: Comparison of CSS system VS a ResNet based model in classification of MS tubules into stages VI, VII-mVIII, late VIII
The aim of this experiment is to show the effectiveness of the Module 1c: histomorphological features of the CSS system in classification of stages VI, VII-mVIII, and late VIII as compared to a ResNet based model in terms of classification accuracy across 6 testis sections. During the implementation of the ResNet based model in classification of MS tubule into stages VI, VII-mVIII, late VIII, we replaced two components: 1) types of spermatogenic cells and multi-concentric-layers segmentation, and 2) feature extraction and selection (Figs. 11 (h–j)) with a ResNet in the flowchart of Fig. 11.
5. Experimental results and discussion
5.1. The segmentation accuracy of seminiferous tubules by module 1a in CSS system
The qualitative segmentation results of seminiferous tubules obtained by the CSS system in a mouse testis section (Fig. 12(a)) are shown in Fig. 12(d). The segmentation results of gLoG Xu et al. (2016a) and CoNNACaeF Xu et al. (2019a) are shown in Figs. 12(b) and (c), respectively. In these images, the green curves represent the segmentation results by the different models. The quantitative segmentation results of the CSS system, gLoG, and CoNNACaeF across 14 mouse testis sections are shown in Table 5. Both qualitative and segmentation results obtained by the CSS system appeared to be the best performance. For quantitative segmentation results, CSS achieves the best results in terms of an average pixel accuracy of 93.84%, mean accuracy of 91.20%, mean IU of 86.58%, and frequency weighted IU of 88.60% across 14 mouse testis sections. The results suggest that the proposed model outperforms the two other models. Overall, the CSS system yielded reasonable results in terms of segmentation of tubule regions in a mouse testis section.
Fig. 12.
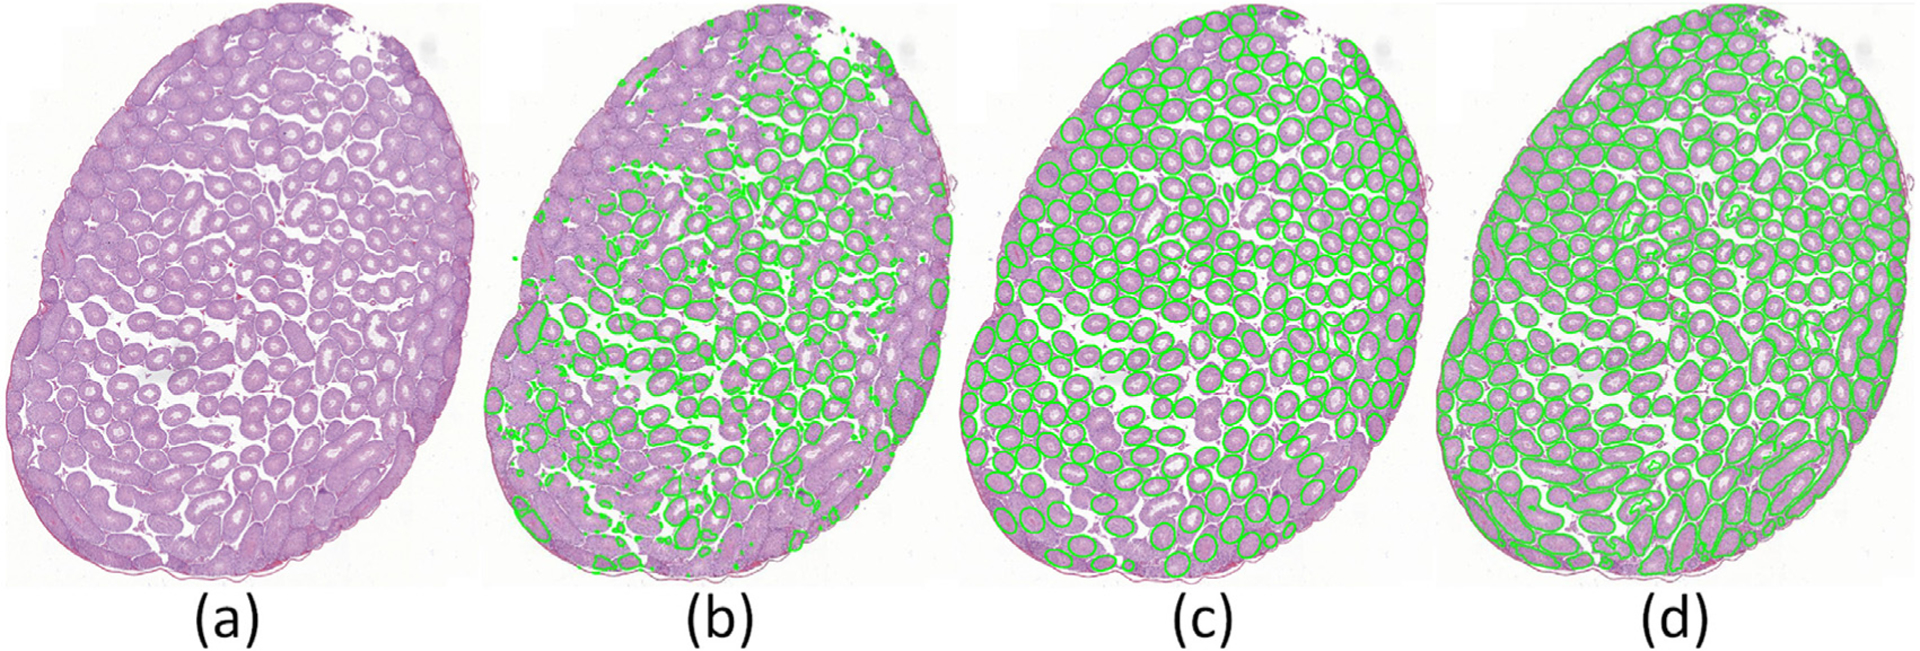
Illustration of the tubule region segmentation in a mouse testis section (a) by gLoG Xu et al. (2016a) (b), CoNNACaeF Xu et al. (2019a) (c), and the model presented in this paper (d).
Table 5.
Quantitative results of proposed and compared models in tubule segmentation on D1 in Module 1a. The accuracy shown in the table reflects the average values across all the testing samples. A bold typeface represents the best performance in the table.
| ~ | Proposed CSS system | gLoG Xu et al. (2016a) | CoNNACaeF Xu et al. (2019a) |
|---|---|---|---|
| Pixel accuracy | 93.84% | 56.54% | 85.28% |
| Mean accuracy | 91.20% | 43.82% | 83.59% |
| Mean IU | 86.58% | 33.60% | 72.73% |
| Frequency weight IU | 88.60% | 42.46% | 74.36% |
5.2. The segmentation accuracy of types of spermatogenic cells and multi-concentric-layers by module 1b of the CSS system
The quantitative segmentation results of types of spermatogenic cells and multi-concentric-layers are shown in Table 4. For types of spermatogenic cells segmentation, the CSS system achieved a segmentation accuracy of 92.95% (Table 4) in the test set. The pixel-wise accuracy of the U-Net model for multi-concentric-layer segmentation on the test set was 91.08% (Table 4). Overall, the CSS system yields good results in terms of segmentation of types of spermatogenic cells and multi-concentric-layers in a tubule.
5.3. The classification accuracy on developmental stages by modules 2 and 3 of the CSS system and a human histologist on 6 mouse testis sections
To demonstrate the effectiveness of the CSS system’s Modules 2 and 3, qualitative and quantitative classification results on mouse testis sections are shown in Fig. 13. The qualitative classification results on 5 other mouse testicular sections are shown in the supplementary materials. The results show the performances of two modules. 1)Module 2: classification of the tubules into 3 initial stage groups: ES, MS, and LS by the CSS system (Figs. 13(b,c)) and by histologists HL (Figs. 13(d,e)) and DR (Figs. 13(a)). In these cross-sections, tubules delineated with red, green, and blue curves represent ES, MS, and LS, respectively. 2)Module 3: the MS tubules were classified into stages VI, VII-mVIII, and late VIII by the CSS system (Figs. 13(g,h)), histologist HL (see Figs. 13(i,j)), and ResNet model (Figs. 13(k,l)) and DR (see Figs. 13(f)) (by histologist DR). In these testis sections, tubules delineated with purple, orange, and light blue curves represent stages VI, VII-mVIII, and late VIII, respectively. Qualitative classification results are shown in Figs. 13(b,d,g,i,k) where the tubules marked with sign “x” in the center represent a difference of opinion between the CSS system or histologist HL and DR. For quantitative classification results, confusion matrices (Figs. 13(c,e,h,j,l)) were employed to show the classification accuracy of each stage type and the error rate of the stage types being classified into others. All of confusion matrices Figs. 13(e,j,l) present in the same fashion as Figs. 13(c,h), respectively. The rows of the matrix represents predicted stages by the CSS system (see Figs. 13(c,h)), histologist HL (see Figs. 13(e,j)), and a ResNet (see Figs. 13(l)) on Modules 2 and 3, respectively, while the columns of the matrix represent actual stages annotated by DR. In confusion matrices, the number of tubules being classified into relevant stages are shown in parentheses. In these matrices, the diagonal elements in red represent the best accuracy in each type of developmental stage. Overall, these results suggest that the CSS system yields better results in terms of classification accuracy of tubules’ developmental stages as compared with histologist HL. With respect to tubules in stages I-XII, histologists DR and HL showed comparable results in discriminating three-stage groups: ES, MS, and LS. However, there was more variation between results by both histologists in discriminating MS into VI, VII-mVIII, and VIII stages. Especially, it appears it is hard to discriminate the tubules in stage VI but also the other stages in this group. This result is correlated with the real scene. The development of the stages is slow and differences are gradual. Therefore, different histologists will have slightly different opinions about, for example, when to call a tubule in stage VI or in VII. As the opinion of histologist DR was taken as the basis for CSS to distinguish stages, it is no wonder that the results of CSS were more like those of DR than of HL. Figs. 14 shows the mean and standard deviation of CSS (Figs. 14(a,c)) and human histologist HL (Figs. 14(b,d)) in discriminating ES, MS, and LS (Figs. 14(a,b)) and stages V, VII-mVIII, and VIII (Figs. 14(c,d,e)) across 6 testis sections. Indeed, the statistical results show that the CSS system results are more in line with those obtained by DR than by HL. All of confusion matrices in Figs. 14(b,d,e) are presented in the same format as the ones in Figs. 14(a,c), respectively. The rows of the matrix represent the stages predicted by the CSS classifier (Figs. 14(a,c)), histologist HL (see Figs. 14(b,d)), and a ResNet (see Figs. 13(e)) on Modules 2 and 3, respectively, while the columns of the matrix represent stages annotated by DR. In the confusion matrices, the number of tubules being classified into relevant stages are shown in parentheses. Developmental staging by human histologists is a time-consuming and tedious work. As Table 7 shows, it takes an average of 3 hours for both histologists to finish evaluating a testicular section while the trained CSS system on average needs 1.87 hours.
Fig. 13.
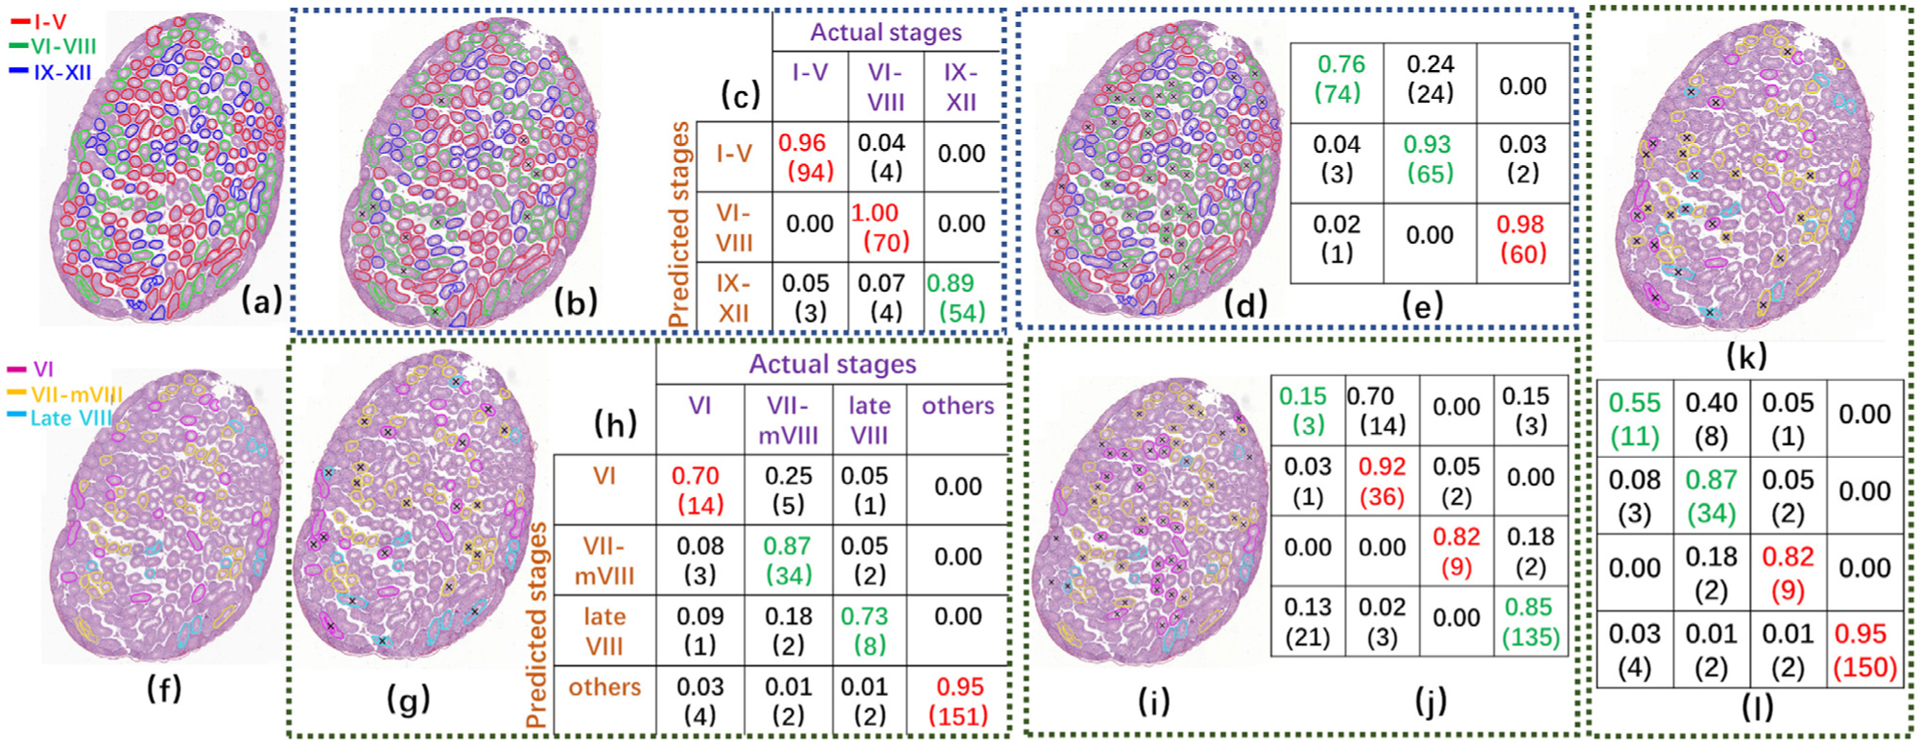
Qualitative and quantitative results on a mouse testis section for classification of 1)tubules into 3 initial stage groups: ES, MS, and LS by CSS system (b,c) and histologist HL (d,e) compared to the basis (a) by histologist DR where tubules delineated with red, green, and blue curves represent tubules in ES, MS, and LS, respectively, and 2) MS tubules into stages VI, VII-mVIII, and late VIII by the CSS system (g,h), histologist HL (i,j), and ResNet model (k,l) compared to the basis (f) by histologist DR where tubules delineated with purple, orange, and light blue curves represent tubules in stages VI, VII-mVIII, and late VIII, respectively. Qualitative classification results are shown in (b,d,g,i,k) where the tubules marked with sign “x” represent a different classification compared to the basis. The quantitative results are shown in confusion matrices (c,e,h,j,l) where each row of the matrix represents stages predicted by the CSS classifier(c,h), histologist HL (e,j), and a ResNet (l) classifier for the prediction of the developmental stages, respectively, while each column represents the instances stages annotated by histologist DR. The numbers in parentheses are the number of tubules being classified into relevant stages.
Fig. 14.
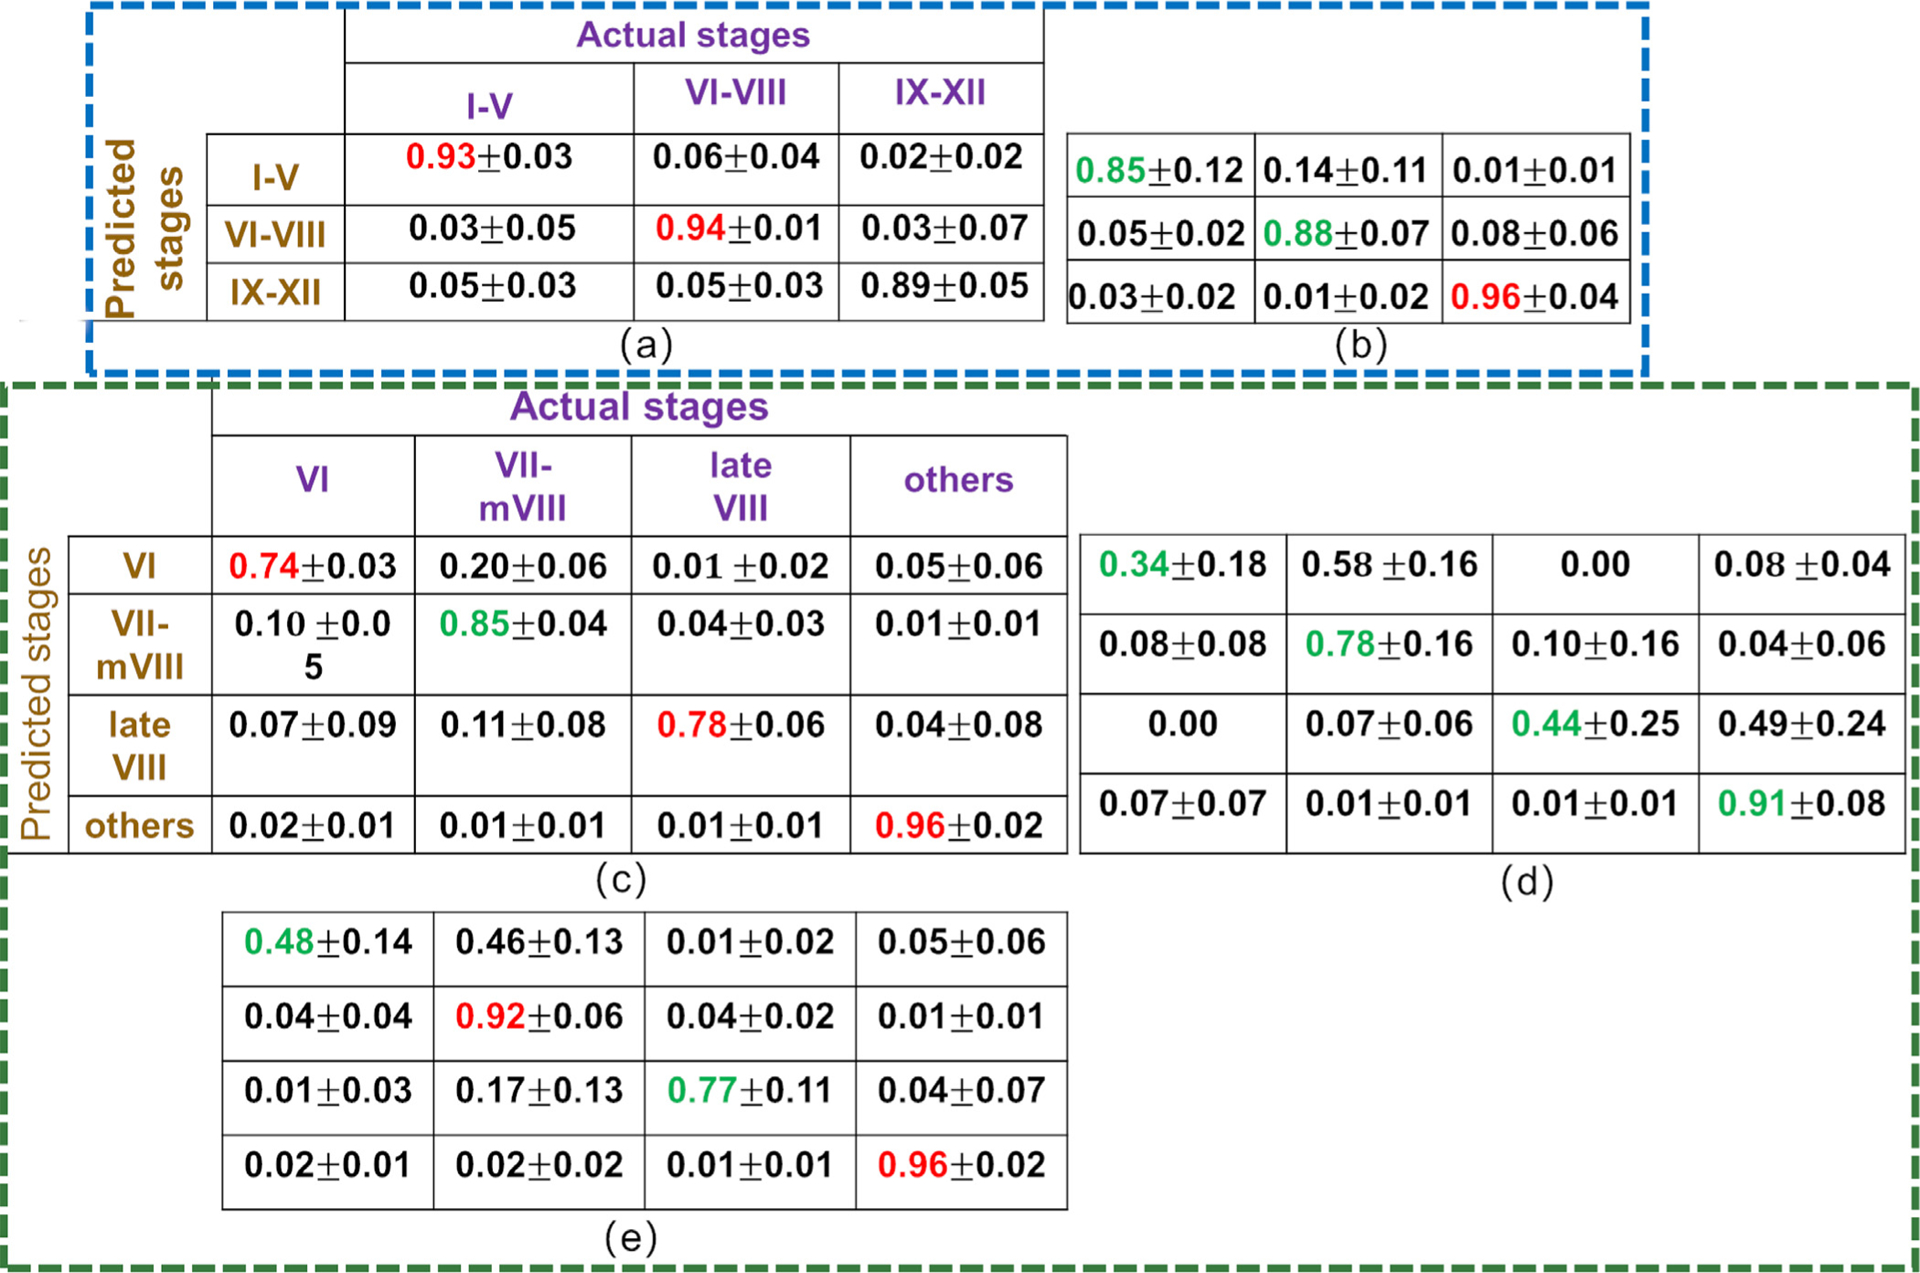
The mean and standard deviation of CSS (a,c) and human histologist (b,d) in discriminating ES, MS, and LS (a,b) and stages V, VII-mVIII, and VIII (c,d) across 6 mouse testis sections. (e) is the mean and standard deviation of Resnet in classifying stages V, VII-mVIII, and VIII across 6 mouse testis sections. In confusion matrices (a,b,c,d,e), each row of the matrix represents stages predicted by the CSS classifier(a,c), histologist HL (b,d), and a ResNet (e) classifier for the prediction of the developmental stages, respectively, while each column represents the instances stages annotated by histologist DR.
Table 7.
The execution time of CSS on the training and corresponding run time when evaluated a testis section as comparing with a human histologist.
| ~ | Components | Modules | Training Time (6 sections) | Testing Time (per section) |
|---|---|---|---|---|
| CSS | Tubule segmentation | Module 1a | 2 hours with 50 epoch | 9 minutes per section |
| Types of spermatogenic cells segmentation | Module 1b | 8 hours with 50 epoch | 0.36 second per 1 tubule | |
| Multi-concentric-layers segmentation | 8 hours with 50 epoch | 0.36 second per 1 tubule | ||
| Feature extraction | Module 1c | 12 hours with 6 sections | 20 seconds per tubule | |
| Total time in evaluating a section | Modules 2 and 3 | 30 hours | 1.87 h per section | |
| Human histologist | Many years | ≈ 3 hours per section |
In the classification of stages VI, VII-mVIII, and late VIII, the CSS system leveraged histomorphological features developed in Section 3.2.1. In comparison with the ResNet based model (Figs. 13(k,l)), the CSS system (Figs. 13(g,h)) performed better in terms of classification accuracy across 6 testis sections. The statistical results show that the CSS system (c) outperforms ResNet (e) in overall accuracy across 6 cross-sections. The histomorphological features developed in Section 3.2.1 included 11 features, as shown in Table 3. The table shows the feature type and the feature categories identified by the mRMR algorithm, which also ranks their importance among top 11 features in discriminating the tubules in stages VI-VIII. The interesting finding is that the significant histomorphological features chosen by the CSS system were spermatogonial textures, elongated spermatids orientation, and spermatids textures, which are the primary features of staging-identifying criteria in discriminating stages VI, VII-mVIII, and late VIII.
5.4. Computational environment
All the experiments were carried out on a PC(IntelCore(TM) I7–6800k 4.0 GHz processor with 32GB of RAM & 256g SSD) and a Titan 1080Ti NVIDIA Graphics Processor Unit. We compared the computational efficiency of CSS against a human histologist in developmental staging of a mouse testis section. The execution time for CSS and human histologist on a cross-section is shown in Table 7. It shows that, once the CSS system was trained, it was more efficient in evaluating a testicular section compared to human histologists in terms of run time execution.
6. Concluding remarks
In this paper, a Computerized Spermatogenesis Staging (CSS) system of seminiferous tubule cross-sections is presented for fast analysis of mouse sperm development. Both qualitative and quantitative evaluation results show that the CSS system outperforms a human histologist in terms of discriminating three stage groups: ES, MS, and LS and MS stages. Some new domain-inspired handcraft features were developed to further discriminate the tubules in LS stages. The Derivation-of-Gaussian (DtG) filter was utilized to describe the orientation entropy of elongated spermatids, a feature identified as being critical for discriminating tubules in stages VI-VIII. Moreover, we leveraged cell- and region- level features to quantify tubules in stages VI-VIII. Significant histomorphological features chosen by the CSS system were found to be consistent with the primary features employed by histologists in discriminating stages VI-VIII. These computerized features are interpretable, intuitive, and repeatable and can potentially be applied to other problems in computational pathology. This is our first attempt to develop a CSS system in studying mouse sperm development. One limitation of this work is that the current CSS system can only discriminate three initial stage groups. In future work, we will extend the CSS system to discriminate the tubules in I-XII stages. Also, this study focused on normal mouse testis sections. In the future, we will extend the studies to sections of infertile testes and quantitatively analyze morphological changes in seminiferous tubule sections. The other limitation of the study was the imbalance between exemplars for the different stages in the training and testing sets. Unfortunately, we were limited in the number of available cases for this study, but we will be looking to expand the number of cases both for training and testing in future work.
Supplementary Material
Fig. 3.
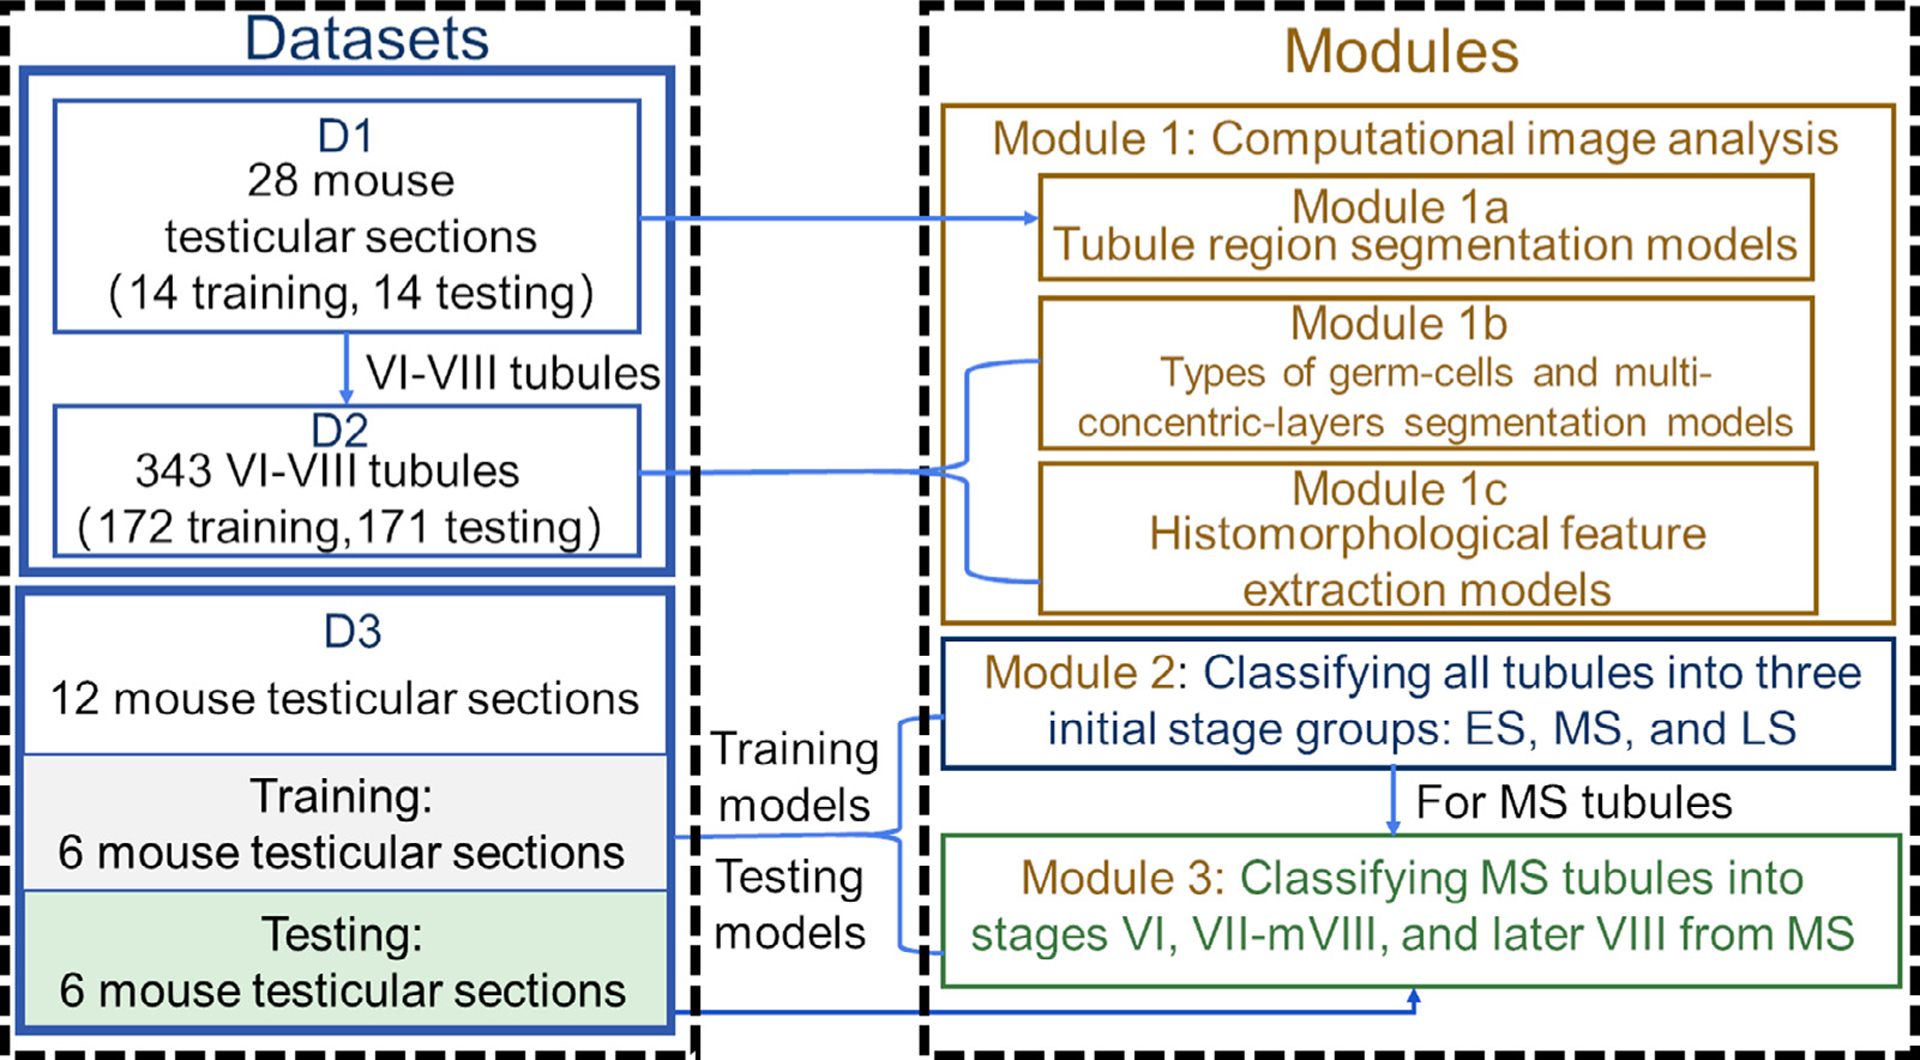
Diagram describes the datasets and modules in the paper and the connection between three datasets and modules in the paper.
Table 6.
Illustration of datasets studied in Modules 2&3 and corresponding quantitative evaluation results for classification accuracy with the CSS system.
| Classification | Datasets | Total | Stages | Models | Training Set | Testing Set | |||||
|---|---|---|---|---|---|---|---|---|---|---|---|
| # of images | model set | validation set | Classification accuracy | # of images | testing set | Classification accuracy | |||||
| All tubules | D3 | 12 | ES | ResNet-18 | 6 | 412 | 103 | 96.28% | 6 | 427 | 91.95% |
| MS | 319 | 80 | 320 | ||||||||
| LS | 262 | 65 | 326 | ||||||||
| Tubules in MS | VI | MRMR-Softmax | 100 | 25 | 83.46% | 92 | 79.00% | ||||
| VII-mVIII | 168 | 42 | 180 | ||||||||
| late VIII | 52 | 12 | 48 | ||||||||
Acknowledgments
We would like to thank Dr. Rex Hess and members of Xu Lab for discussion and/or comments on this work. This work was supported by National Natural Science Foundation of China (Nos. U1809205, 61771249, 91959207, 81871352, 31771652, 81270737, and 81401256); National Basic Research Program of China (2015CB943002); Natural Science Foundation of Jiangsu Province of China (No.BK20181411); Special Foundation by Jiangsu Collaborative Innovation Center of Atmospheric Environment and Equipment Technology (CICAEET) and Jiangsu Key Laboratory of Big Data Analysis Technology (B-DAT) (No. 2020xtzx005); Qing Lan Project of Jiangsu Province. Research reported in this publication was also supported by the National Cancer Institute of the National Institutes of Health under award numbers: 1U24CA199374-01, R01CA202752-01A1, R01CA208236-01A1, R01 CA216579-01A1, R01 CA220581-01A1, 1U01 CA239055-01; National Institute for Biomedical Imaging and Bioengineering: 1R43EB028736-01; National Center for Research Resources under award number: 1C06 RR12463-01; VA Merit Review Award IBX004121A from the United States Department of Veterans Affairs Biomedical Laboratory Research and Development Service; The DoD Breast Cancer Research Program Breakthrough Level 1 Award W81XWH-19-1-0668; The DOD Prostate Cancer Idea Development Award (W81XWH-15-1-0558); The DOD Lung Cancer Investigator-Initiated Translational Research Award (W81XWH-18-1-0440); The DOD Peer Reviewed Cancer Research Program (W81XWH-16-1-0329); The Ohio Third Frontier Technology Validation Fund; The Wallace H. Coulter Foundation Program in the Department of Biomedical Engineering and The Clinical and Translational Science Award Program (CTSA) at Case Western Reserve University.
The content is solely the responsibility of the authors and does not necessarily represent the official views of the National Institutes of Health, the U.S. Department of Veterans Affairs, the Department of Defense, or the United States Government.
Footnotes
Declaration of Competing Interest
The authors declare that they have no known competing financial interests or personal relationships that could have appeared to influence the work reported in this paper.
Supplementary material
Supplementary material associated with this article can be found, in the online version, at doi: 10.1016/j.media.2020.101835.
References
- Ahmed EA, de Rooij DG, 2009. Staging of Mouse Seminiferous Tubule Cross-Sections. Methods in Molecular Biology, 558. Humana Press, Totowa, NJ, pp. 263–277. [DOI] [PubMed] [Google Scholar]
- Bera K, Schalper KA, Rimm DL, Velcheti V, Madabhushi A, 2019. Artificial intelligence in digital pathology - new tools for diagnosis and precision oncology. Nat. Rev. Clin. Oncol 16 (11), 703–715. [DOI] [PMC free article] [PubMed] [Google Scholar]
- Clermont Y, 1972. Kinetics of spermatogenesis in mammals: seminiferous epithelium cycle and spermatogonial renewal. Physiol. Rev 52 (1), 198–236. [DOI] [PubMed] [Google Scholar]
- Crosier M, Griffin LD, 2010. Using basic image features for texture classification. Int J Comput Vis 88 (3), 447–460. [Google Scholar]
- Fakhrzadeh A, Spörndly-Nees E, Ekstedt E, Holm L, Luengo Hendriks CL, 2017. New computerized staging method to analyze mink testicular tissue in environmental research. Environ. Toxicol. Chem 36 (1), 156–164. doi: 10.1002/etc.3517. [DOI] [PubMed] [Google Scholar]
- Fakhrzadeh A, Spörndly-Nees E, Holm L, Luengo Hendriks CL, 2012. Analyzing tubular tissue in histopathological thin sections. In: 2012 International Conference on Digital Image Computing Techniques and Applications (DICTA), pp. 1–6. [Google Scholar]
- Fakhrzadeh A, Spörndly-Nees E, Holm L, Luengo Hendriks CL, 2013. Epithelial cell segmentation in histological images of testicular tissue using graph-cut. In: Petrosino A (Ed.), Image Analysis and Processing – ICIAP 2013. Springer Berlin Heidelberg, Berlin, Heidelberg, pp. 201–208. [Google Scholar]
- Griffin LD, 2007. The second order local-image-structure solid. IEEE Trans Pattern Anal Mach Intell 29 (8), 1355–1366. [DOI] [PubMed] [Google Scholar]
- Hanchuan Peng, Fuhui Long, Ding C, 2005. Feature selection based on mutual information criteria of max-dependency, max-relevance, and min-redundancy. IEEE Trans Pattern Anal Mach Intell 27 (8), 1226–1238. doi: 10.1109/TPAMI.2005.159. [DOI] [PubMed] [Google Scholar]
- He K, et al. , 2016. Deep residual learning for image recognition. CVPR. [Google Scholar]
- Hess RA, Chen P, 1992. Computer tracking of germ cells in the cycle of the seminiferous epithelium and prediction of changes in cycle duration in animals commonly used in reproductive biology and toxicology. J. Androl 13 (3), 185–190. doi: 10.1002/j.1939-4640.1992.tb00297.x. [DOI] [PubMed] [Google Scholar]
- Hess RA, de Franca LR, 2008. Spermatogenesis and Cycle of the Seminiferous Epithelium. Springer New York, New York, NY, pp. 1–15. [DOI] [PubMed] [Google Scholar]
- Hu J, Shen L, Sun G, 2018. Squeeze-and-excitation networks. In: The IEEE Conference on Computer Vision and Pattern Recognition (CVPR). [Google Scholar]
- Ibtehaz N, Rahman MS, 2020. MultiResUNet: rethinking the u-net architecture for multimodal biomedical image segmentation. Neural Networks 121, 74–87. doi: 10.1016/j.neunet.2019.08.025. [DOI] [PubMed] [Google Scholar]
- Kao C-Y, 2018. A Deep Learning Architecture for Histology Image Classification. The University of North Carolina at Chapel Hill. [Google Scholar]
- Krizhevsky A, Sutskever I, Hinton GE. Imagenet classification with deep convolutional neural networks. In: Advances in Neural Information Processing Systems, p. 2012. [Google Scholar]
- LeCun Y, Bengio Y, Hinton G, 2015. Deep learning. Nature 521 (7553), 436–444. [DOI] [PubMed] [Google Scholar]
- Lee G, Veltri RW, Zhu G, Ali S, Epstein JI, Madabhushi A, 2017. Nuclear shape and architecture in benign fields predict biochemical recurrence in prostate cancer patients following radical prostatectomy: preliminary findings. Eur Urol Focus 3 (4), 457–466. [DOI] [PMC free article] [PubMed] [Google Scholar]
- Lee S, Fu C, Salama P, Dunn KW, Delp EJ, 2018. Tubule segmentation of fluorescence microscopy images based on convolutional neural networks with in-homogeneity correction. Electronic Imaging 2018 (15), 199–201. [Google Scholar]
- Lewis JSJ, Ali S, Luo J, Thorstad WL, Madabhushi A, 2014. A quantitative histomorphometric classifier (QuHbIC) identifies aggressive versus indolent p16-positive oropharyngeal squamous cell carcinoma. Am. J. Surg. Pathol 38 (1). [DOI] [PMC free article] [PubMed] [Google Scholar]
- Li H, Liang Z, Yang J, Wang D, Wang H, Zhu M, Geng B, Xu EY, 2019. DAZL Is a master translational regulator of murine spermatogenesis. Natl Sci Rev 6 (3), 455–468. [DOI] [PMC free article] [PubMed] [Google Scholar]
- Li H, Whitney J, Bera K, Gilmore H, Thorat MA, Badve S, Madabhushi A, 2019. Quantitative nuclear histomorphometric features are predictive of oncotype dx risk categories in ductal carcinoma in situ: preliminary findings. Breast Cancer Research 21 (1), 114. [DOI] [PMC free article] [PubMed] [Google Scholar]
- Long J, Shelhamer E, Darrell T, 2015. Fully convolutional networks for semantic segmentation. CVPR. [DOI] [PubMed] [Google Scholar]
- Lu C, Romo-Bucheli D, Wang X, Janowczyk A, Ganesan S, Gilmore H, Rimm D, Madabhushi A, 2018. Nuclear shape and orientation features from h &e images predict survival in early-stage estrogen receptor-positive breast cancers. Lab. Invest 98 (11), 1438–1448. [DOI] [PMC free article] [PubMed] [Google Scholar]
- Meistrich ML, Hess RA, 2013. Assessment of spermatogenesis through staging of seminiferous tubules. Methods Mol Biol 927, 299–307. [DOI] [PubMed] [Google Scholar]
- Oakberg EF, 1956. A description of spermiogenesis in the mouse and its use in analysis of the cycle of the seminiferous epithelium and germ cell renewal. American Journal of Anatomy 99 (3), 391–413. [DOI] [PubMed] [Google Scholar]
- Reis S, Gazinska P, Hipwell JH, Mertzanidou T, Naidoo K, Williams N, Pinder S, Hawkes DJ, 2017. Automated classification of breast cancer stroma maturity from histological images. IEEE Trans. Biomed. Eng 64 (10), 2344–2352. [DOI] [PubMed] [Google Scholar]
- Ronneberger O, Fischer P, Brox T, 2015. U-net: Convolutional networks for biomedical image segmentation. In: Navab N, Hornegger J, Wells WM, Frangi AF (Eds.), Medical Image Computing and Computer-Assisted Intervention – MICCAI 2015. Springer International Publishing, Cham, pp. 234–241. [Google Scholar]
- Russell LD, Ettlin RA, Hikim APS, Clegg ED, 1993. Histological and histopathological evaluation of the testis. Int. J. Androl 16 (1), 83. [Google Scholar]
- Sirinukunwattana K, Pluim JP, Chen H, Qi X, Heng P-A, Guo YB, Wang LY, Matuszewski BJ, Bruni E, Sanchez U, B?hm A, Ronneberger O, Cheikh BB, Racoceanu D, Kainz P, Pfeiffer M, Urschler M, Snead DR, Rajpoot NM, 2017. Gland segmentation in colon histology images: the glas challenge contest. Med Image Anal 35, 489–502. doi: 10.1016/j.media.2016.08.008. [DOI] [PubMed] [Google Scholar]
- Spörndly-Nees E, 2018. Male reproductive health in environmental research.
- VanGompel MJ, Xu EY, 2010. A novel requirement in mammalian spermatid differentiation for the DAZ-family protein Boule. Hum. Mol. Genet 19 (12), 2360–2369. [DOI] [PMC free article] [PubMed] [Google Scholar]
- Wang X, Barrera C, Velu P, Bera K, Prasanna P, Khunger M, Khunger A, Velcheti V, Madabhushi A, 2018. Computer extracted features of cancer nuclei from h&e stained tissues of tumor predicts response to nivolumab in non-small cell lung cancer.. Journal of Clinical Oncology 36 (15_suppl), 12061. [Google Scholar]
- Wang X, Janowczyk A, Zhou Y, Thawani R, Fu P, Schalper K, Velcheti V, Madabhushi A, 2017. Prediction of recurrence in early stage non-small cell lung cancer using computer extracted nuclear features from digital H&E images.. Sci Rep 7 (1). [DOI] [PMC free article] [PubMed] [Google Scholar]
- Whitney J, Corredor G, Janowczyk A, Ganesan S, Doyle S, Tomaszewski J, Feldman M, Gilmore H, Madabhushi A, 2018. Quantitative nuclear histomorphometry predicts oncotype dx risk categories for early stage er+ breast cancer. BMC Cancer 18 (1), 610. [DOI] [PMC free article] [PubMed] [Google Scholar]
- Xu H, Lu C, Berendt R, Jha N, Mandal M, 2016. Automatic nuclei detection based on generalized laplacian of gaussian filters. IEEE Journal of Biomedical & Health Informatics 21 (3), 826–837. [DOI] [PubMed] [Google Scholar]
- Xu J, Gong L, Wang G, Lu C, Gilmore H, Zhang S, Madabhushi A, 2019. Convolutional neural network initialized active contour model with adaptive ellipse fitting for nuclear segmentation on breast histopathological images. J. Med. Imaging 6 (1), 1–16. [DOI] [PMC free article] [PubMed] [Google Scholar]
- Xu J, Lu H, Li H, Wang X, Madabhushi A, Xu Y, 2019. Histopathological image analysis on mouse testes for automated staging of mouse seminiferous tubule. In: Reyes-Aldasoro CC, Janowczyk A, Veta M, Bankhead P, Sirinukunwattana K (Eds.), Digital Pathology. Springer International Publishing, Cham, pp. 117–124. [Google Scholar]
- Xu J, Xiang L, Liu Q, Gilmore H, Wu J, Tang J, Madabhushi A, 2016. Stacked sparse autoencoder (ssae) for nuclei detection on breast cancer histopathology images. IEEE Trans Med Imaging 35 (1), 119–130. doi: 10.1109/TMI.2015.2458702. [DOI] [PMC free article] [PubMed] [Google Scholar]
Associated Data
This section collects any data citations, data availability statements, or supplementary materials included in this article.