

Abstract
Mitochondrial DNA (mtDNA) encodes several key components of respiratory chain complexes that produce cellular energy through oxidative phosphorylation. mtDNA is vulnerable to damage under various physiological stresses, especially oxidative stress. mtDNA damage leads to mitochondrial dysfunction, and dysfunctional mitochondria can be removed by mitophagy, an essential process in cellular homeostasis. However, how damaged mtDNA is selectively cleared from the cell, and how damaged mtDNA triggers mitophagy, remain mostly unknown. Here, we identified a novel mitophagy receptor, ATAD3B, which is specifically expressed in primates. ATAD3B contains a LIR motif that binds to LC3 and promotes oxidative stress‐induced mitophagy in a PINK1‐independent manner, thus promoting the clearance of damaged mtDNA induced by oxidative stress. Under normal conditions, ATAD3B hetero‐oligomerizes with ATAD3A, thus promoting the targeting of the C‐terminal region of ATAD3B to the mitochondrial intermembrane space. Oxidative stress‐induced mtDNA damage or mtDNA depletion reduces ATAD3B‐ATAD3A hetero‐oligomerization and leads to exposure of the ATAD3B C‐terminus at the mitochondrial outer membrane and subsequent recruitment of LC3 for initiating mitophagy. Furthermore, ATAD3B is little expressed in m.3243A > G mutated cells and MELAS patient fibroblasts showing endogenous oxidative stress, and ATAD3B re‐expression promotes the clearance of m.3243A > G mutated mtDNA. Our findings uncover a new pathway to selectively remove damaged mtDNA and reveal that increasing ATAD3B activity is a potential therapeutic approach for mitochondrial diseases.
Keywords: ATAD3B, mitochondrial DNA, mitophagy, oxidative stress
Subject Categories: Autophagy & Cell Death, Membrane & Intracellular Transport
LIR motif‐containing protein ATAD3B recruits LC3 to mitochondria for PINK1/Parkin‐independent mitophagy in mammalian cells.

Introduction
Mitochondria are ubiquitous and highly dynamic eukaryotic organelles, which produce about 90% of the cellular ATP through oxidative phosphorylation (OXPHOS) in most mammalian cells. Also, mitochondria play an essential role in a series of cellular processes, including tricarboxylic acid cycle (TCA), β‐oxidation of fatty acids, calcium homeostasis, apoptosis, and cellular signaling (Suen et al, 2008). Unlike other organelles, mitochondria contain circular double‐stranded DNA, called mitochondrial DNA (mtDNA), which is usually located at the mitochondrial matrix and encodes a series of critical subunits of the oxidative phosphorylation as well as tRNAs and rRNAs necessary for their synthesis (Yan et al, 2019). In addition, mtDNA plays an important role in innate immune responses and inflammatory pathology (West & Shadel, 2017). Each cell contains hundreds to thousands of mtDNA copies, and each mitochondrion contains one or more copies of mtDNA, which is packaged by a series of proteins, including TFAM, POLG, prohibitins, and ATAD3, to form an mtDNA‐protein complex called nucleoid (Lee & Han, 2017). In contrast to the nuclear DNA (nDNA), mtDNA is exclusively transmitted through maternal inheritance (Schon et al, 2012; Yan et al, 2019).
Damage of the mtDNA occurs in response to a series of physiological stresses due to the lack of protective histones in the structure and effective repair mechanisms (Kujoth et al, 2005). mtDNA is susceptible to damage by oxygen reactive species, which lead to the formation of deoxyribose rings, apurinic/apyrimidinic (AP) sites, strand breaks, and other damages (Shokolenko et al, 2009; Kazak et al, 2012). Moreover, damaged mtDNA can result in the dysfunction of the mitochondrial respiratory chain, leading to increased production of reactive oxygen species (ROS), which will damage the mtDNA even further (Hiona & Leeuwenburgh, 2008). These mechanisms contribute to the very high mutation rate of the mtDNA, which is about 10‐ to 17‐fold higher than that in the nDNA (Tuppen et al, 2010; Schon et al, 2012). Furthermore, the inability to eliminate mutated or damaged mtDNA causes the accumulation of mitochondria with mtDNA heteroplasmy, where increased damaged mtDNA coexists with wild‐type (WT) mtDNA (Bacman et al, 2013; Yan et al, 2019). mtDNA mutations and mitochondrial dysfunction are associated with various human diseases, ranging from severe inherited disorders to common late‐onset diseases, including mitochondrial encephalopathy, lactic acidosis, and stroke‐like episodes (MELAS), Kearns–Sayre syndrome (KSS), and Leber’s hereditary optic neuropathy (LHON) (Tuppen et al, 2010; El‐Hattab et al, 2015). MELAS is due to the mutation of mtDNA transfer RNA Leu (UUR) at nucleotide 3243A > G, which is the most common human pathogenic mtDNA point mutation (El‐Hattab et al, 2015). In general, clinical manifestations occur when the ratio of mutants to WT mtDNA exceeds about 4:1 (Bacman et al, 2013; Wallace & Chalkia, 2013). However, there is currently no effective treatment for halting the progression of mtDNA mutation‐related human diseases.
In most cells, mitochondrial autophagy (mitophagy) can clear WT or mutant mtDNA, which is a selective pathway to eliminate the damaged or dysfunctional mitochondria (de Vries et al, 2012; Yan et al, 2019). However, mtDNA mutation alone is not sufficient to initiate selective mitophagy (de Vries et al, 2012). The well‐known pathway of mitophagy is mediated by the PINK1‐Parkin pathway (Youle & Narendra, 2011). In this pathway, PINK1 accumulates on depolarized mitochondria, recruiting, and activating Parkin. Activated Parkin then ubiquitinates numerous mitochondrial outer membrane proteins to mediate the clearance of damaged mitochondria via mitophagy (Youle & Narendra, 2011). Besides, under certain physiological conditions, such as hypoxia, mitophagy can also be initiated via mitophagy receptors, including NIX, BNIP3, FUNDC1, Bcl2L13, Prohibitin 2, and FKBP8 (Zhang & Ney, 2009; Novak et al, 2010; Liu et al, 2012; Murakawa et al, 2015; Bhujabal et al, 2017; Wei et al, 2017). Mitophagy receptors contain an LC3‐interacting region (LIR) that physically binds to LC3 (a key autophagosomal membrane protein), connecting the mitochondria and autophagosomes. Once LC3 is recruited to the mitochondria, autophagosomes engulf the mitochondria and deliver it to the lysosome for degradation (Liu et al, 2014). LIR is composed of a [W/F/Y]xx[L/I/V] core motif that interacts with two hydrophobic pockets in the LC3 (or other ATG8 family proteins) anchored in the phagophore membrane (Birgisdottir et al, 2013). The LIR motif of mitophagy receptors is widely recognized as being critical for the selective sequestration of dysfunctional or damaged mitochondria.
ROS are highly reactive molecules, consisting of hydrogen peroxide (H2O2), hydroxyl radical (·OH), and superoxide anion (O2 −). The electron transport chain of mitochondria is the primary producer of ROS, which readily attack nDNA and mtDNA, and cause a variety of DNA lesions, including DNA strand breaks, oxidized DNA bases, and abasic sites (Alexeyev et al, 2013). 7,8‐dihydro‐8‐oxo‐deoxyguanosine (8‐oxo‐dG), also known as 8‐hydroxy‐2′‐deoxyguanosine (8‐OHdG), is among the most common and well‐characterized ROS‐induced DNA lesions and has been used as a biomarker for oxidative stress (Ock et al, 2012). During oxidative stress, ROS act as an initiator and mediator of autophagy, which in turn contributes to the removal of the irreversibly oxidized biomolecules, including DNA, proteins, and lipids in cells (Filomeni et al, 2015; Shefa et al, 2019). Although mtDNA is vulnerable to oxidative stress, whether and how mitophagy removes oxidative stress‐induced damaged mtDNA remains poorly understood.
Here, we report that mitophagy is critical for the clearance of damaged mtDNA during oxidative stress, and identify a novel mitophagy receptor ATAD3B, which regulates the removal of human damaged mtDNA via mitophagy. Upon oxidative stress or mtDNA damage, ATAD3B binds to LC3B to initiate mitophagy by its LIR motif. Moreover, we find that re‐expression of ATAD3B decreases the level of mutated mtDNA (3243A > G) in MELAS patient‐derived cells suggesting a novel therapeutic strategy for mitochondrial diseases.
Results
Mitophagy regulates the clearance of oxidative stress‐induced damaged mtDNA
Mitochondria contain their genome, mitochondrial DNA (mtDNA), which usually exists in hundreds of copies in a mammalian cell. Due to the insufficient mtDNA repair systems and lack of protective histones, physiological and pathological stresses, especially oxidative stress, easily damage mtDNAs (Yakes & Van Houten, 1997; Alexeyev et al, 2013; Yan et al, 2019). Damaged mitochondria can be eliminated by mitophagy (Youle & Narendra, 2011). However, how to remove the damaged mtDNA remains largely unknown. To investigate mtDNA damage, we used quantitative PCR (Q‐RCR) to amplify mtDNA and quantify mtDNA lesions in several cell lines, including HEK293, HeLa, and MEFs. This assay is based on the principle that many kinds of DNA lesions can slow down or block the progression of DNA polymerase. Therefore, if equal amounts of DNA from differently treated samples are amplified under identical conditions, DNA with fewer lesions will amplify to a greater extent than more damaged DNA (Van Houten et al, 2000). In response to hydrogen peroxide (H2O2), a universal intracellular mediator of oxidative stress, we observed significant mtDNA damage, reflected by the reduced mtDNA amplification and increased mtDNA lesions in HEK293 cells (Appendix Fig S1A–C). The extent of damaged mtDNAs was remarkably reduced 1 h after washout (Appendix Fig S1B), indicating that the damaged mitochondria were removed or repaired. H2O2 treatment also damaged nDNA but quickly recovered due to harboring efficient DNA repair systems (Appendix Fig S1D–F). However, because mtDNA repair systems in mitochondria are insufficient (Kazak et al, 2012; Alexeyev et al, 2013), we hypothesize that autophagy might significantly contribute to the elimination of H2O2‐induced damaged mtDNA. Therefore, we depleted ATG5, a key regulator of autophagy, to further assess the elimination of damaged mtDNA. Upon ATG5 knockdown (KD), most H2O2 ‐induced mtDNA damage remained 1 h after washout (Appendix Fig S1B and C), suggesting that autophagy machinery is required for the removal of damaged mtDNAs. To further investigate the mtDNA damage and its clearance, we next used 3‐nitropropionic acid (3‐NPA), a naturally potent mtDNA damage inducer that increases cellular mitochondrial ROS production (Acevedo‐Torres et al, 2009). Both H2O2 and 3‐NPA treatment resulted in markedly increased mitochondrial ROS production (Appendix Fig S1G), which is well known to cause mtDNA lesions. As expected, 3‐NPA treatment also resulted in significant mtDNA lesions, which were removed 1 h after washout (Fig 1A and B). Similar to H2O2 treatment, ATG5 KD significantly inhibited the removal of 3‐NPA‐induced damaged mtDNA (Fig 1A and B).
Figure 1. Mitophagy is required for the clearance of oxidative stress‐induced damaged mtDNA.

- Assessment of mtDNA damage by quantitative PCR. HEK293 cells infected with control (empty vector) or shATG5 for 5 days. Cells were then incubated with DMSO or 4 mM 3‐NPA for 2 h and either immediately harvested or washed with fresh medium and incubated for another 1 h. Cells with or without washout were used for the extraction of total DNA. All DNA samples were used for amplification of 8.9 kb mtDNA fragment using quantitative PCR and were normalized to amplification of a 221 bp mtDNA fragment. PCR products were quantitated by PicoGreen staining using Micro Plate Reader. Data are presented as mean ± SD (n = 3 independent experiments), and statistical significance was assessed by two‐tailed Student’s t‐test, N.S., not significant, *P < 0.05, **P < 0.01.
- The data in (A) were further calculated for the frequency of mtDNA damage. The equation was seen in “Materials and Methods”. Data are presented as mean ± SD (n = 3 independent experiments), and statistical significance was assessed by a two‐tailed Student’s t‐test, N.S., not significant, **P < 0.01.
- Representative images show 8‐oxo‐dG staining. Control or shATG5 HeLa cells were treated with DMSO, 200 µM H2O2, or 4 mM 3‐NPA for 2 h, and then either fixed immediately or washed with fresh medium and incubated for another 1 h. Cells were immunostained with DAPI and anti‐8‐oxo‐dG antibody and analyzed by confocal microscopy. Scale bar, 10 µm.
- Quantification of the relative 8‐oxo‐dG fluorescence intensity in (C). Data are presented as mean ± SD (n = 3 independent experiments, 20 cells per experiment), and statistical significance was assessed by a two‐tailed Student’s t‐test, N.S., not significant, *P < 0.05, **P < 0.01.
- Control or shATG5 HEK293 cells stably expressing mito‐Keima. Control cells were treated with DMSO, 200 µM H2O2, or 4 mM 3‐NPA for 2 h, and shATG5 cells were treated with 200 µM H2O2 as a negative control. Cells were then imaged with 458 nm (measuring mitochondria with a neutral pH) and 561 nm (measuring mitochondria with an acidic pH) laser excitation for mito‐Keima by confocal microscopy. Right panels show the pixel intensity of red (mitochondria within lysosomes) and green (mitochondria in the cytoplasm) from a line. Scale bar, 10 µm.
- Quantification of the relative ratio of red to green fluorescence intensity (561 nm/458 nm) of the cells described in (E). Data are presented as mean ± SD (n = 3 independent experiments, 20 cells per experiment), and statistical significance was assessed by a two‐way ANOVA, N.S., not significant, **P < 0.01.
- HeLa cells expressing GFP‐LC3 were treated with DMSO, 200 µM H2O2, or 4 mM 3‐NPA for 2 h. Cells were stained with anti‐Tom20 and anti‐DNA antibodies and then analyzed by confocal microscopy. The white arrows were indicated the LC3 punta colocalizing or contacting with mtDNA/Tom20. Scale bar, 10 µm.
- Quantification of the LC3 punta colocalizing or contacting with mtDNA/Tom20 in a cell. n = 30 cells from 3 coverslips, data are presented as mean ± SD (n = 30), and statistical significance was assessed by a one‐way ANOVA with Tukey’s multiple comparisons test, ***P < 0.001.
To directly visualize mtDNA damage, 8‐oxo‐dG (or 8‐OHdG), which is one of the major ROS‐induced base‐modified DNA products and widely accepted as a marker of oxidative DNA lesions (Ock et al, 2012), was detected by immunostaining. After exposure to H2O2 or 3‐NPA, HeLa cells displayed a remarkable increase in the intensity of cytoplasmic 8‐oxo‐dG fluorescence (excluding the fluorescence in the nucleus), indicating the prominent increase of mtDNA lesions. Incubation with a standard medium for 1 h after washout resulted in a significant decrease of cytoplasmic 8‐oxo‐dG fluorescence intensity (Fig 1C and D) while there was no significant decrease in cytoplasmic 8‐oxo‐dG fluorescence intensity 1 h after washout in ATG5 KD cells (Fig 1C and D), indicating that ATG5 KD blocks the clearance of damaged mtDNA. Overall, these findings suggest that autophagy is responsible for the clearance of H2O2 and 3‐NPA‐induced damaged mtDNA.
To investigate how damaged mtDNA is eliminated, mitochondrial autophagy (mitophagy) was then measured. Mito‐Keima, a useful tool in the assessment of single mitophagic events (Katayama et al, 2011), was used to evaluate mitophagy. Upon treatment with DMSO, no mitophagy was detected based on the absence of red fluorescence in HEK293 cells expressing mito‐keima (Fig 1E and F). However, in response to 3‐NPA or H2O2, a remarkable increase in red fluorescence was detected in WT cells but not in ATG5 KD cells (Fig 1E and F), suggesting that mitophagy can eliminate 3‐NPA or H2O2‐induced damaged mitochondria. In addition, transmission electron microscope analysis revealed that H2O2 treatment led to some mitochondria engulfed by autophagosome (Appendix Fig S1H), further confirming that H2O2 treatment induces mitophagy. Our data are consistent with the previous finding that the direct generation of mitochondrial ROS using a mitochondrial‐targeted photosensitizer can induce mitophagy (Wang et al, 2012). Furthermore, 3‐NPA or H2O2 treatment increased the number of GFP‐LC3 puncta, part of which colocalized with mitochondria and mtDNA (Fig 1G and H), further demonstrating that mitophagy contributes to the clearance of oxidative stress‐induced damaged mtDNA.
Identification of ATAD3B as a strong novel regulator of oxidative stress‐induced mitophagy
To investigate how oxidative stress‐induced damaged mtDNA initiates mitophagy signal, we screened for an mtDNA‐related mitophagy regulator by using a mito‐Keima assay. mtDNA and a set of mtDNA binding or associated proteins are packaged into nucleoprotein complexes referred to as an “mtDNA nucleoid.” We carried out a screen where we knocked down over 20 nucleoid‐associated proteins (including mtDNA binding protein LONP1, SSBP1, PEO1, POLG2, POLRMT, TFAM, and ATAD3) by short hairpin RNAs in mito‐Keima expressing HEK293 cells and analyzed the effect of knockdown by Western blotting or quantitative PCR (Appendix Fig S2A–C). Upon H2O2 treatment, we then assessed control and nucleoid‐associated protein knockdown cells by confocal microscopy and flow cytometry analysis. As illustrated in Fig 2A, a set of mtDNA binding proteins are associated with H2O2‐induced mitophagy. Among them, the effect of ATAD3 KD is similar to that of ATG5 KD on H2O2‐induced mitophagy (Fig 2A). Several recent studies have reported that ATAD3 gene cluster deletions are associated with the fatal congenital pontocerebellar hypoplasia and aberrant mtDNA organization (Desai et al, 2017), leading us to focus on the role of ATAD3 on the clearance of damaged mtDNA.
Figure 2. ATAD3B is a novel and robust regulator of oxidative stress‐induced mitophagy.
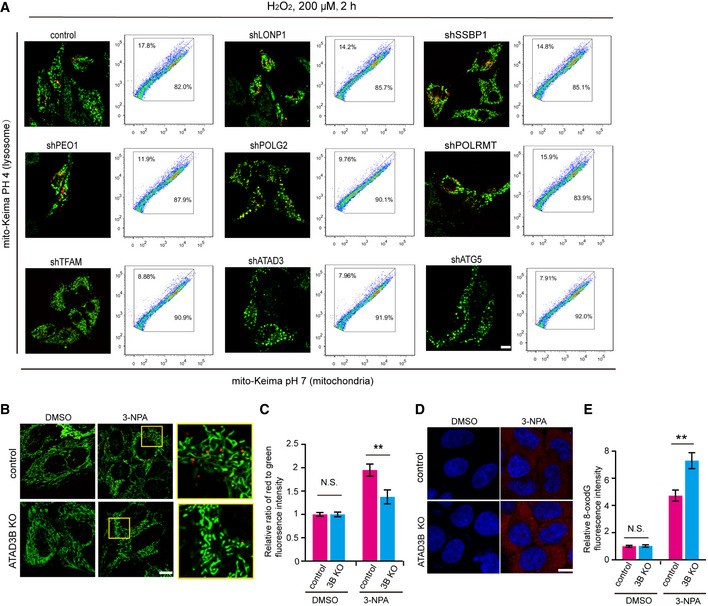
- Screening of mitophagy regulators for removing damaged mtDNA. HeLa cells were infected by lentiviral particles containing the indicated knockdown vectors. Five days later, cells were treated with 200 µM H2O2 for 2 h. Cells were then imaged with 458 nm (measuring mitochondria with a neutral pH) and 561 nm (measuring mitochondria with an acidic pH) laser excitation for mito‐Keima. ShATG5 was used as a negative control. Right panels for each image show the FACS‐based mito‐Keima dot plots. The y‐axis represents the fluorescence emission of mito‐Keima at pH 4.0 (lysosome), while the x‐axis indicates mito‐Keima at pH 7.0 (mitochondria). The percentages of cells within the different regions are indicated. Scale bar, 10 µm.
- Control or ATAD3B KO HeLa cells stably expressing mito‐Keima were treated with 4 mM 3‐NPA for 2 h and imaged with 458 nm (measuring mitochondria with a neutral pH) and 561 nm (measuring mitochondria with an acidic pH) laser excitation for mito‐Keima by confocal microscopy. Scale bar, 10 µm.
- Quantification of the relative ratio of red to green fluorescence intensity (561 nm/458 nm) of the cells described in (B). Data are presented as mean ± SD (n = 3 independent experiments, 20 cells per experiment), and statistical significance was assessed by two‐tailed Student’s t‐test, N.S., not significant, **P < 0.01.
- Control or KO ATAD3B HeLa cells were treated with 4 mM 3‐NPA for 2 h. Cells were washed with fresh medium and incubated for another 1 h. Cells were then fixed and immunostained with DAPI and anti‐8‐oxo‐dG antibodies and were analyzed by confocal microscopy. Scale bar, 10 µm.
- Quantification of the relative 8‐oxo‐dG fluorescence intensity in cells described in (D). Data are presented as mean ± SD (n = 3 independent experiments, 20 cells per experiment), and statistical significance was assessed by two‐tailed Student’s t‐test, N.S., not significant, **P < 0.01.
There are three ATAD3 protein isoforms, and they belong to the family of ATPase AAA domain‐containing proteins. Among the ATAD3 family, ATAD3A and ATAD3B are the most prominent members and share high levels of similarity at the protein level (Appendix Fig S3A). While ATAD3A is conserved among all multicellular organisms, ATAD3B is specifically expressed in primates, including Pan troglodytes and Homo sapiens (Appendix Fig S3B). Human ATAD3B is highly expressed in embryonic stem cells and various cancer cells (Merle et al, 2012). Besides, according to the Human Proteome Map database, ATAD3B is also moderately expressed in various adult tissues, including the frontal cortex, retina, liver, ovary, testis, pancreas, and B cells (Appendix Fig S3C).
Since the targeting sequences used to knockdown ATAD3 (Table S1) are common for both ATAD3A and ATAD3B, we next investigated which one is responsible for regulating mtDNA‐related mitophagy. For this, we used CRISPR/Cas9 technology to create ATAD3A and ATAD3B double knockout (ATAD3 DKO) HeLa cell lines (Fig EV1A) and re‐expressed ATAD3 isoforms to determine which one may rescue mtDNA‐related mitophagy. mito‐Keima assay revealed that in response to 3‐NPA or H2O2, the expression of ATAD3A‐Flag in ATAD3 DKO cells promoted no increment of mitophagy when compared to control (ATAD3 DKO) cells (Fig EV1B–F). On the other hand, the expression of ATAD3B‐Flag in ATAD3 DKO cells dramatically increased the level of mitophagy compared with control (ATAD3 DKO) cells upon 3‐NPA or H2O2 treatment (Fig EV1B–F), suggesting that ATAD3B, but not ATAD3A, promotes 3NPA or H2O2‐induced mitophagy. In addition, ATAD3B‐Flag expression markedly increased H2O2‐induced mitophagy in MEFs that naturally lack ATAD3B (Fig EV1G and H). Moreover, ATAD3B knockout (KO) significantly decreased 3‐NPA‐induced mitophagy that is measured by mito‐Keima assay (Fig 2B and C). These findings suggest that ATAD3B promotes oxidative stress‐induced mitophagy independent of ATAD3A.
Figure EV1. ATAD3B promotes oxidative stress‐induced mitophagy.

-
AControl and ATAD3 DKO (ATAD3A and ATAD3B double knockout) HeLa cell lines were lysed and analyzed by Western blotting using anti‐ATAD3 or anti‐tubulin antibodies.
-
BATAD3 DKO HeLa cells were infected with lentiviral particles containing control, ATAD3A‐Flag, or ATAD3B‐Flag. Cell lysates were analyzed by Western blotting with anti‐ATAD3 or anti‐tubulin antibodies.
-
C–FWT or ATAD3 DKO HeLa cells stably expressing mito‐Keima were infected with lentiviral particles containing control, ATAD3A‐Flag, or ATAD3B‐Flag. Five days later, cells were treated with DMSO, 200 µM H2O2 (C), or 4 mM 3‐NPA (E) for 2 h and imaged with 458 nm (measuring mitochondria with a neutral pH) and 561 nm (measuring mitochondria with an acidic pH) laser excitation for mito‐Keima by confocal microscopy. Scale bar, 10 µm. The relative ratio of red to green fluorescence intensity (561 nm/458 nm) of DMSO, H2O2‐treated (D), or 3‐NPA‐treated (F) cells were then quantified respectively by ImageJ software. Data are presented as mean ± SD (n = 3 independent experiments, 20 cells per experiment), and statistical significance was assessed by a two‐way ANOVA, *P < 0.05, **P < 0.01.
-
GMEFs stably expressing mito‐Keima were infected with lentiviral particles containing control or ATAD3B‐Flag and further cultured for 5 days. Cells were then incubated with DMSO or 200 µM H2O2 for 2 h and imaged with 458 nm (measuring mitochondria with a neutral pH) and 561 nm (measuring mitochondria with an acidic pH) laser excitation for mito‐Keima using confocal microscopy. Scale bar, 10 µm.
-
HQuantification of the relative ratio of red to green fluorescence intensity (561 nm/458 nm) of the cells described in (F). Data are presented as mean ± SD (n = 3 independent experiments, 20 cells per experiment), and statistical significance was assessed by two‐tailed Student’s t‐test, N.S., not significant, **P < 0.01.
Source data are available online for this figure.
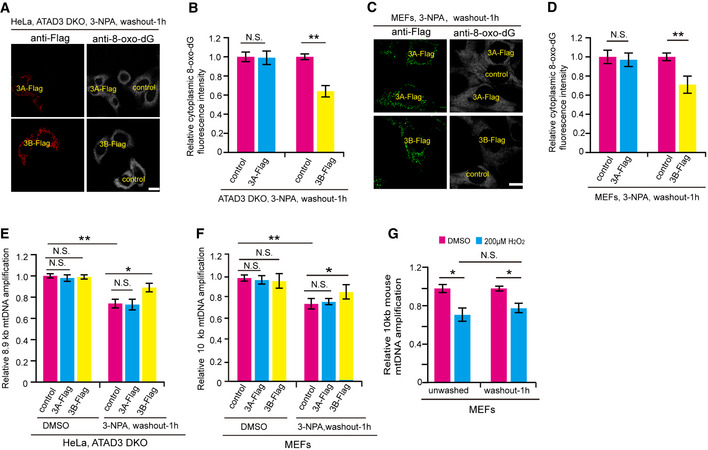
We then assessed the role of ATAD3B in the clearance of damaged mtDNA. Using anti‐8‐oxo‐dG fluorescence intensity as mtDNA damage marker, we found that 3‐NPA‐induced cytoplasmic 8‐oxo‐dG fluorescence intensity (excluding fluorescence intensity in the nucleus of the cell) of ATAD3B KO HeLa cells was significantly stronger than that of control cells (Fig 2D and E). In addition, the 3‐NPA‐induced cytoplasmic 8‐oxo‐dG fluorescence intensity of ATAD3A‐Flag expressed ATAD3 DKO cells was similar to that of control ATAD3 DKO cells (Fig EV2A and B). In contrast, the cytoplasmic 8‐oxo‐dG fluorescence intensity of ATAD3B‐Flag expressed ATAD3 DKO cells was remarkably decreased (Fig EV2A and B). Similarly, the cytoplasmic 8‐oxo‐dG fluorescence intensity of ATAD3B‐Flag expressed MEFs was remarkably weaker than that of control or ATAD3A expressed MEFs (Fig EV2C and D). Moreover, quantitative PCR data revealed that after treatment with 3‐NPA, the ability of mtDNA amplification in ATAD3B‐Flag expressed ATAD3 DKO cells or MEFs was significantly higher than that in control or ATAD3A‐Flag expressed ATAD3 DKO cells or MEFs (Fig EV2E and F), indicating that ATAD3B re‐expressed cells contain fewer mtDNA lesions. These data suggest that ATAD3B‐Flag expression promotes the clearance of damaged mtDNA induced by 3‐NPA. On the other hand, MEFs, which naturally lacks ATAD3B, showed little effect on the rescue of mtDNA amplification upon H2O2‐treatment and followed washout (Fig EV2G), further confirmed that ATAD3B facilitates the clearance of damaged mtDNA.
Figure EV2. ATAD3B promotes the clearance of damaged mtDNA.
-
AATAD3 DKO HeLa cells stably expressing ATAD3A‐Flag or ATAD3B‐Flag were mixed with control ATAD3 DKO HeLa cells, respectively, and cultured for 24 h. After treated with 4 mM 3‐NPA for 2 h, cells were washed with fresh medium and incubated for another 1 h. Cells were then fixed and immunostained with anti‐Flag and anti‐8‐oxo‐dG antibodies and were analyzed by confocal microscopy. Scale bar, 10 µm.
-
BQuantification of the relative 8‐oxo‐dG fluorescence intensity in cells described in (A). Data are presented as mean ± SD (n = 3 independent experiments, 20 cells per experiment), and statistical significance was assessed by individual two‐tailed Student’s t‐test, N.S., not significant, **P < 0.01.
-
CMEF cells stably expressing ATAD3A‐Flag or ATAD3B‐Flag were mixed with control MEF cells, respectively, and cultured for 24 h. After treated with 4 mM 3‐NPA for 2 h, cells were washed with fresh medium and incubated for another 1h. Cells were then fixed and immunostained with anti‐Flag and anti‐8‐oxo‐dG antibodies and were analyzed by confocal microscopy. Scale bar, 10 µm.
-
DQuantification of the relative 8‐oxo‐dG fluorescence intensity in cells described in (C). Data are presented as mean ± SD (n = 3 independent experiments, 20 cells per experiment), and statistical significance was assessed by individual two‐tailed Student’s t‐test, N.S., not significant, **P < 0.01.
-
E, FATAD3 DKO HeLa or MEF cells stably expressing control, ATAD3A‐Flag, and ATAD3B‐Flag were treated with DMSO or 4 mM 3‐NPA for 2 h and washed with fresh medium and incubated for another 1 h. Cells were then harvested and used for total DNA extraction. Extracted DNA samples were used for amplification of human 8.9 kb mtDNA (homo) fragment or mouse 10 kb mtDNA fragment using quantitative PCR and were normalized to amplification of a 221 bp (homo) or 117 bp (mus) mtDNA fragment. PCR products were quantitated by PicoGreen staining using Micro Plate Reader. Data are presented as mean ± SD (n = 3 independent experiments), and statistical significance was assessed by a two‐way ANOVA, N.S., not significant, *P < 0.05, **P < 0.01.
-
GMEFs were incubated with DMSO or 200 µM H2O2 for 2 h. Cells were then harvested or washed with fresh medium and incubated for another 1 h. Cells with or without washout were used for extracting total DNA. All DNA samples were used for amplification of 10 kb mouse mtDNA fragment using quantitative PCR and were normalized to amplification of a 117 bp mtDNA fragment. PCR products were quantitated by PicoGreen staining using Micro Plate Reader. Data are presented as mean ± SD (n = 3 independent experiments), and statistical significance was assessed by a two‐way ANOVA, N.S., not significant, *P < 0.05.
Overall, we identified a new potent regulator of mitophagy, ATAD3B, which is highly associated with the clearance of oxidative stress‐induced damaged mtDNA.
ATAD3B promotes oxidative stress‐induced mitophagy independent of the PINK1‐Parkin pathway
PINK1‐Parkin‐mediated mitophagy is the main pathway to eliminate damaged mitochondria, and ROS can induce mitophagy by activating the PINK1‐Parkin pathway (Youle & Narendra, 2011; Wang et al, 2012). However, loss of PINK1 function can still promote mitophagy through eliciting oxidative stress (Dagda et al, 2009), indicating that some other pathways are involved in oxidative stress‐induced mitophagy. In addition, ATAD3A suppresses PINK1‐dependent mitophagy by regulating PINK1 transport and processing (Jin et al, 2018). We then investigate whether ATAD3B‐regulated mitophagy is dependent on PINK1‐Parkin pathway. We measured mitophagy by using mito‐Keima in PINK1 KO HeLa cells treated with DMSO, OA (oligomycin and antimycin), H2O2, or 3‐NPA. Treatment with H2O2 and 3‐NPA, but not OA and DMSO, markedly increased the red fluorescence intensity of mito‐Keima in PINK1 KO cells (Fig 3A and B, Appendix Fig S4A–C). In addition, OA or CCCP robustly increased the PINK1 level of cells, but H2O2 and 3‐NPA do not affect PINK1 levels (Fig 3C, Appendix Fig S4D and E). These results indicate that oxidative stress can induce PINK1‐independent mitophagy. Furthermore, expression of ATAD3B‐Flag, but not ATAD3A‐Flag and control, dramatically increased the red fluorescence of mito‐Keima in PINK1 KO cells treated with H2O2 (Appendix Fig S4A and B). In agreement, ATAD3B KD markedly decreased the red fluorescence of mito‐Keima in PINK1 KO cells treated with H2O2 or 3‐NPA (Fig 3A and B, Appendix Fig S4F), suggesting that ATAD3B knockdown prevents the oxidative stress‐induced mitophagy. Therefore, ATAD3B promotes oxidative stress‐induced mitophagy independent of the PINK1‐Parkin pathway.
Figure 3. ATAD3B promotes oxidative stress‐induced mitophagy in a PINK1‐independent manner.

-
APINK1 KO HeLa cells stably expressing mito‐Keima were infected with control or shATAD3B. Five days later, cells were treated with DMSO, 200 µM H2O2, or 4 mM 3‐NPA for 2 h. Cells were then analyzed and imaged with 458 nm (measuring mitochondria with a neutral pH) and 561 nm (measuring mitochondria with an acidic pH) laser excitation for mito‐Keima by confocal microscopy. Scale bar, 10 µm.
-
BQuantification of the relative ratio of red to green fluorescence intensity (561 nm/458 nm) of the cells described in (A). Data are presented as mean ± SD (n = 3 independent experiments, 20 cells per experiment), and statistical significance was assessed by two‐tailed Student’s t‐test, N.S., not significant, **P < 0.01.
-
CHeLa cells were treated with DMSO, 4 mM 3‐NPA, 8 mM 3‐NPA, or 10 µM CCCP for 2 h, and cell lysates were then analyzed by Western blotting using the indicated antibodies.
-
D–GPINK1 KO HeLa cells stably expressing ATAD3A‐Flag (3A‐Flag) or ATAD3B‐Flag (3B‐Flag) were mixed with control PINK1 KO cells, respectively, and incubated for 24 h. Cells were treated with 4 mM 3‐NPA (D) or 200 µM H2O2 (F) for 2 h and then washed with fresh medium and incubated for another 1 h. Cells were fixed and immunostained with anti‐8‐oxo‐dG and anti‐Flag antibodies and analyzed by confocal microscopy. 8‐oxo‐dG fluorescence intensity of cells treated with 3‐NPA (E) or H2O2 (G) was quantified by ImageJ software. Data are presented as mean ± SD (n = 3 independent experiments, 20 cells per experiment), and statistical significance was assessed by individual two‐tailed Student’s t‐test, N.S., not significant, *P < 0.05, **P < 0.01. Scale bar, 10 µm.
-
H–KControl (GFP+) and shATAD3B (GFP‐) PINK1 KO HeLa cells were mixed and incubated for 24 h. Cells were then treated with 4 mM 3‐NPA (H) or 200 µM H2O2 (J) for 2 h, and washed with fresh medium, and incubated for another 1 h. Cells were fixed and immunostained with anti‐8‐oxo‐dG and DAPI, then analyzed by confocal microscopy. Control or shATAD3B cells are circled by white dashed lines. 8‐oxo‐dG fluorescence intensity of cells treated with 3‐NPA (I) or H2O2 (K) was quantified using ImageJ software. Data are presented as mean ± SD (n = 3 independent experiments, 20 cells per experiment), and statistical significance was assessed by two‐tailed Student’s t‐test, **P < 0.01. Scale bar, 10 µm.
Source data are available online for this figure.
We next evaluated the role of ATAD3B in the clearance of damaged mtDNA in PINK1 KO cells. Expression of ATAD3B‐Flag, but not ATAD3A‐Flag, significantly decreased cytoplasmic 8‐oxo‐dG fluorescence intensity in PINK1 KO cells treated with 3‐NPA or H2O2 (Fig 3D–G). On the other hand, ATAD3B KD significantly increased cytoplasmic 8‐oxo‐dG fluorescence intensity of PINK1 KO cells treated with 3‐NPA or H2O2 (Fig 3H–K). These data suggest that ATAD3B promotes the clearance of damaged mtDNA induced by oxidative stress in a manner independent of PINK1‐Parkin.
ATAD3B acts as a novel mitophagy receptor by directly binding to LC3B
Upon certain physiological stresses, LC3, a critical autophagy protein, interacts with mitophagy receptors such as NIX, BNIP3, and FUNDC1 to initiate receptor‐mediated mitophagy (Liu et al, 2014). To investigate how ATAD3B mediates oxidative stress‐induced mitophagy, we assessed the relationship between ATAD3B and LC3B. By co‐immunoprecipitation analysis, we found that GFP‐LC3B markedly co‐precipitated with ATAD3B‐Flag‐ and ATAD3A‐Flag‐coupled beads but not with control beads (Fig EV3A), suggesting that both ATAD3B‐Flag and ATAD3A‐Flag interact with GFP‐LC3B. We also observed a prominent interaction between endogenous LC3B and ATAD3 in 293T cells under H2O2 treatment (Fig 4A), further confirming that ATAD3 interacts with LC3B.
Figure EV3. ATAD3B binds to LC3B and in a PHB2‐independent manner.

- 293T cells were transfected with GFP‐LC3B, in the presence of control, ATAD3A‐Flag, or ATAD3B‐Flag. Forty‐eight hours after transfection, cell lysates were immunoprecipitated (IP) with anti‐Flag M2 affinity gel, followed by Western blotting using anti‐Flag or anti‐GFP antibodies.
- Control or Prohibitin2 knockdown (siPHB2) 293T cells were treated with OA (2.5 mM oligomycin, 250 nM antimycin A) for 4 h. Cell lysates were then incubated with GST‐ATAD3B(265‐648aa) (expressed in E. coli) coupled to glutathione agarose beads for GST pull‐down assay. Eluted protein samples were analyzed by Western blotting using antibodies against GST, LC3, or PHB2.
- HeLa expressing GFP‐LC3 monoclonal cell line was infected with lentivirus particles containing control, ATAD3B‐Flag, or ATAD3B (mLIR, Y604A/L607A)‐Flag. Five days later, cells were treated with DMSO, or 200 µM H2O2 for 2 h, then fixed and immune‐stained with anti‐Tom20 or anti‐Flag antibodies. Cells were analyzed by confocal microscopy. The white arrows indicate the LC3 punta colocalizing or contacting with Tom20 (mitochondria). Scale bar, 10 µm.
- Quantification of the GFP‐LC3 puncta colocalized or contacted with Tom20 in cells described in (C). Data are presented as mean ± SD (n = 30), and statistical significance was assessed by a two‐way ANOVA, N.S., not significant, ***P < 0.001.
Source data are available online for this figure.
Figure 4. ATAD3B directly binds to LC3B.

- 293T cells were treated with H2O2 for 2 h, and cell lysates were then immunoprecipitated with Dynabeads Protein G pre‐coupled with rabbit IgG (control) or anti‐ATAD3 antibody, followed by Western blotting with anti‐LC3B or anti‐ATAD3 antibodies.
- ATAD3 DKO HeLa cells expressing GFP‐LC3B were transiently transfected with control, ATAD3A‐Flag or ATAD3B‐Flag. 48 h after transfection, cell lysates were immunoprecipitated (IP) with anti‐Flag M2 affinity gel, and analyzed by Western blotting using anti‐Flag or anti‐GFP antibodies.
- HeLa cells were treated with 200 µM H2O2 for 2 h, and cell lysates were incubated with the indicated GST‐ATAD3A or GST‐ATAD3B protein fragments (expressed in E. coli) coupled to glutathione agarose beads (Pierce) for GST pull‐down assay. Eluted protein samples were analyzed by Western blotting using antibodies against GST or LC3B.
- The indicated GST‐ATAD3A or GST‐ATAD3B protein fragments and His‐LC3B were expressed in E. coli and purified. GST pull‐down assay was performed using glutathione agarose beads. Eluted protein samples were analyzed by Western blotting using anti‐GST or anti‐His antibodies.
- Protein sequence alignment of human ATAD3A and ATAD3B. Candidate LIR motifs (W/F/YxxL/I/V motifs) are depicted in red, and different amino acids are depicted in green. Because ATAD3A just contains 586 amino acids (aa), the 594–617aa of ATAD3A is not exist and thus not shown.
- The indicated GST‐ATAD3B(WT) or GST‐ATAD3B (LIR mutations) and His‐LC3 were expressed in E. coli and purified. GST pull‐down assay was performed using the glutathione agarose beads. Eluted protein samples were analyzed by Western blotting using antibodies against GST or LC3B.
- HeLa expressing GFP‐LC3 monoclonal cell line was infected with lentivirus particles containing control or shATAD3B. Five days later, cells were treated with DMSO, or 200 µM H2O2 for 2 h. Cells were fixed and immunostained with anti‐Tom20 and imaged by confocal microscopy. The white arrows indicate the LC3 puncta colocalizing or contacting with Tom20 (mitochondria). Scale bar, 10 µm.
- Quantification of the GFP‐LC3 puncta colocalized or contacted with Tom20 (mitochondria) in cells described in (G). Data are presented as mean ± SD (n = 30 cells from 3 coverslips), and statistical significance was assessed by a two‐way ANOVA, N.S., not significant, ***P < 0.001.
- 293T cells transiently transfected with control or ATAD3B‐Flag were treated with or without 200 µM H2O2 for 2 h. Cell lysates were then immunoprecipitated with Dynabeads Protein G pre‐coupled with anti‐Flag antibody, followed by Western blotting with anti‐Flag or anti‐LC3B antibodies.
- Relative protein levels of LC3B and ATAD3B‐Flag were further evaluated by densitometry analysis using ImageJ software. Quantification of the relative protein level of LC3B to ATAD3B‐Flag described in (I). Data are presented as mean ± SD (n = 3 independent experiments), and statistical significance was assessed by Student’s t‐test, **P < 0.01.
Source data are available online for this figure.
Because ATAD3B has a strong affinity for ATAD3A (Merle et al, 2012), we then investigated whether the interaction of ATAD3B with LC3B dependent on ATAD3A. We performed co‐immunoprecipitation assays from ATAD3 DKO HeLa cell extracts expressing GFP‐LC3B plus ATAD3A‐Flag or ATAD3B‐Flag. We found that ATAD3B, but not ATAD3A, interacts with LC3B in ATAD3 DKO cells (Fig 4B). Moreover, in vivo GST pull‐down assay showed that GST‐ATAD3B (265–648aa) binds to LC3B, but GST, GST‐ATAD3A (1–294aa), GST‐ATAD3A (313–586aa), or GST‐ATAD3B (1–246aa) fails to interact with LC3B from ATAD3 DKO cells (Fig 4C). We next sought to investigate whether ATAD3B directly interacts with LC3B. For this purpose, we expressed GST‐ATAD3A and GST‐ATAD3B fragments as well as His‐LC3B in E. coli, which were biochemically purified to perform in vitro GST pull‐down assays. We found that recombinant purified ATAD3B (265–648aa) directly binds to LC3B and that GST, GST‐ATAD3A (1–294aa), GST‐ATAD3A (313–586aa), and GST‐ATAD3B (1–246aa) fail to bind to LC3B (Fig 4D), demonstrating that ATAD3B, but not ATAD3A, directly interacts with LC3B.
Mitophagy receptors usually interact with LC3 through an LIR (LC3‐interacting region) motif, which is composed of an [W/F/Y]xx[L/I/V] core motif responsible for interacting with two hydrophobic pockets in the LC3 molecule (Birgisdottir et al, 2013). By amino acid analysis, we identified three classic LIR motifs (LIR‐1, LIR‐2, and LIR‐3) in ATAD3B, where LIR‐1 and LIR‐2 motifs are common to ATAD3A protein (Fig 4E). To test if the identified motif is a functional LIR, we mutated the core residues (Y345 and I348 in LIR‐1; Y447 and V450 in LIR‐2; and Y604 and L607 in LIR‐3) of LIR motifs to alanine. Further GST pull‐down assay in vitro revealed that mutations (Y604A/L607A) in the LIR‐3 of ATAD3B failed to bind to LC3B, but mutations in the LIR‐1 (Y345A/I348A) and LIR‐2 (Y447A/V450A) of ATAD3B did not affect the interaction with LC3B (Fig 4F), suggesting that ATAD3B LIR‐3 motif, but not LIR‐1 and −2, is responsible for interacting with LC3B. These data also explain why ATAD3A fails to bind to LC3B.
Prohibitin 2 (PHB2) is a mitochondrial inner membrane mitophagy receptor, which mediates mitophagy by binding to LC3 (Wei et al, 2017). We then investigated whether PHB2 affects the interaction between ATAD3B and LC3B. GST pull‐down assay in vivo (using cell lysates) revealed that PHB2 knockdown does not affect ATAD3B binding to LC3B (Fig EV3B).
Overall, ATAD3B acts as a mitophagy receptor to mediate mitophagy by directly binding to LC3B.
ATAD3B recruits LC3B into mitochondria upon oxidative stress
Upon specific physiological stress, mitophagy receptors can recruit LC3 to mitochondrial outer membrane and initiate mitophagy (Youle & Narendra, 2011; Liu et al, 2014). Therefore, we investigated whether ATAD3B recruits LC3B to mitochondria in response to oxidative stress. Immunostaining assay showed that GFP‐LC3B diffusely distributed in the cytoplasm of control HeLa cells (Fig 4G). However, upon H2O2 treatment, some co‐localization of GFP‐LC3B punta and Tom20 was observed in WT cells, and the co‐localization of GFP‐LC3B puncta and Tom20 was significantly decreased in ATAD3B KO HeLa cells (Fig 4G and H). In contrast, exogenous expression of ATAD3B‐Flag, but not ATAD3B‐Y604A/L607A(mLIR)‐Flag, markedly increased co‐localization of GFP‐LC3B puncta and Tom20 (Fig EV3C and D). These data suggest that ATAD3B recruits LC3B into mitochondria in H2O2 exposed cells. In addition, exogenous expression of ATAD3B‐Flag slightly increased the co‐localization (or contact) of GFP‐LC3B puncta and Tom20 (Fig EV3C and D), probably due to the slight amount of exogenous expressed ATAD3B‐Flag remaining at mitochondrial outer membrane (the effect of ATAD3B localization on recruiting LC3B will be described below). Furthermore, co‐immunoprecipitation experiments revealed that H2O2 treatment increased the interaction between ATAD3B and LC3B (Fig 4I and J). These findings demonstrate that ATAD3B mediates the recruitment of LC3B to mitochondria in response to oxidative stress.
ATAD3B locates at the outer mitochondrial membrane (OMM) upon oxidative stress
Most mitophagy receptors, including BNIP3, NIX, and FUNDC1, localize at mitochondrial outer membrane (Liu et al, 2014), whereas Prohibitin 2, a recently identified mitophagy receptor, distribute in mitochondrial inner membrane (Wei et al, 2017). ATAD3A C‐terminus locates at the mitochondrial matrix and interacts with mtDNA (He et al, 2007; Baudier, 2018). In silico prediction using HMMTOP and TMpred software, ATAD3A contains three transmembrane domains: TM1 (225–242aa), TM2 (247–264aa), and TM3 (348–367aa), where TM2 has the highest while TM3 has the lowest score (Fig EV4A). Moreover, TM1 and TM2 are predicted to function as mitochondrial outer and inner membrane anchor domain, respectively (Baudier, 2018). ATAD3B lacks the TM1 domain present in ATAD3A but encodes for TM2 (247–264aa) and TM3 (348–367aa) domains with a score similar to that of ATAD3A, high for TM2 and low for TM3. Moreover, ATAD3B encodes for a specific but weak TM4 (606–630aa) at the C‐terminus (Fig EV4A). Therefore, although ATAD3A and ATAD3B share a high degree of similarity (Appendix Fig S3A), they contain different transmembrane domains (Fig EV4A), indicating that compared with ATAD3A, ATAD3B might have a different distribution in mitochondria.
Figure EV4. Change of ATAD3B localization upon oxidative stress.

-
APrediction of human ATAD3A and ATAD3B protein domains using TMPred and HMMTOP software. (PRM, proline‐rich motif; CC1 and CC2, coiled‐coil domains; TM, transmembrane domain).
-
BMic10 KO COS7 cells stably expressing ATAD3A‐Flag or ATAD3B‐Flag were treated with DMSO or 4 mM 3‐NPA for 2 h, and immunostained with anti‐Tom20 or anti‐Flag antibodies. Immunostained cells were then visualized and imaged by confocal microscopy. Scale bar, 10 µm.
-
C–F293T cells treated with DMSO (C) or H2O2 (200 µM, 2 h) (E) were harvested for mitochondrial isolation. Purified mitochondria were treated with the indicated gradient concentration of proteinase K (0, 20, 30, 40, 50, 60 μg/ml) for 20 min on ice and then were analyzed by Western blotting with anti‐ATAD3, anti‐Tom20 (OMM), anti‐Tim23 (IMS), and anti‐HSP60 (matrix). Relative protein levels of proteins in (C) or (E) were further evaluated by densitometry analysis using ImageJ software. Relative trends of proteolysis of indicated mitochondrial proteins from DMSO‐ or H2O2‐treated cells were shown (D and F). Data are presented as mean ± SD (n = 3 independent experiments).
-
G293T cells were transiently transfected with control, ATAD3A‐Flag or ATAD3B‐Flag. Forty‐eight hours after transfection, cells were collected for CHIP‐Seq with anti‐Flag M2 affinity gel. Fold enrichment of the targeted genomic sequences over IgG was calculated as: 2‐(Ct CHIP ‐Ct IgG ), where CtCHIP and CtIgG are the mean threshold cycles of triplicate PCRs of DNA samples. Data are presented as means ± SD of three independent experiments. Statistical significance was assessed by Student’s t‐test, **P < 0.01.
-
HRepresentative structural modeling of ATAD3A, ATAD3B, and ATAD3A‐ATAD3B complex. The structures of ATAD3A and ATAD3B were predicted using I‐TASSER (Iterative Threading ASSEmbly Refinement). The RMSD (Root mean square deviation) between structures of ATAD3A and ATAD3B was calculated by Rosetta software. The binding sites were analyzed based on the first 10 low‐energy‐score‐optimized models.
-
I293T cells transiently transfected with control or ATAD3B‐Flag were treated with or without 200 µM H2O2 for 2 h. Cell lysates were immunoprecipitated (IP) with anti‐Flag M2 affinity gel, followed by Western blotting with anti‐Flag or anti‐ATAD3 antibodies.
-
JQuantification of the relative protein level of ATAD3A to ATAD3B‐Flag described in (E). Data are presented as mean ± SD (n = 3 independent experiments), and statistical significance was assessed by two‐tailed Student’s t‐test, **P < 0.01.
-
KHeLa cells were treated with DMSO, 200 µM H2O2, or 200 µM H2O2 plus 10 mM NAC for 2 h. Mitochondria isolated from cells were subjected to blue native PAGE (BN–PAGE) and were analyzed by Western blotting with anti‐ATAD3 or SDHA (loading control). SDS–PAGE and followed Western blotting data were shown at the right panel.
Source data are available online for this figure.
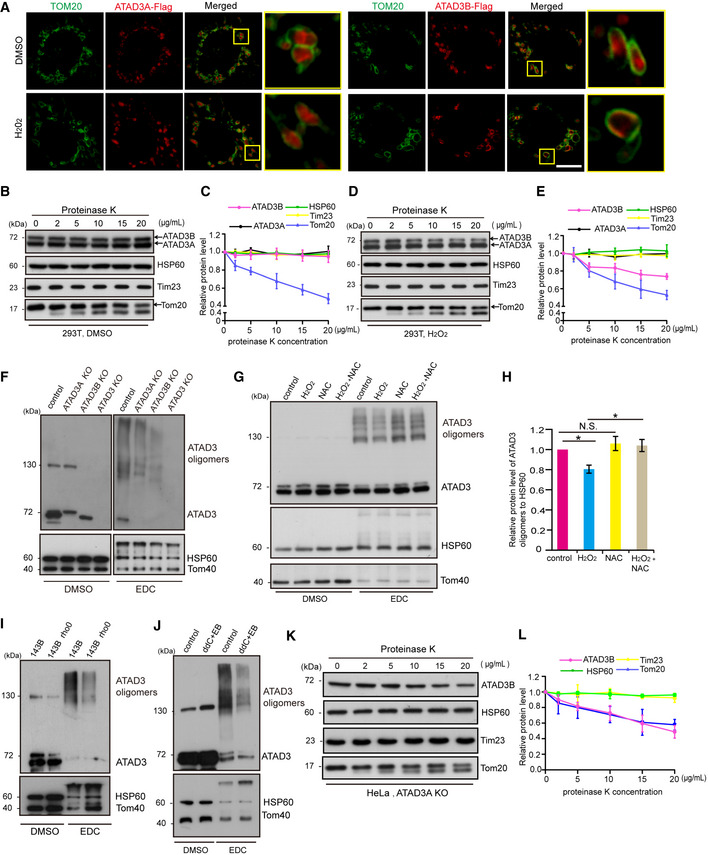
Therefore, we next investigated the localization of ATAD3B and ATAD3A in Mic10 KO COS7 cells expressing ATAD3A‐Flag or ATAD3B‐Flag. Mic10 KO COS7 cells contain enlarged spherical mitochondria (Fig 5A), in which mitochondrial matrix and outer membrane (or inner boundary membrane, IBM) are easily distinguished. Confocal microscopy analysis showed that under normal conditions, most ATAD3A‐Flag immunofluorescence localizes within the circle marked by Tom20 immunofluorescence, while a significant amount of ATAD3B‐Flag immunofluorescence co‐localizes with Tom20 immunofluorescence (Figs 5A and EV4B), indicating that while most ATAD3A‐Flag C‐terminus locates at the mitochondrial matrix, ATAD3B‐Flag C‐terminus distributes in the outer mitochondrial membrane (OMM), mitochondrial intermembrane space (IMS) or IBM. Moreover, in response to H2O2 or 3‐NPA treatment, we observed a robust increase in the amount of ATAD3B‐Flag that co‐localizes with Tom20, but the localization of ATAD3A remained unchanged (Figs 5A and EV4B). These findings suggest that upon H2O2 or 3‐NPA treatment, a certain level of ATAD3B‐Flag, but not ATAD3A‐Flag, may localize at the mitochondrial outer membrane.
Figure 5. The localization of ATAD3B upon oxidative stress.
-
AMic10 KO COS7 cells stably expressing ATAD3A‐Flag or ATAD3B‐Flag were treated with DMSO or 200 µM H2O2 for 2 h, and then fixed and immunostained with anti‐Tom20 and anti‐Flag antibodies, and analyzed by confocal microscopy. Scale bar, 10 µm.
-
B–E293T cells treated with DMSO (B) or H2O2 (200 µM, 2 h) (D) were harvested for mitochondrial isolation. Purified mitochondria were treated with the indicated gradient concentration of proteinase K for 20 min on ice and then were analyzed by Western blotting with anti‐ATAD3, anti‐Tom20 (OMM), anti‐Tim23 (IMS), and anti‐HSP60 (matrix). Relative protein levels of proteins in (B) or (D) were further evaluated by densitometry analysis using ImageJ software. Relative trends of proteolysis of indicated mitochondrial proteins from DMSO‐ or H2O2‐treated cells were shown (C and E). Data are presented as mean ± SD (n = 3 independent experiments).
-
FControl, ATAD3A KO, ATAD3B KO, or ATAD3 DKO HeLa cells were harvested for mitochondrial isolation. Purified mitochondria were treated with DMSO or EDC (20 mM) for 30 min and then were analyzed by Western blotting with the indicated antibodies.
-
G293T cells were treated with DMSO, 200 µM H2O2, 10 mM NAC, or 200 µM H2O2 plus 10 mM NAC for 2 h. Cells were then harvested and used for mitochondrial isolation. Purified mitochondria were treated with DMSO or EDC (20 mM) for 30 min at 37°C and then were analyzed by Western blotting with the indicated antibodies.
-
HQuantification of the relative protein level of ATAD3 oligomers to HSP60 described in (F). Data are presented as mean ± SD (n = 3 independent experiments), and statistical significance was assessed by a one‐way ANOVA, N.S., not significant, *P < 0.05.
-
I143B, 143B ρ0 cells were harvested for mitochondrial isolation. Purified mitochondria were treated with DMSO or EDC (20 mM) for 30 min at 37°C and then were analyzed by Western blotting with the indicated antibodies.
-
J293T cells were treated with DMSO or ddC (50 µM) plus EB (0.5 µg/ml) for 10 days. Cells were then harvested and used for mitochondrial isolation. Purified mitochondria were treated with DMSO or EDC (20 mM) for 30 min at 37°C and then were analyzed by Western blotting with the indicated antibodies.
-
K, LATAD3A KO HeLa cells were harvested for mitochondrial isolation. Purified mitochondria were treated with the indicated gradient concentration of proteinase K for 20 min on ice, and then were analyzed by Western blotting with anti‐ATAD3, anti‐Tom20 (OMM), anti‐Tim23 (IMS), and anti‐HSP60 (matrix) (K). Relative protein levels of proteins in (K) were further evaluated by densitometry analysis using ImageJ software. Relative trends of proteolysis of indicated mitochondrial proteins from ATAD3A KO HeLa cells were shown (L). Data are presented as mean ± SD (n = 3 independent experiments).
Source data are available online for this figure.
Since confocal microscopy images could not distinguish OMM, IMS, and IBM, we further defined the submitochondrial location of ATAD3B using a protease digestion assay. Purified mitochondria were digested with different concentrations of proteinase K for 20 min. Under normal conditions, the proteolysis of ATAD3B and ATAD3A in low concentrations of proteinase K (≤ 20 μg/ml) was similar to that of Tim23 (IMS protein) and HSP60 (mitochondrial matrix protein) but not Tom20 (OMM protein) in 293T cells (Figs 5B and C, and EV4C and D), suggesting that ATAD3B localizes at the IMS or mitochondrial matrix but not OMM. However, upon H2O2 treatment, the proteolysis of ATAD3B but not ATAD3A was similar to that of Tom20 in low concentrations of proteinase K (≤ 20 μg/ml) (Figs 5D and E, and EV4E and F), indicating that part of ATAD3B locates at OMM during oxidative stress. Overall, upon oxidative stress, part of ATAD3B locates at OMM. It may be that, in response to oxidative stress, a certain extent of ATAD3B fails to be imported into the mitochondrial inner membrane, remaining at the OMM, and leading to exposure of its LIR motif to the cytoplasm and recruiting LC3.
Studies indicate that ATAD3A can act as a bridging factor to facilitate the transportation of PINK1 by binding to Tom40 and Tim23 (Jin et al, 2018). Therefore, we next investigated the relationship between ATAD3A and ATAD3B and assessed whether ATAD3A impairs the submitochondrial localization of ATAD3B. We found that both ATAD3A and ATAD3B bind to mtDNA (Fig EV4G). In addition, the prediction by I‐TASSER revealed that ATAD3A could bind to ATAD3B (Fig EV4H), and co‐immunoprecipitation analysis further confirmed that ATAD3A interacted with ATAD3B (Fig EV4I). Also, ATAD3A and ATAD3B can form hetero‐oligomers (Fig 5F), and ATAD3A or ATAD3B itself can also form homo‐oligomers (Fig 5F). Moreover, loss of ATAD3A or ATAD3B dramatically decreased ATAD3 oligomers (Fig 5F), suggesting that ATAD3A‐ATAD3B hetero‐oligomers are the primary forms of ATAD3 oligomers. In response to H2O2 treatment, we observed a decrease in ATAD3A‐ATAD3B interactions (Fig EV4I and J) and ATAD3 oligomers (Fig 5G and H), while NAC (N‐acetyl‐L‐cysteine, ROS scavenger) significantly inhibited the H2O2‐induced decrease of ATAD3 oligomers (Fig 5G and H). Moreover, ATAD3 oligomers markedly decreased in 143B rho0 cells or cells treated with ddC plus EB (Fig 5I and J), which lack mtDNA (Khozhukhar et al, 2018). In addition, BN–PAGE assay reveals that H2O2 treatment led to the decreased ATAD3 complexes (containing ATAD3 oligomers) (Fig EV4G), while NAC inhibited the decrease of ATAD3 complexes induced by H2O2 treatment (Fig EV4K). These data indicate that mtDNA damage or depletion impairs ATAD3 oligomerization. Moreover, proteinase K digestion assay revealed that, in ATAD3A KO HeLa cell, proteolysis of ATAD3B was also similar to that of Tom20 (Fig 5K and L), indicating that a certain extent of ATAD3B locates at the mitochondrial outer membrane in the absence of ATAD3A, and suggesting that ATAD3A facilitates the mitochondrial translocation of ATAD3B. These data further suggest that ATAD3A‐ATAD3B hetero‐oligomers are essential for the submitochondrial localization of ATAD3B. As for how oxidative stress affects the ATAD3A‐ATAD3B hetero‐oligomers and thus changes the submitochondrial localization of ATAD3B, it will be the focus of our future scientific work.
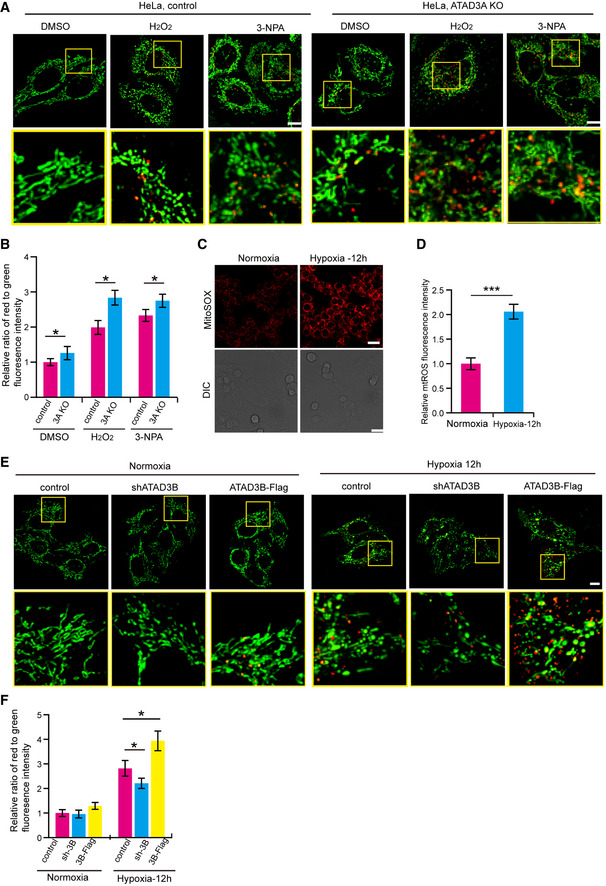
Since ATAD3A‐ATAD3B hetero‐oligomers affect submitochondrial localization of ATAD3B (Fig 5), we then used the mito‐Keima assay to investigate whether ATAD3A depletion affects ATAD3B‐promoted mitophagy under oxidative stress. ATAD3A KO exhibited a slightly increased mitophagy, and moreover, ATAD3A KO remarkably promoted H2O2‐, or 3‐NPA‐induced mitophagy (Fig EV5A and B). ATAD3A KO caused a slight mitophagy under normal conditions, probably because ATAD3A depletion (or dysfunction) itself leads to mitochondrial dysfunction (Baudier, 2018; Peralta et al, 2018; Dorison et al, 2020), which may induce slightly mitophagy. Also, ATAD3A KO remarkably promoted H2O2‐, or 3‐NPA‐induced mitophagy may due to the increased mitochondrial dysfunction and the increased ATAD3B localizing at the mitochondrial outer membrane. It should be noted that FUNDC1 and other mitophagy receptors, which locates at the mitochondrial outer membrane, do not induce mitophagy under normal conditions (Liu et al, 2014). Therefore, ATAD3B localizing at mitochondrial outer membrane caused by ATAD3A depletion may have little effect on inducing mitophagy under normal conditions, certain stimuli, such as H2O2 or 3‐NPA, are required for ATAD3B in promoting mitophagy.
Figure EV5. ATAD3B promotes hypoxia‐induced mitophagy.
-
AControl or ATAD3A KO HeLa cells stably expressing mito‐Keima were treated with DMSO, 4 mM 3‐NPA, or 200 µM H2O2 for 2 h. Then, cells were imaged with 458 nm (measuring mitochondria with a neutral pH) and 561 nm (measuring mitochondria with an acidic pH) laser excitation for mito‐Keima by confocal microscopy. Scale bar, 10 µm.
-
BQuantification of the relative ratio of red to green fluorescence intensity (561 nm/458 nm) of the cells described in (A). Data are presented as mean ± SD (n = 3 independent experiments, 20 cells per experiment), and statistical significance was assessed by two‐tailed Student’s t‐test, *P < 0.05.
-
C, DHeLa cells were cultured in normoxia or hypoxia (1% O2) for 12 h. Then, cells were stained with mitoSOX and analyzed by confocal microscopy (C). DIC, Differential Interference Contrast. Quantification of the MitoSOX fluorescence intensity was shown in the right panel (D). Data are presented as mean ± SD (n = 3 independent experiments, 20 cells per experiment), and statistical significance was assessed by Student’s t‐test, ***P < 0.001.
-
EHeLa cells stably expressing mito‐Keima were infected with shATAD3B or ATAD3B‐Flag. Then, cells were cultured in normoxia or in hypoxia (1% O2) for 12 h. Cells were imaged with 458 nm (measuring mitochondria with a neutral pH) and 561 nm (measuring mitochondria with an acidic pH) laser excitation for mito‐Keima by confocal microscopy. Scale bar, 10 µm.
-
FQuantification of the relative ratio of red to green fluorescence intensity (561 nm/458 nm) of the cells described in (A). Data are presented as mean ± SD (n = 3 independent experiments, 20 cells per experiment), and statistical significance was assessed by two‐tailed Student’s t‐test, *P < 0.05.
ATAD3B promotes hypoxia‐induced mitophagy
Hypoxia is associated with oxidative stress and induces mitophagy (Zhang & Ney, 2009; Solaini et al, 2010; Liu et al, 2012). We then investigated whether ATAD3B promotes hypoxia‐induced mitophagy. In response to hypoxia, mtROS (mitochondrial ROS) production was greatly increased in cells (Fig EV5C and D), suggesting that hypoxia leads to oxidative stress in cells. Moreover, mito‐Keima assay reveals that compared to control, ATAD3B knockdown led to a remarkable decrease of hypoxia‐induced mitophagy, and ATAD3B‐Flag expression caused a marked increase of hypoxia‐induced mitophagy (Fig EV5E and F). These data suggest that ATAD3B promotes hypoxia‐induced mitophagy.
mtDNA 3243A > G mutation induces endogenous oxidative stress and ATAD3B promotes the clearance of 3243A > G mutant mtDNA
Mitochondrial DNA mutations or deletions can lead to mitochondrial dysfunction resulting in a variety of mitochondrial diseases. mtDNA 3243A > G (m.3243A > G) mutation is the major cause of the MELAS (mitochondrial encephalomyopathy, lactic acidosis, and stroke‐like episodes) syndrome, which is the most prevalent pathogenic mtDNA point mutation (Wallace, 1992; El‐Hattab et al, 2015). m.3243A > G impairs mitochondrial protein synthesis, causing amino acid misincorporation and electron transport chain defects (Sasarman et al, 2008). MELAS with m.3243A > G has been associated with increased oxidative stress because of defects of the electron transport chain (Hayashi & Cortopassi, 2015). We then explored whether m.3243A > G induces endogenous cellular oxidative stress. We have previously transferred the wild‐type and 3243A > G mutant mtDNAs from a heteroplasmic 3243A > G patient’s lymphoblastoid cell line into the ρo 206 cells devoid of mtDNA and selected a series of transmitochondrial cybrids (Li & Guan, 2010). We detected the mitochondrial ROS (mtROS) production in the stable heteroplasmic cybrid harboring 100% WT mtDNA (ρo 206_A cell line) or about 90% 3243A > G mutant mtDNA (ρo 206_B cell line). ρo 206_B cells displayed significantly increased mtROS level compared to ρo 206_A cells (Fig 6A and B), suggesting that m. 3243A > G mutation induces cellular oxidative stress.
Figure 6. ATAD3B promotes the clearance of 3243A > G mutated mtDNA.

- ρ0206_A and ρ0206_B cells were stained with mitoSOX and analyzed by confocal microscopy. DIC, Differential Interference Contrast. Scale bar, 25 µm.
- Quantification of the MitoSOX fluorescence intensity described in (A). Data are presented as mean ± SD (n = 3 independent experiments, 20 cells per experiment), and statistical significance was assessed by Student’s t‐test, **P < 0.01.
- Mitochondria carrying the 3243A > G mutation in the tRNA Leu(UUR) gene from the same MELAS myoblasts were transferred into ρ0 206 cell line to generate ρ0206_A (100% wild‐type mtDNA) and ρ0206_B (~90% m.3243A > G mtDNA) cell lines. ρ0206_A and ρ0206_B cell lysates were analyzed by Western blotting with anti‐ATAD3 or anti‐tubulin antibodies. Relative protein levels of proteins were further evaluated by densitometry analysis using ImageJ software. Quantification of the relative protein level of ATAD3B to tubulin was shown at right panels. Data are presented as mean ± SD (n = 3 independent experiments), and statistical significance was assessed by Student’s t‐test, ***P < 0.001.
- Normal or MELAS patient fibroblasts cell lysates were analyzed by Western blotting with anti‐ATAD3 or anti‐tubulin antibodies. Relative protein levels of proteins were further evaluated by densitometry analysis using ImageJ software. Quantification of the relative protein level of ATAD3B to tubulin was shown at right panels. Data are presented as mean ± SD (n = 3 independent experiments), and statistical significance was assessed by Student’s t‐test, ***P < 0.001.
- ρ0206_A, ρ0206_B, and ρ0206‐B cells pretreated with ddC (50 µM) plus EB (0.5 µg/ml) for 10 days and then harvested and lysed. Cell lysates were analyzed by Western blotting with anti‐ATAD3 or anti‐GAPDH antibodies.
- ρ0206_B cells were infected with control, ATAD3B‐Flag or ATAD3B (mLIR)‐Flag. After 2 weeks, total DNA from cells was isolated and used to calculate the mutation rate of 3243A > G by quantitative real‐time PCR using the Taq‐Man Probe. Data are presented as mean ± SD (n = 3 independent experiments), and statistical significance was assessed by a one‐way ANOVA, N.S., not significant, *P < 0.05.
- ρ0206_B cells were infected with control, ATAD3A‐Flag, ATAD3B‐Flag, or ATAD3B (mLIR)‐Flag. After 2 weeks, the cellular ATP levels were measured. Data are presented as mean ± SD (n = 3 independent experiments), and statistical significance was assessed by a one‐way ANOVA, N.S., not significant, *P < 0.05.
- MELAS patient fibroblasts were infected with control, ATAD3A‐Flag, ATAD3B‐Flag, or ATAD3B(mLIR)‐Flag. After 2 weeks, total DNA was isolated from fibroblasts and used to calculate the mutation rate of 3243A > G by quantitative real‐time PCR using the Taq‐Man Probe. Data are presented as mean ± SD (n = 3 independent experiments), and statistical significance was assessed by a one‐way ANOVA, N.S., not significant, **P < 0.01.
- The mode of ATAD3B localization. Under normal conditions (a), ATAD3B‐ATAD3A hetero‐oligomers are formed (cysteine–cysteine interaction may contribute to the formation of ATAD3B‐ATAD3A hetero‐oligomers), and ATAD3B C‐terminus goes across the mitochondrial inner membrane and locates at mitochondrial intermembrane space with the support of ATAD3A; upon oxidative stress (b), ATAD3B‐ATAD3A hetero‐oligomers are impaired, and ATAD3B C‐terminus locates at mitochondrial outer membrane for recruiting LC3. OMM (outer mitochondrial membrane), IMM (inner mitochondrial membrane).
Source data are available online for this figure.
It is expected that 3243A > G mutated mtDNA could be cleared by ATAD3B since m. 3243A > G induces oxidative stress. We then assessed the expression of ATAD3B in different cell lines. Compared to ρo 206_A cell line, ρo 206_B cell line (~90% m.3243A > G mutant cell line) had a dramatic decrease in the expression of endogenous ATAD3B (Fig 6C). Moreover, MELAS patient‐derived fibroblasts (human fibroblasts obtained from a MELAS patient) had little expression of ATAD3B (Fig 6D). These results indicate that the lack of ATAD3B in human contributes to the accumulation of 3243A > G mutated mtDNA. In addition, removal of m.3243A > G mtDNA by treating cells with ddc plus EB for 10 days did not lead to the recovery of ATAD3B levels (Fig 6E). This finding suggests that cells expressing less ATAD3B tend to accumulate m.3243A > G mutant mtDNA, rather than accumulation of m.3243A > G mutant mtDNA leading to the reduced expression of ATAD3B. We next investigated whether the re‐expression of ATAD3B promotes the elimination of 3243A > G mutant mtDNA. We stably expressed control, ATAD3A‐Flag, ATAD3B‐Flag, or ATAD3B Y604A/L607A (mLIR)‐Flag in ρo 206_B cells or MELAS patient‐derived fibroblasts. After stably re‐expression of ATAD3B, the m.3243A > G mutant levels were analyzed by quantitative PCR (Taq‐Man Probe PCR). We found that ATAD3B‐Flag, but not ATAD3A‐Flag or ATAD3B (mLIR)‐Flag, significantly decreased the proportion of m.3243A > G mutant or increased the ATP level in ρo 206_B cells or MELAS patient‐derived fibroblasts (Fig 6F–H), suggesting that ATAD3B promotes the clearance of 3243A > G mutant mtDNA under m.3243A > G‐induced cellular endogenous oxidative stress.
Overall, our data suggest that m.3243A > G induces endogenous oxidative stress and ATAD3B prevents the accumulation of m.3243A > G mutation in cells.
Based on our findings, we propose a model of ATAD3B in clearing damaged mtDNA. Under normal conditions, ATAD3B interacts with ATAD3A to form hetero‐oligomers, which are imported into IMS or mitochondrial inner membrane, forming a previously undescribed ATAD3B‐ATAD3A‐mtDNA axis. However, upon oxidative stress or mtDNA damage (or loss), ATAD3B‐ATAD3A interaction and hetero‐oligomers are impaired (Figs 5G and H, and EV4I and J), leading to ATAD3B C‐terminus retention at the mitochondrial outer membrane and recruitment LC3B through a unique LIR motif (Fig 6I).
Discussion
Oxidative stress can cause remarkable mtDNA damage in a short period, and due to the low efficiency of mtDNA repair systems, it is unclear how cells remove oxidative stress‐induced damaged mtDNA to maintain homeostasis. In this study, we found that mitophagy plays a crucial role in eliminating oxidative stress‐induced damaged mtDNA. Moreover, we identified a new human‐specific mitophagy receptor, ATAD3B, which contains an LIR motif, recruiting LC3B to initiate mitophagy in a PINK1/Parkin‐independent manner to remove damaged mtDNA during oxidative stress.
Oxidative stress is one of the most common physiological stresses. Mitochondrial respiratory chains are the primary cellular source of ROS. ROS readily attacks mtDNA and leads to a variety of mtDNA lesions including oxidized mtDNA bases, abasic sites, and mtDNA strand breaks (Cui et al, 2012). Both mtDNA repair system and mtDNA degradation contribute to the clearance of oxidative stress‐induced mtDNA damage (Shokolenko et al, 2009). However, due to the low efficiency of the mtDNA repair system and mtDNA degradation, some other pathways are needed to remove oxidative stress‐induced damaged mtDNA. We showed that, besides causing mtDNA damage, H2O2 (the principal cellular mediator of oxidative stress) or 3‐NPA (the inducer of ROS) also induces mitophagy (Fig 1A–F, Appendix Fig S1G), promoting remarkable clearance of mtDNA damage (Fig 1C and D, Appendix Fig S1B). It has been reported that PINK1 dysfunction can still promote mitophagy by eliciting oxidative stress (Dagda et al, 2009), suggesting that there is a PINK1‐independent pathway responsible for oxidative stress‐induced mitophagy. In this study, we identified a novel human‐specific mitophagy receptor, ATAD3B, which mediates oxidative stress‐induced mitophagy in a PINK1‐Parkin‐independent manner and plays an essential role in removing H2O2 or 3‐NPA‐induced mtDNA lesions (Figs 2 and 3, Appendix Fig S4). Human ATAD3B and ATAD3A are highly homologous (Appendix Fig S3A). Compared with ATAD3A, ATAD3B protein harbors 62 additional amino acids at its C‐terminus, which contains an LIR motif that can recruit LC3 to initiate mitophagy (Fig 4).
In response to oxidative stress, a significant amount of mtDNA damage occurs; then, how cells recognize these damaged mtDNAs? While ATAD3A directly binds to mtDNA and participates in transcriptional regulation of mtDNA (He et al, 2007; He et al, 2012; Baudier, 2018), ATAD3B may indirectly bind to mtDNA via a hetero‐oligomerization with ATAD3A (Figs 5F and EV4C). Therefore, ATAD3B may sense mtDNA lesions through the ATAD3B‐ATAD3A‐mtDNA axis. In addition, damaged mtDNA results in mitochondrial dysfunction leading to increased ROS production, which could cause the decreased interaction between ATAD3B and ATAD3A and the change of ATAD3B localization, then causing activation of ATAD3B that subsequently induce mitophagy. Additionally, although UVC exposure leads to mtDNA damage, it did not lead to mitochondrial ROS production or changes in mitochondrial membrane potential, and no mitophagy was observed until 72 h post‐exposure (Bess et al, 2013), suggesting that different stresses‐induced damaged mtDNA may be removed by mitophagy through different pathways.
To induce mitophagy, besides activating mitophagy receptor, autophagy still needs to be activated. For example, Fundc1 (a mitophagy receptor) locates at the mitochondrial outer membrane and does not induce mitophagy under normal condition (Liu et al, 2012; Liu et al, 2014); upon hypoxia, autophagy is activated, then fundc1 recruits LC3 to initiate mitophagy (Liu et al, 2012; Liu et al, 2014). Similarly, CCCP not only induces PINK1 translocating to the mitochondrial outer membrane, but also induces autophagy (Narendra et al, 2010; Kwon et al, 2011), both of which contribute to mitophagy. In this study, ATAD3B binds to LC3B‐II (Fig 4C and I). In normal conditions or ATAD3A KO cells, autophagy is not activated, and LC3B mainly exists in the form of LC3B‐I (but not LC3B‐II). Upon oxidative stress (H2O2 or 3‐NPA treatment), autophagy is activated (Gao, 2019), and LC3B mainly exists in the form of LC3B‐II, which can be recruited by ATAD3B, leading to the initiation of mitophagy.
PINK1‐Parkin pathway plays a critical role in mitochondrial depolarization‐induced mitophagy (Youle & Narendra, 2011). Also, several mammalian proteins, including NIX, BNIP3, FUNDC1, FKBP8, and Prohibitin2, directly act as mitophagy receptors to mediate mitophagy (Liu et al, 2014; Bhujabal et al, 2017; Wei et al, 2017). Usually, PINK1/Parkin‐ or receptor‐mediated mitophagy removes the whole mitochondrion even if its mtDNA is intact and not damaged. We recently reported that Sam50 depletion results in mitophagy via a bit‐by‐bit mode that does not remove mtDNA (Jian et al, 2018), indicating that there are probably other mitophagy pathways that specifically regulate the clearance of mtDNA. We now identify a novel mitophagy receptor, ATAD3B, which connects to mtDNA by the ATAD3B‐ATAD3A‐mtDNA axis (Figs 5F and EV4G). Under normal conditions, probably due to binding to ATAD3A (Merle et al, 2012), the C‐terminus of ATAD3B locates at mitochondrial intermembrane space (Fig 5A–C). However, upon oxidative stress, the ATAD3B‐ATAD3A hetero‐oligomers are decreased (Fig 5G and H), leading to a certain level of ATAD3B to locate at mitochondrial outer membrane, exposing the LIR motif to the cytosol (Fig 5A, D and E). In addition, ATAD3A is involved in the regulation of mitochondrial structure and functions (Baudier, 2018; Peralta et al, 2018; Dorison et al, 2020). Although the expression of ATAD3A is markedly more than that of ATAD3B (Figs 4A and 6C), ATAD3A binds to lots of mitochondrial proteins (Baudier, 2018; Peralta et al, 2018; Dorison et al, 2020), probably causing just part of (not all) ATAD3A to interact with ATAD3B, and some ATAD3A may always not bind to ATAD3B due to the impairment of some other ATAD3A‐interacting proteins. Indeed, the co‐IP assay showed that just part of ATAD3A binds to ATAD3B‐Flag (overexpressed, the level is similar to ATAD3A) under normal conditions (Fig EV5E). In addition, the protein structure or modification (such as phosphorylation) of ATAD3A and ATAD3B may be changed upon H2O2 or 3‐NPA treatment, leading to de‐oligomerization of ATAD3A and ATAD3B. Although almost all mitophagy receptors locate at mitochondrial outer membrane, Levine laboratory reported that Prohibitin2 acts as a novel mitochondrial inner membrane mitophagy receptor that recruits LC3 depending on the rupture of mitochondrial outer membrane (Wei et al, 2017). Since oxidative stress can damage mitochondrial membranes, we cannot rule out the possibility that ATAD3B within mitochondrial inner membrane space still recruits LC3 to initiate mitophagy due to possible rupture of the mitochondrial outer membrane during oxidative stress.
mtDNA encodes the core subunits of mitochondrial OXPHOS that produces the majority of cellular ATP in mammalian. Excessive mtDNA mutations or deletions lead to dysfunction of OXPHOS, subsequently result in mitochondrial diseases including MELAS, KSS (Kearns‐Sayre Syndrome), and LHON (Leber hereditary optic neuropathy) (Tuppen et al, 2010). Many patients with a mitochondrial disease contain a mixture of the wild‐type (WT) and mutated mtDNA (called heteroplasmy). Typically, high percentage levels of mutated mtDNA (> 50%) are required to cause cellular defects, leading subsequently to the occurrence of mitochondrial diseases. Therefore, targeting mutated mtDNA to decrease the percentage levels of mutated mtDNA has been considered an efficient prevention and therapeutic strategy for mitochondrial diseases. Mitophagy is an efficient and selective cellular process that eliminates damaged or mutated mtDNA. However, the mere mtDNA mutations are insufficient to trigger mitophagy (de Vries et al, 2012). We found that m.3243A > G mutation directly induced endogenous oxidative stress. In addition, ATAD3B was little detected in m.3243A > G mutated cells and human MELAS patient‐derived fibroblasts (Fig 6C and D), which may explain why m.3243A > G mutation itself is insufficient to induce mitophagy. We then re‐expressed ATAD3B, a newly identified mitophagy receptor, in m.3243A > G mutated cells and human MELAS patient‐derived fibroblasts, and observed a significant reduction of the proportion of mutated and WT mtDNA (Fig 6F–H). Our data suggest that ATAD3B may be a good target for the prevention and therapy of mitochondrial diseases associated with mtDNA mutations.
By analysis of the phylogenetic tree, we found that while ATAD3A protein sequences are conserved across vertebrates, ATAD3B is only expressed in primates (Appendix Fig S2B). Moreover, ATAD3B is specifically expressed in human embryonic stem cells and cancer cells (Merle et al, 2012; Baudier, 2018). By further data analysis using the Human Proteome Map database, we found that ATAD3B is also moderately expressed in some adult human tissues such as frontal cortex, retina, liver, ovary, testis, pancreas, and B cells (Appendix Fig S3C). ATAD3A binds to mtDNA and is associated with the transcription of mtDNA (He et al, 2007; Baudier, 2018). However, the biological functions of ATAD3B were still unclear. Merle et al (2012) proposed that ATAD3B function as dominant‐negative for ATAD3A, but the endogenous level of ATAD3B is much lower than that of ATAD3A (Figs 4A and 6C), indicating that ATAD3B should have alternative functions. Human ATAD3B is highly similar to ATAD3A in protein sequence, but ATAD3B has additional 62 amino acids at the C‐terminus compared to ATAD3A (Appendix Fig S3A), and therefore, we hypothesized that ATAD3B C‐terminal might have novel biological functions. In agreement, we found that the C‐terminus of ATAD3B harbors an LIR motif, which binds to LC3 and promotes clearance of damaged mtDNA by mitophagy upon oxidative stress (Figs 2 and 4). These results demonstrate that primates have the evolutionary advantage of harboring a more precise regulation of mitophagy. Also, ATAD3B is highly expressed in human embryonic stem cells, indicating that homo species may have an evolutionary advantage in regulating mtDNA integrity during cell differentiation. The most fundamental factor for the occurrence of mtDNA mutation‐related mitochondrial diseases is the lack of removal of maternal mutated mtDNA that are distributed into the different tissues during reproductive development and stem cell differentiation. The persistence of high levels of mutated mtDNA in specific tissues results in the occurrence of mitochondrial diseases. Therefore, ATAD3B may be used for developing novel reproductive technologies to prevent mitochondrial diseases.
Materials and Methods
Cell culture, antibodies, and reagents
HeLa, 293T, HEK293, 143B, 143B rho0, MELAS fibroblasts, and MEFs cells were maintained in Dulbecco’s Modified Eagle Medium (DMEM) supplemented with 10% FBS (Gibco), 100 U/ml penicillin (Gibco), and 100 mg/ml streptomycin at 37°C with 5% CO2. rho0 206 (ρo 206) cells harboring 3243A > G mutant mtDNA were incubated with medium containing uridine (50 µg/ml, Sigma). Antibodies used in this study: anti‐ATAD3, anti‐Tom20, anti‐PHB2, anti‐Twinkle, anti‐TFAM, anti‐Tim23, and anti‐LONP1 were purchased from Proteintech; anti‐Cox2 and anti‐POLG were obtained from Abcam; anti‐ATG5 was purchased from ABclonal; anti‐GFP, anti‐HSP60, and anti‐tubulin were from Santa Cruz Biotechnology; anti‐PINK1 was from Novus Biologicals, anti‐LC3 and anti‐Flag were purchased from Sigma‐Aldrich; mouse monoclonal anti‐DNA was from Progen, mouse monoclonal anti‐8‐oxo‐dG was purchased from Jaica. Hydrogen peroxide, antimycin‐ A, 3‐NPA, and CCCP or FCCP were purchased from Sigma‐Aldrich, Lipo2000, Opti‐MEM, and PicoGreen were from Invitrogen, Oligomycin was obtained from Calbiochem.
Plasmids and shRNA constructions
Homo ATAD3A or ATAD3B cDNA was cloned into a modified pMSCV‐puro (Addgene) constructs containing a C‐terminal 3xFLAG tag. The shRNAs target sequences against human nucleoids and ATG5 were subcloned into a modified retroviral vector (pBN‐H1P, named by us) with the H1 promoter to drive the expression of shRNAs. The target sequences were listed in “Appendix Table S1”.
Construction of stable knockout cell lines
ATAD3A, ATAD3B knockout, or ATAD3 double knockout cell lines were all designed from the website crispr.mit.edu and generated by using CRISPR/Cas9 gene editing. Target sequences were listed in “Table S1”. Recombinant LentiCRISPR combining with plasmids VSV‐G and psPAX2 were transfected into 293T cells to generate lentiviral particles, which were used to infect HeLa cells for gene knockout. After infection, the cells were selected with puromycin and sorted into 96‐well dishes. After 2 weeks, the surviving clones were picked, expanded, and selected on the basis of ATAD3A or ATAD3B expression by Western blotting and genomic PCR to confirm the presence of frameshifting in the gene ATAD3A or ATAD3B.
Determination of DNA damage by quantitative PCR
Quantitative PCR (qPCR) assay of DNA damage is based on the principle that many kinds of DNA lesions (including mutations and deletions) can block or slow down the progression of DNA polymerase. Therefore, if equal amounts of DNA from differently treated samples are qPCR amplified under identical conditions, DNA with more lesions will amplify to a less extent than fewer damaged DNA. DNA damage can be expressed in terms of lesions per kilobase (kb) mathematically by assuming a Poisson distribution of lesions. The quantification of DNA damage was performed by qPCR according to previous reports (Santos et al, 2002; Hunter et al, 2010; Zhu & Coffman, 2017). DNA (mtDNA or nDNA) damage was quantified by comparing the relative efficiency of amplification of large DNA fragments (10 kb for mouse mtDNA, 6.6 kb for mouse nDNA, 8.9 kb for human mtDNA, 12.2 kb for human nDNA) of DNA from H2O2‐ and 3‐NPA‐treated samples to those of controls, and normalizing this to the amplification of smaller (< 250 bp) fragments, which have a statistically negligible likelihood of containing damaged bases. The resulting values are converted to relative lesion frequencies per 10 kb DNA (mtDNA or nDNA) by application of the Poisson distribution (lesions/amplicon = −ln(At /Ao); where At is the amplification of treated samples, and Ao represents the amplification of untreated controls).
qPCR was performed according to previous reports (Santos et al, 2006). Briefly, cells were seeded on the six‐well plates and cultured for 24 h. Cells were treated with DMSO, 4 mM 3‐NPA, or 100 µM‐200 µM H2O2 for 2 h, and then collected immediately, or washed and cultured with the fresh medium for an additional 1 h. Cells were collected and centrifuged 10 min at 600 g. Cell pellets were used for isolation of total DNA using the Tissue gDNA kit (Biomiga) according to the manufacturer’s instructions. All DNA samples were quantitated by PicoGreen staining using Micro Plate Reader and then diluted in TE buffer to equal concentrations of 3 ng/µl. 15 ng of each template was used for each reaction. Amplification of the human 8.9 kb mtDNA, human 12.2 kb nDNA, mouse 10 kb mtDNA, or mouse 6.6 kb nDNA segments were performed by PCR using the LA Taq kit (Takara) with 1 mM Mg2+. The primers used in this study were as described in “Appendix Table S2”. PCR conditions: (i) 94°C, 5 min; (ii) 94°C, 1 min; (iii) 55°C, 1 min; (iv) 68°C, 12 min; and repeat steps 2–4 for 17 cycles; (v) 68°C, 10 min. Detection of DNA damage required that amplification conditions must be met by keeping the PCR in the exponential phase, and thus, a PCR cycle test using various amounts of initial DNA from control samples (untreated or non‐damaged) was performed to determine quantitative conditions. The optimal number of cycles over which a “1/2 control” amount of template reduces amplification to ~50% was identified. Quantitation of each amplified product was performed by PicoGreen staining using Micro Plate Reader, and the blank value was subtracted.
Determination of mitochondrial DNA copy number by PCR
Total DNA of cells was extracted using the Tissue gDNA kit (Biomiga) according to the manufacturer’s instructions. A segment of mitochondrial genomic was routinely amplified as mtDNA copy number. All samples were quantitated by PicoGreen staining and diluted in TE buffer to equal concentrations of 3 ng/µl. 15ng of each template was added to the reaction. Amplification of a 117 bp mouse mtDNA or 221 bp human mtDNA segment was performed using the LA Taq (Takara) with 1 mM Mg2+. PCR conditions: (i) 94°C, 5 min; (ii) 94°C, 1 min; (iii) 58°C, 1 min; (iv) 68°C, 1 min; and repeat steps 2–4 for 17 cycles; (v) 68°C, 2 min. Quantitation of each amplified product was performed by PicoGreen staining using Micro Plate Reader. Primer sequences of PCR were listed in “Appendix Table S2”.
Quantitative real‐time PCR and Taq‐Man probe
Total DNA was extracted using the TissuegDNA kit (Biomiga) as the manufacturer’s instructions. The total DNA was used as templates for quantitative real‐time PCR (qRT–PCR) analysis using SYBR Green Supermix (Roche). The detection of mtDNA 3243G mutation level was performed as previously described (Rong et al, 2018) where a probe special for mt.3243G (mutant) was labeled at the 5′ end with 6‐carboxyfluorescein (6‐FAM) and at the 3′ end with a minor groove binding (MGB) moiety that increases the melting temperature (Tm) of the probe and stabilizes probe‐target hybrids. The PCRs were run using the Premix Ex Taq™ (Probe qPCR) (Takara), and the fold change was calculated using the 2‐ΔΔCT method. All PCR products were normalized to mtDNA copy number.
Measurement of ATP production
Briefly, cellular ATP levels were measured using Celltiter‐Glo Luminescent Cell Viability Assay (Promega) according to the manufacturer’s instructions. Luminescence was measured by Micro Plate Reader, and the values were normalized to the protein concentration assessed by BCA Kit (Beyotime Biotechnology).
Mito‐Keima mitophagy assay
HeLa, HEK293, and MEFs were infected with lentivirus containing mito‐Keima vector and grown for 5 days. Control, overexpression, or knockdown cells stably expressing mito‐Keima were trypsinized, washed once with PBS, and then resuspended in sorting buffer (145 mM NaCl, 5 mM KCl, 1.8 mM CaCl2, 0.8 mM MgCl2, 10 mM HEPES, 10 mM Glucose, 0.1% BSA), and analyzed by a BD flow cell sorter. Measurements of lysosomal mito‐Keima were made using dual‐excitation ratiometric pH measurements at 458 (pH 7) and 561 (pH 4) lasers with 620/29 nm and 614/20 nm emission filters, respectively. For each sample, 10,000 events were collected. Data were analyzed using FlowJo (Tree Star, San Carlos, USA). In addition, cells stably expressing mito‐Keima could be imaged by Leica confocal microscope. The mito‐Keima fluorescence intensity of cells was quantified, and 20 cells (from 3 to 10 images) were randomly selected for quantification in each experiment, and at least three experiments (replicates) were performed.
Western blotting
Briefly, cells were trypsinized, centrifuged and suspended in PBS with equal sample buffer (50 mM Tris–HCl pH 7.4, 1% Triton X‐100, 0.1% SDS, 150 mM NaCl, 1 mM EDTA, 1 mM PMSF, and 1 mM DTT), and heated at 105°C for 15 min. Equal amounts of samples were then loaded onto an SDS‐acrylamide gel and ran at 110 V for 1.5 h in running buffer (25 mM Tris, 192 mM glycine, and 0.1% SDS), following transferred to a PVDF membrane for 2 h. After blocking with TBST containing 5% skim milk at RT for 1 h, the membrane was then incubated with the primary antibodies, followed by HRP‐conjugated goat anti‐rabbit or anti‐mouse IgG.
GST pull‐down assay
GST‐tagged or His‐tagged plasmids were transformed in BL21 and shaken 180 rpm/min at 37°C overnight. The next day, 100 μl of each bacteria solution was inoculated into 10 ml new LB medium and shaken 220 rpm/min at 37°C. When the optical density reached 0.6–0.8, 1mM IPTG was added in each medium, then shaken 140 rpm/min at 16°C for another 24 h. The bacterium was collected and ultrasonically crushed using lysis buffer (150 mM Tris–HCl, 1% Triton X‐100, 300 mM NaCl, protease inhibitor mixture pH 7.4) on ice. Each supernatant was collected by centrifugation at 12,000 g for 10 min. Two purified proteins to be tested for interaction were incubated with Pierce Glutathione Agarose beads (Thermo Scientific) at 4°C for 2 h. Then, the beads were collected by centrifugation (2000 g, 2 min) and washed six times with lysis buffer containing 0.2% Triton X‐100 at 4°C. The products were recovered by boiling the beads in SDS sample buffer and analyzed by Western blotting.
Co‐immunoprecipitation
For co‐immunoprecipitation (co‐IP), all procedures were performed at 4°C. Cells were harvested and then pelleted at 1,000 g for 2 min. Following washed twice with PBS, the cells were resuspended with IP lysis buffer (150 mM NaCl, 10% glycerol, 20 mM Tris–HCl pH 7.4, 2 mM EDTA, 0.5% Triton X‐100, 0.5% NP‐40, and complete protease inhibitor) for 1.5 h. The nucleus and unbroken cells were removed by centrifugation at 12,000 g for 10 min, and the supernatant was collected. One‐tenth of the supernatant was taken out as “Input”, and the rest subsequently incubated with anti‐FLAG M2 affinity gel (Sigma‐Aldrich) or Pierce Glutathione Agarose beads at 4°C overnight. The beads were then washed six times with IP buffer containing 0.2% Triton X‐100, and the products were recovered by boiling the beads in SDS sample buffer and analyzed by Western blotting.
Immunostaining and imaging of confocal microscope
Briefly, cells were grown on coverslips in 12‐well plates and allowed to adhere at least 24 h. Cells were then fixed with 4% paraformaldehyde for 15–20 min at room temperature (RT), then permeabilized with 0.1% Triton X‐100 in PBS for 10 min, and blocked with 5% fetal bovine serum (FBS) in PBS for 2 h at RT. Cells were then incubated with primary antibodies for 2 h at RT, followed by secondary antibodies for 1 h at RT. Finally, cells were mounted and imaged by Leica confocal microscopy. The fluorescence intensity was quantified using ImageJ software, and the data were further analyzed by Microsoft Excel and GraphPad Prism 8. The 8‐oxo‐dG fluorescence intensity of cells was quantified, and 20 cells (from 3‐10 confocal images) were randomly selected for quantification in each experiment, and at least three experiments (replicates) were performed.
Mitochondria isolation and proteinase K digestion assay
Briefly, cells were collected and washed with PBS, and then, cell pellets were resuspended and homogenized with buffer A (83 mM sucrose, 10 mM MOPS, pH 7.2). After adding an equal volume of buffer B (250 mM sucrose, 30 mM MOPS, pH 7.2), the nucleus and unbroken cells were removed by centrifugation at 700 g for 5 min. Mitochondria were collected from the supernatant by centrifugation at 12,000 g for 5 min and washed once under the same conditions with buffer C (320 mM sucrose, 1 mM EDTA, 10 mM Tris–HCl, pH 7.4).
For proteinase K digestion assay, the purified mitochondria were divided equally into six parts and treated with the gradient concentrations (0, 2, 5, 10, 15, 20, 30, 40, 50, or 60 µg/ml) of proteinase K for 20 min on ice, subsequently, were added with equal volume sample buffer and boiled for 15 min at 105°C and then analyzed by Western blotting.
Statistical analysis
Quantitative data were obtained from images using ImageJ and GraphPad Prism was used to generate graphs. Fluorescence intensity of cells was quantified, and 20 cells (from 3 to 10 confocal images) were randomly selected for quantification in each experiment, and at least 3 experiments were performed. Statistical analysis was performed using Prism 8 (GraphPad Software). Data are presented as mean ± SD (n = 3 independent experiments). One‐way ANOVA, two‐way ANOVA, or Student’s t‐test was used to calculate P‐values. P < 0.05 was considered significant. Statistical significance is displayed as *P < 0.05, **P < 0.01, ***P < 0.001, and N.S.: not significant.
Author contributions
ZS and HH conceived, designed, and supervised the work. LS and CH performed most of the experiments and analyzed data. MX and JY performed gene knockdown and CRISPR/Cas9‐based gene knockout. BL, JL, HS, MG, and SE provided ρ0206_A, ρ0206_B, and MELAS patient fibroblasts, plasmids, and provided valuable recommendations. ZS, HH, and SE wrote the manuscript. All authors reviewed the manuscript.
Conflict of interest
The authors declare that they have no conflict of interest.
Supporting information
Review Process File
Appendix
Expanded View Figures PDF
Source Data for Expanded View and Appendix
Source Data for Figure 3
Source Data for Figure 4
Source Data for Figure 5
Source Data for Figure 6
Acknowledgements
This work is supported by the Ministry of Science and Technology of the People’s Republic of China (2018YFA0800700), National Natural Science Foundation of China (91854107, 31671393, and 31970711), and the Fundamental Research Funds for the Central Universities.
The EMBO Journal (2021) 40: e106283.
Data availability
This study includes no data deposited in external repositories.
References
- Acevedo‐Torres K, Berrios L, Rosario N, Dufault V, Skatchkov S, Eaton MJ, Torres‐Ramos CA, Ayala‐Torres S (2009) Mitochondrial DNA damage is a hallmark of chemically induced and the R6/2 transgenic model of Huntington's disease. DNA Repair 8: 126–136 [DOI] [PMC free article] [PubMed] [Google Scholar]
- Alexeyev M, Shokolenko I, Wilson G, LeDoux S (2013) The maintenance of mitochondrial DNA integrity–critical analysis and update. Cold Spring Harb Perspect Biol 5: a012641 [DOI] [PMC free article] [PubMed] [Google Scholar]
- Bacman SR, Williams SL, Pinto M, Peralta S, Moraes CT (2013) Specific elimination of mutant mitochondrial genomes in patient‐derived cells by mitoTALENs. Nat Med 19: 1111–1113 [DOI] [PMC free article] [PubMed] [Google Scholar]
- Baudier J (2018) ATAD3 proteins: brokers of a mitochondria‐endoplasmic reticulum connection in mammalian cells. Biol Rev Camb Philos Soc 93: 827–844 [DOI] [PubMed] [Google Scholar]
- Bess AS, Ryde IT, Hinton DE, Meyer JN (2013) UVC‐induced mitochondrial degradation via autophagy correlates with mtDNA damage removal in primary human fibroblasts. J Biochem Mol Toxicol 27: 28–41 [DOI] [PMC free article] [PubMed] [Google Scholar]
- Bhujabal Z, Birgisdottir AB, Sjottem E, Brenne HB, Overvatn A, Habisov S, Kirkin V, Lamark T, Johansen T (2017) FKBP8 recruits LC3A to mediate Parkin‐independent mitophagy. EMBO Rep 18: 947–961 [DOI] [PMC free article] [PubMed] [Google Scholar]
- Birgisdottir AB, Lamark T, Johansen T (2013) The LIR motif ‐ crucial for selective autophagy. J Cell Sci 126: 3237–3247 [DOI] [PubMed] [Google Scholar]
- Cui H, Kong Y, Zhang H (2012) Oxidative stress, mitochondrial dysfunction, and aging. J Signal Transduct 2012: 646354 [DOI] [PMC free article] [PubMed] [Google Scholar]
- Dagda RK, Cherra SJ 3rd, Kulich SM, Tandon A, Park D, Chu CT (2009) Loss of PINK1 function promotes mitophagy through effects on oxidative stress and mitochondrial fission. J Biol Chem 284: 13843–13855 [DOI] [PMC free article] [PubMed] [Google Scholar]
- Desai R, Frazier AE, Durigon R, Patel H, Jones AW, Dalla Rosa I, Lake NJ, Compton AG, Mountford HS, Tucker EJ et al (2017) ATAD3 gene cluster deletions cause cerebellar dysfunction associated with altered mitochondrial DNA and cholesterol metabolism. Brain 140: 1595–1610 [DOI] [PMC free article] [PubMed] [Google Scholar]
- Dorison N, Gaignard P, Bayot A, Gelot A, Becker PH, Fourati S, Lebigot E, Charles P, Wai T, Therond P et al (2020) Mitochondrial dysfunction caused by novel ATAD3A mutations. Mol Genet Metab 131: 107–113 [DOI] [PubMed] [Google Scholar]
- El‐Hattab AW, Adesina AM, Jones J, Scaglia F (2015) MELAS syndrome: clinical manifestations, pathogenesis, and treatment options. Mol Genet Metab 116: 4–12 [DOI] [PubMed] [Google Scholar]
- Filomeni G, De Zio D, Cecconi F (2015) Oxidative stress and autophagy: the clash between damage and metabolic needs. Cell Death Differ 22: 377–388 [DOI] [PMC free article] [PubMed] [Google Scholar]
- Gao Q (2019) Oxidative stress and autophagy. Adv Exp Med Biol 1206: 179–198 [DOI] [PubMed] [Google Scholar]
- Hayashi G, Cortopassi G (2015) Oxidative stress in inherited mitochondrial diseases. Free Radic Biol Med 88: 10–17 [DOI] [PMC free article] [PubMed] [Google Scholar]
- He J, Cooper HM, Reyes A, Di Re M, Sembongi H, Litwin TR, Gao J, Neuman KC, Fearnley IM, Spinazzola A et al (2012) Mitochondrial nucleoid interacting proteins support mitochondrial protein synthesis. Nucleic Acids Res 40: 6109–6121 [DOI] [PMC free article] [PubMed] [Google Scholar]
- He J, Mao CC, Reyes A, Sembongi H, Di Re M, Granycome C, Clippingdale AB, Fearnley IM, Harbour M, Robinson AJ et al (2007) The AAA+ protein ATAD3 has displacement loop binding properties and is involved in mitochondrial nucleoid organization. J Cell Biol 176: 141–146 [DOI] [PMC free article] [PubMed] [Google Scholar]
- Hiona A, Leeuwenburgh C (2008) The role of mitochondrial DNA mutations in aging and sarcopenia: implications for the mitochondrial vicious cycle theory of aging. Exp Gerontol 43: 24–33 [DOI] [PMC free article] [PubMed] [Google Scholar]
- Hunter SE, Jung D, Di Giulio RT, Meyer JN (2010) The QPCR assay for analysis of mitochondrial DNA damage, repair, and relative copy number. Methods 51: 444–451 [DOI] [PMC free article] [PubMed] [Google Scholar]
- Jian F, Chen D, Chen L, Yan C, Lu B, Zhu Y, Chen S, Shi A, Chan DC, Song Z (2018) Sam50 regulates PINK1‐Parkin‐mediated mitophagy by controlling PINK1 stability and mitochondrial morphology. Cell Rep 23: 2989–3005 [DOI] [PubMed] [Google Scholar]
- Jin G, Xu C, Zhang X, Long J, Rezaeian AH, Liu C, Furth ME, Kridel S, Pasche B, Bian XW et al (2018) Atad3a suppresses Pink1‐dependent mitophagy to maintain homeostasis of hematopoietic progenitor cells. Nat Immunol 19: 29–40 [DOI] [PMC free article] [PubMed] [Google Scholar]
- Katayama H, Kogure T, Mizushima N, Yoshimori T, Miyawaki A (2011) A sensitive and quantitative technique for detecting autophagic events based on lysosomal delivery. Chem Biol 18: 1042–1052 [DOI] [PubMed] [Google Scholar]
- Kazak L, Reyes A, Holt IJ (2012) Minimizing the damage: repair pathways keep mitochondrial DNA intact. Nat Rev Mol Cell Biol 13: 659–671 [DOI] [PubMed] [Google Scholar]
- Khozhukhar N, Spadafora D, Rodriguez Y, Alexeyev M (2018) Elimination of mitochondrial DNA from mammalian cells. Curr Protoc Cell Biol 78: 20.11.21‐20.11.14 [DOI] [PMC free article] [PubMed] [Google Scholar]
- Kujoth GC, Hiona A, Pugh TD, Someya S, Panzer K, Wohlgemuth SE, Hofer T, Seo AY, Sullivan R, Jobling WA et al (2005) Mitochondrial DNA mutations, oxidative stress, and apoptosis in mammalian aging. Science 309: 481–484 [DOI] [PubMed] [Google Scholar]
- Kwon KY, Viollet B, Yoo OJ (2011) CCCP induces autophagy in an AMPK‐independent manner. Biochem Biophys Res Comm 416: 343–348 [DOI] [PubMed] [Google Scholar]
- Lee SR, Han J (2017) Mitochondrial nucleoid: shield and switch of the mitochondrial genome. Oxidative Med Cell Longev 2017: 8060949 [DOI] [PMC free article] [PubMed] [Google Scholar]
- Li R, Guan MX (2010) Human mitochondrial leucyl‐tRNA synthetase corrects mitochondrial dysfunctions due to the tRNALeu(UUR) A3243G mutation, associated with mitochondrial encephalomyopathy, lactic acidosis, and stroke‐like symptoms and diabetes. Mol Cell Biol 30: 2147–2154 [DOI] [PMC free article] [PubMed] [Google Scholar]
- Liu L, Feng D, Chen G, Chen M, Zheng Q, Song P, Ma Q, Zhu C, Wang R, Qi W et al (2012) Mitochondrial outer‐membrane protein FUNDC1 mediates hypoxia‐induced mitophagy in mammalian cells. Nat Cell Biol 14: 177–185 [DOI] [PubMed] [Google Scholar]
- Liu L, Sakakibara K, Chen Q, Okamoto K (2014) Receptor‐mediated mitophagy in yeast and mammalian systems. Cell Res 24: 787–795 [DOI] [PMC free article] [PubMed] [Google Scholar]
- Merle N, Feraud O, Gilquin B, Hubstenberger A, Kieffer‐Jacquinot S, Assard N, Bennaceur‐Griscelli A, Honnorat J, Baudier J (2012) ATAD3B is a human embryonic stem cell specific mitochondrial protein, re‐expressed in cancer cells, that functions as dominant negative for the ubiquitous ATAD3A. Mitochondrion 12: 441–448 [DOI] [PubMed] [Google Scholar]
- Murakawa T, Yamaguchi O, Hashimoto A, Hikoso S, Takeda T, Oka T, Yasui H, Ueda H, Akazawa Y, Nakayama H et al (2015) Bcl‐2‐like protein 13 is a mammalian Atg32 homologue that mediates mitophagy and mitochondrial fragmentation. Nat Commun 6: 7527 [DOI] [PMC free article] [PubMed] [Google Scholar]
- Narendra DP, Jin SM, Tanaka A, Suen DF, Gautier CA, Shen J, Cookson MR, Youle RJ (2010) PINK1 is selectively stabilized on impaired mitochondria to activate Parkin. PLoS Biol 8: e1000298 [DOI] [PMC free article] [PubMed] [Google Scholar]
- Novak I, Kirkin V, McEwan DG, Zhang J, Wild P, Rozenknop A, Rogov V, Lohr F, Popovic D, Occhipinti A et al (2010) Nix is a selective autophagy receptor for mitochondrial clearance. EMBO Rep 11: 45–51 [DOI] [PMC free article] [PubMed] [Google Scholar]
- Ock CY, Kim EH, Choi DJ, Lee HJ, Hahm KB, Chung MH (2012) 8‐Hydroxydeoxyguanosine: not mere biomarker for oxidative stress, but remedy for oxidative stress‐implicated gastrointestinal diseases. World J Gastroenterol 18: 302–308 [DOI] [PMC free article] [PubMed] [Google Scholar]
- Peralta S, Goffart S, Williams SL, Diaz F, Garcia S, Nissanka N, Area‐Gomez E, Pohjoismäki J, Moraes CT (2018) ATAD3 controls mitochondrial cristae structure in mouse muscle, influencing mtDNA replication and cholesterol levels. J Cell Sci 131: jcs217075 [DOI] [PMC free article] [PubMed] [Google Scholar]
- Rong E, Wang H, Hao S, Fu Y, Ma Y (2018) Heteroplasmy detection of mitochondrial DNA A3243G mutation using quantitative real‐time PCR assay based on taqman‐MGB probes. Biomed Res Int 2018: 1286480 [DOI] [PMC free article] [PubMed] [Google Scholar]
- Santos JH, Mandavilli BS, Van Houten B (2002) Measuring oxidative mtDNA damage and repair using quantitative PCR. Method Mol Biol 197: 159–176 [DOI] [PubMed] [Google Scholar]
- Santos JH, Meyer JN, Mandavilli BS, Van Houten B (2006) Quantitative PCR‐based measurement of nuclear and mitochondrial DNA damage and repair in mammalian cells. Method Mol Biol 314: 183–199 [DOI] [PubMed] [Google Scholar]
- Sasarman F, Antonicka H, Shoubridge EA (2008) The A3243G tRNALeu(UUR) MELAS mutation causes amino acid misincorporation and a combined respiratory chain assembly defect partially suppressed by overexpression of EFTu and EFG2. Hum Mol Genet 17: 3697–3707 [DOI] [PubMed] [Google Scholar]
- Schon EA, DiMauro S, Hirano M (2012) Human mitochondrial DNA: roles of inherited and somatic mutations. Nat Rev Genet 13: 878–890 [DOI] [PMC free article] [PubMed] [Google Scholar]
- Shefa U, Jeong NY, Song IO, Chung HJ, Kim D, Jung J, Huh Y (2019) Mitophagy links oxidative stress conditions and neurodegenerative diseases. Neural Regenerat Res 14: 749–756 [DOI] [PMC free article] [PubMed] [Google Scholar]
- Shokolenko I, Venediktova N, Bochkareva A, Wilson GL, Alexeyev MF (2009) Oxidative stress induces degradation of mitochondrial DNA. Nucleic Acids Res 37: 2539–2548 [DOI] [PMC free article] [PubMed] [Google Scholar]
- Solaini G, Baracca A, Lenaz G, Sgarbi G (2010) Hypoxia and mitochondrial oxidative metabolism. Biochem Biophys Acta 1797: 1171–1177 [DOI] [PubMed] [Google Scholar]
- Suen DF, Norris KL, Youle RJ (2008) Mitochondrial dynamics and apoptosis. Genes Dev 22: 1577–1590 [DOI] [PMC free article] [PubMed] [Google Scholar]
- Tuppen HA, Blakely EL, Turnbull DM, Taylor RW (2010) Mitochondrial DNA mutations and human disease. Biochem Biophys Acta 1797: 113–128 [DOI] [PubMed] [Google Scholar]
- Van Houten B, Cheng S, Chen Y (2000) Measuring gene‐specific nucleotide excision repair in human cells using quantitative amplification of long targets from nanogram quantities of DNA. Mutat Res 460: 81–94 [DOI] [PubMed] [Google Scholar]
- de Vries RL, Gilkerson RW, Przedborski S, Schon EA (2012) Mitophagy in cells with mtDNA mutations: being sick is not enough. Autophagy 8: 699–700 [DOI] [PubMed] [Google Scholar]
- Wallace DC (1992) Diseases of the mitochondrial DNA. Annu Rev Biochem 61: 1175–1212 [DOI] [PubMed] [Google Scholar]
- Wallace DC, Chalkia D (2013) Mitochondrial DNA genetics and the heteroplasmy conundrum in evolution and disease. Cold Spring Harb Perspec Biol 5: a021220 [DOI] [PMC free article] [PubMed] [Google Scholar]
- Wang Y, Nartiss Y, Steipe B, McQuibban GA, Kim PK (2012) ROS‐induced mitochondrial depolarization initiates PARK2/PARKIN‐dependent mitochondrial degradation by autophagy. Autophagy 8: 1462–1476 [DOI] [PubMed] [Google Scholar]
- Wei Y, Chiang WC, Sumpter R Jr, Mishra P, Levine B (2017) Prohibitin 2 is an inner mitochondrial membrane mitophagy receptor. Cell 168: 224–238.e210 [DOI] [PMC free article] [PubMed] [Google Scholar]
- West AP, Shadel GS (2017) Mitochondrial DNA in innate immune responses and inflammatory pathology. Nat Rev Immunol 17: 363–375 [DOI] [PMC free article] [PubMed] [Google Scholar]
- Yakes FM, Van Houten B (1997) Mitochondrial DNA damage is more extensive and persists longer than nuclear DNA damage in human cells following oxidative stress. Proc Natl Acad Sci USA 94: 514–519 [DOI] [PMC free article] [PubMed] [Google Scholar]
- Yan C, Duanmu X, Zeng L, Liu B, Song Z (2019) Mitochondrial DNA: distribution, mutations, and elimination. Cells 8: 379 [DOI] [PMC free article] [PubMed] [Google Scholar]
- Youle RJ, Narendra DP (2011) Mechanisms of mitophagy. Nat Rev Mol Cell Biol 12: 9–14 [DOI] [PMC free article] [PubMed] [Google Scholar]
- Zhang J, Ney PA (2009) Role of BNIP3 and NIX in cell death, autophagy, and mitophagy. Cell Death Differ 16: 939–946 [DOI] [PMC free article] [PubMed] [Google Scholar]
- Zhu S, Coffman JA (2017) Simple and fast quantification of DNA damage by real‐time PCR, and its application to nuclear and mitochondrial DNA from multiple tissues of aging zebrafish. BMC Res Notes 10: 269 [DOI] [PMC free article] [PubMed] [Google Scholar]
Associated Data
This section collects any data citations, data availability statements, or supplementary materials included in this article.
Supplementary Materials
Review Process File
Appendix
Expanded View Figures PDF
Source Data for Expanded View and Appendix
Source Data for Figure 3
Source Data for Figure 4
Source Data for Figure 5
Source Data for Figure 6
Data Availability Statement
This study includes no data deposited in external repositories.