

Abstract
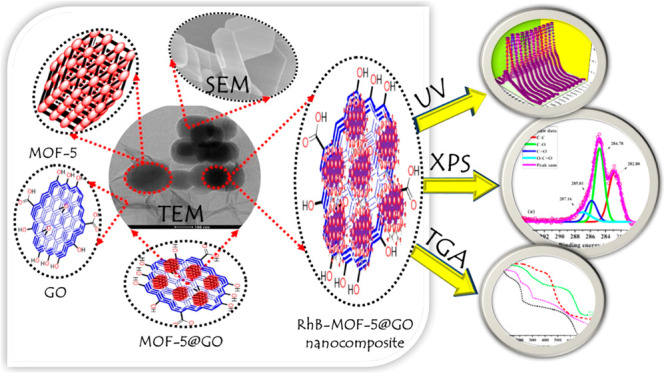
Herein, a metal–organic framework (MOF-5) is synthesized by a solvothermal process and graphene oxide (GO) is prepared from the improved Hummer’s method. The synthesis of MOF-5@GO nanocomposites is one-pot process via a grinding method and employed for the removal of Rhodamine B (RhB) dye. The removal efficiency of RhB is found to be 60.64% (151.62 mg·g–1) at 500 ppm. About 98.88% of RhB is removed within 5 min of contact time and increased up to 99.68% up to 10 min. The removal rate of MOF-5@GO nanocomposites is much better than that of pristine MOF-5. Equilibrium adsorption capacity is determined by a series of different experimental conditions such as pH, time, and concentration of dye solution. Although the results also showed that dye removal on MOF-5@GO nanocomposites is well described by the Langmuir isotherm (R2 = 0.9703), the adsorption kinetics data reveals pseudo-second-order (R2 = 0.9908). The synthesized nanocomposite is efficient for removal of dye, cost-effective, and reusable. Additionally, stability and self-degradation studies of pure RhB are reported in aqueous solution for up to 120 days at different pH values (pH 1–12).
1. Introduction
Rhodamine B (RhB) is a well-known cationic fluorescent dye that is widely used as a colorant in textiles, foodstuffs, scientific research, and pharmaceutical industries.1 It is toxic and harmful to human beings and animals, causes damage to skin, eyes, and respiratory tract, and causes gene mutations. Additionally, it is a well-known carcinogenic and neurotoxic material toward animals and humans.2 Worldwide, more than 10,000 textile dyes are used commercially with their yearly production exceeding ∼7 × 10⁵ metric tons,3 out of which about 2% (∼14 × 103 metric tons) of the annual dye production is discharged as an effluent from manufacturing units. Color is one of the clearest indicators of water pollution caused by the discharge of dye as a waste, which is responsible for the damage to water bodies, aesthetic pollution, eutrophication, and perturbations in aquatic life.4,5 RhB exists for a long time in a natural water body or aqueous medium. So, it is necessary to remediate dye from the aqueous solution. The remediation of dye from the aqueous medium is one of the most challenging tasks. Among the several purification techniques, adsorption process has been verified to be one of the best and simplest techniques for eliminating pollutants from water bodies. The advantages of the adsorption process are its cost-effectiveness, accuracy, remarkable versatility, simplicity in design, safety of operation, high efficiency, and adsorbent reusability.6−8 There are many reports where a variety of substrates are used for adsorption of dye from wastewater such as Cu-MOF,9 modified 1-hydroxybenzotriazole (HBT),10 alumina oxides,11 Fe3O4@l-arginine,12 porous silica beads,13 carbon nanotubes14 (CNT), carbon-based materials,15 and graphene oxide16 (GO); however, in these cases, there is poor sorption capacities, multi-step synthesis, and low sorption rates. Therefore, MOFs/GO-based nanocomposites are potential material for the adsorption of dye due to easy modification of surface, low toxicity, and large surface area. Consequently, there is an urgent need for these types of nanocomposite materials that can adsorb toxic dye more efficiently. The cationic dye (RhB) is known to be better adsorbed on the graphene oxide via strong interactions from negatively charged oxygenated functional groups.17,18 Already available adsorbents are not only expensive but also difficult to handle and redevelop after use. Meanwhile, metal–organic frameworks (MOFs) are highly ordered crystalline coordination polymers and one of the most fascinating classes of adsorbent,19 having the advantages of high surface area, porosity, excellent absorbability, good catalytic activity, and controlled modification synthesis.20 Additionally, MOFs are promising candidates for a variety of applications such as dye adsorption, energy storage, catalysis, and gas separation.21 In the case of MOF-5, formerly described in 1999, it is made up of ZnO4 units connected by a 1,4-benzenedicarboxylate linker to form an amazing cubic network. The first series of MOF-5 reported in 2002 is cubic in shape.22 The increased catalytic activity, conductivity, and surface area of MOFs needed to be combined with other materials such as mesoporous silica/MOF, mesoporous alumina/MOF, and MOF/graphene have been reported for adsorption.23−29 Furthermore, carbon-based materials including activated carbon, CNT, and GO have also been incorporated with MOFs to improve the adsorptive properties of composite materials.30 Owing to their remarkable chemical and physical characteristics, MOFs/GO-based nanocomposite materials are in tremendous demand for adsorption of dye.31,32 In the last 10 years, the excellent and exclusive chemical, electrical, and mechanical characteristics of graphene oxide have attracted remarkable interest.33 The process of chemical modification of graphene and graphene oxide includes covalent binding and non-covalent binding.34 The structure of graphene is extremely stable, the bond between each carbon atom is strong, and the connection between carbon atoms via a covalent bond is strong. Graphene has a simpler synthetic process and lower production cost as compared to other carbon-based materials. GO is a two-dimensional material with hexagonal shape and has well-developed functional groups that contain oxygen moieties. However, these oxygen-containing groups may increase catalytic activity, increase stability, and are also according to the requirements that need chemical modification.35 GO is readily dispersed in water and some other polar solvents due to its hydrophilic character, water stability, and solution dispersibility.36 A series of MOF@GO composites of excellent adsorption capacity has been recorded by the Bandosz group.24,37 However, the possible interactions between GO and MOF-5 composites enhance the hydrophobic stability of the MOF-5 framework.38,39 MOF-5 also has the characteristic problem due to lack of stability in water. The development of MOF-GO composites occurs through interactions between oxygen groups of GO and the metallic centers of MOFs by chemical bonding or electrostatic interaction.40,41 Therefore, to resolve its shortcomings, the combination of MOF-5 with GO is largely necessary. However, there are needs for MOF-5@GO nanocomposites such as one-step synthesis, ambient reaction conditions, potential for catalyst recovery, recyclability, and efficient and successful adsorbents for RhB in the treatment of wastewater. This is a simple and solvent-free synthetic process to minimize environmental pollution. Herein, we report a one-step synthesis of MOF-5@GO nanocomposites employed for adsorption kinetic studies of RhB. Additionally, the effect of MOF-5 and GO ratio (1:1, 1:2, and 2:1) with pH, contact time, and concentration of RhB on the adsorption performance is also studied. Moreover, adsorption kinetics and adsorption isotherms are well described along with the plausible mechanism of RhB adsorption onto MOF-5@GO nanocomposites. The stability and self-degradation studies of RhB (up to 120 days) at different pH values (pH 1–12) are also reported.
2. Results and Discussion
2.1. FTIR and XRD Study
The FTIR and XRD spectra of pristine GO, MOF-5, MOF-5@GO, and RhB-MOF-5@GO nanocomposites are given in Figure 1. The FTIR spectrum of GO exhibits strong characteristics bands at 3414, 1734, 1618, 1224, 1041, and 866 cm–1 (Figure 1a(i)). The typical peaks found in GO are the hydroxyl group of −OH stretching vibrations at 3414 cm–1, the carbonyl or carboxylic moiety of C=O stretching frequency at 1734 cm–1, the aromatic stretching frequency of C=C present at 1618 cm–1, and the stretching vibration of C–O epoxy found at 1224 cm–1. The C–O alkoxy stretching vibration appeared at 1041 cm–1, and the epoxy or peroxide functional group occurred at 866 cm–1 of GO.42 The pure MOF-5 shows two strong bands present at 1657 and 1599 cm–1 corresponding to the C=O and C–O stretching vibration of the aromatic ring of terephthalic acid. The stretching frequency of C–H is found at 1387 cm–1, although the characteristics peaks were found at 1200–600 cm–1 out-of-plane vibrations of an aromatic ring of terephthalic acid of the MOF-5 framework.43 The absorption band appears at 530 cm–1 can be assigned to the Zn–O stretching frequency as shown in Figure 1a(ii). FTIR spectra of MOF-5@GO nanocomposites show that the majority of peaks for GO and MOF-5 are retained and there was no significant change. It was also proven that GO did not affect the property of MOF-5, as given in Figure 1a(iii). FTIR spectra of RhB are shown in Figure 1a(iv), and the absorption band displayed at 1683 cm–1 can be assigned to the stretching frequency of C=O. The peaks at 2985 cm–1 indicated the stretching band of −CH. The peaks at 1586 cm–1 were attributed to the stretching vibration of the aromatic benzene ring of C=C. The functional group of RhB shows peaks at 1403 (−CH3), 1327 (C=N), and 991 cm–1 for the C–H group. The RhB-adsorbed MOF-5@GO nanocomposite is shown in Figure 1a(v).
Figure 1.

FTIR spectra of (a) (i) GO, (ii) MOF-5, (iii) MOF-5@GO, (iv) RhB, and (v) RhB-MOF-5@GO nanocomposites. XRD pattern of (b) MOF-5 standard and (c) (i) graphite powder, (ii) GO, (iii) MOF-5, (iv) MOF-5@GO, and (v) RhB-MOF-5@GO nanocomposites. (d, e) FTIR and XRD of as-synthesized nanocomposites and after water immersion for up to 7 days.
The adsorption band slightly shifted, and the obtained bands are found at 2977, 1685, 1586, 1549, 1389, 1294, 932, and 757 cm–1, which may be hydrogen bonding and confirm the RhB adsorbed on MOF-5@GO nanocomposites.44 The Zn–O band is shifted and found to be 494 cm–1 due to interactions with water, GO, and RhB. However, after being immersed in water up to 5 days, the MOF-5@GO nanocomposite did not lose its crystallinity. Additionally, some interactions from oxygenated functional groups of graphene oxide with vacant sites of the zinc cluster of MOF-5 maintain the crystallinity as well as increase the conductivity of MOF-5 and enhanced the adsorption properties, and this is consistent with a previous study.45 Furthermore, the FTIR spectrum of MOF-5@GO nanocomposites in water is observed up to the 7th day, which is represented in Figure 1c. Subsequently, the interactions of the −OH group of the water molecule from vacant sites of the zinc cluster may create some disorderness of MOF-5 by breaking of the Zn–O bond between the metal cluster and organic linker.
The XRD pattern of graphite, GO, MOF-5, MOF-5@GO, and RhB-MOF-5@GO nanocomposites is shown in Figure 1c. Graphite shows a characteristic sharp peak at 2θ = 26.5° attributed46 to ⟨002⟩ as shown in Figure 1c(i). Furthermore, GO shows typical peaks in Figure 1c(ii) for planes ⟨001⟩ and ⟨100⟩ at 2θ = 10.3° and 46.3°, respectively. Pure MOF-5 has shown crystalline peaks, which find 2θ values at 6.82, 9.65 13.65, 15.30, 20.59, 22.36, 24.71, 31.31, and 32.13 for crystal planes ⟨200⟩, ⟨220⟩, ⟨400⟩, ⟨420⟩, ⟨531⟩, ⟨533⟩, ⟨551⟩, ⟨751⟩, and ⟨911⟩, respectively, as depicted in Figure 1c(iii). The MOF-5@GO shows diffraction peaks detected at 2θ at 10.12, 15.61, 18.55, 20.58, 25.95, 27.27, 28.39, 30.31, 31.12, 32.34, 34.06, and 43.80, and these peaks are slightly shifted as compared to pure MOF-5 but do not distort the crystalline nature after the combination of GO as shown in Figure 1c(iv). The RhB-adsorbed MOF-5@GO nanocomposite shows similar diffraction peaks for MOF-5@GO nanocomposites, which is shown in Figure 1c(v). The adsorbed molecule RhB is not crystalline, it is amorphous. Furthermore, XRD results show that the crystalline nature of MOF-5@GO nanocomposites did not distort up to the 5th day of MOF-5@GO nanocomposites47 as shown in Figure 1e. However, after 7 days, the crystallinity of MOF-5@GO nanocomposites was lost and might be some distorted after being immersed in water due to strong interactions from the free vacant d-orbital of the zinc metal cluster,48,49 as given in Figure 1d.
2.2. X-ray Photoelectron Spectroscopy (XPS) Studies
The synthesized GO, MOF-5, and MOF-5@GO nanocomposites were further studied via XPS to define the chemical states of different aspects and the presence of functional groups.50,51 The deconvoluted high-resolution XPS C1s region spectra of GO and MOF-5 are displayed in Figure 2a,b, respectively. The C1s spectra of pristine GO have characteristic peaks at binding energies of 282.80, 284.78, 285.81, and 287.16 eV, representing C–C, C−O, and O—C=O, and C=O respectively (Figure 2a). Similarly, the high-resolution XPS of the C1s region spectra of MOF-5 (Figure 2b) have peaks with binding energies of 284.91, 286.0, and 288.86 eV, which can be attributed to C–C, C=O, and O—C=O, respectively. Figure 2c illustrates the XPS of O1s of GO where peaks at binding energies of 529.55, 530.59, 531.34, and 531.62 eV represent O—C=O, C=O, C–OH, and C–O–C, respectively. Moreover, the deconvoluted O1s of MOF-5 as shown in Figure 2d depicts peaks at binding energies of 529.91 and 531.49 eV representing O—C=O and C=O, respectively. Furthermore, peaks at binding energies of 1045.13 and 1022.07 are attributed to Zn2p1/2 and Zn2p3/2 as represented in Figure 2e. The full spectra of GO, MOF-5, and MOF-5@GO nanocomposites clearly showing the presence of carbon, oxygen, and zinc metal are represented in Figure 2f.
Figure 2.

High-resolution XPS of (a) C1s of GO, (b) C1s of MOF-5, (c) O1s of GO, (d) O1s of MOF-5, and (e) Zn2p metal. (f) Survey XPS spectra of (i) GO, (ii) MOF-5, and (iii) MOF-5@GO nanocomposites.
2.3. Thermogravimetric Analysis
GO, MOF-5, and RhB-MOF-5@GO nanocomposites were characterized by thermogravimetric analysis (TGA) and are shown in Figure 3. GO shows four weight loss results between 25 and 600 °C as shown in Figure 3a(i). The first weight loss observed between 25 and 106 °C (17.07%) can be assigned to the removal of physically adsorbed water. The second weight loss between 106 and 183 °C (9.39%) is attributed to the removal of labile oxygen-containing functional groups. The third weight loss between 183 and 220 °C (24.3%) indicates the decomposition of stable oxygen functionalities. The fourth weight loss between 220 and 600 °C (27.68%) is due to the full collapse of GO.
Figure 3.

(a) (i) GO, (ii) MOF-5, (iii) RhB, and (iv) RhB-MOF-5@GO nanocomposites. (b) RL values.
There are four weight loss results of MOF-5 depicted in Figure 3a(ii). The weight loss between 25 and 119 °C (2.67%) is due to the removal of physically adsorbed water. The weight loss between 119 and 215 °C (15.62%) is attributed to the removal of N,N-dimethylformamide. The weight loss between 215 and 330 °C (13.1%) is due to the partial decomposition of the MOF-5 frameworks. The weight loss between 330 and 524 °C (41.79%) is due to the collapse of the framework52 of MOF-5 and constant up to 600 °C.
RhB shows three weight loss results between 176 and 600 °C and stability up to 176 °C. The first weight loss between 176 and 215 °C (4.07%) is attributed to the removal of water, the second weight loss between 215 and 300 °C (8.89%) is credited to the removal of the oxygen functionality group, and the third weight loss between 300 and 600 °C (65.22%) is attributed to aromatic containing groups as illustrated in Figure 3a(iii).
In the case of RhB-MOF-5@GO nanocomposites, there are five weight loss results. The first weight loss between 25 and 99 °C (7.32%) indicates the loss of physically adsorbed water. The second weight loss between 97 and 167 °C (4.07%) indicates the loss of oxygen functionality of the surface of GO sheet. The third weight loss between 167 and 215 °C (12.76%) is due to the DMF molecule as well as the stable oxygen functionality of GO and RhB functional groups, and the fourth weight loss between 215 and 300 °C (18.28%) is attributed to the partial decomposition of the MOF-5 frameworks, GO, and RhB functional groups, while the fifth weight loss between 300 and 600 °C (23.57%) can be attributed to the full decomposition of RhB-MOF-5@GO nanocomposites as shown in Figure 3a(iv).
2.4. Surface Area Analysis
The N2 adsorption–desorption isotherm of GO (Figure S2a), MOF-5 (Figure S2b), and MOF-5@GO nanocomposites (Figure S2c) is shown in the Supporting Information. The MOF-5@GO nanocomposite of the surface area is found to be 135.37 m2 g–1, indicating the successful reaction with GO and MOF-5. The surface area of the MOF-5 is 29.95 m2 g–1, which is greater than that from the literature, which is given as 12.35 m2 g–1.53 This value is too low due to air exposure during the treatment, and the perfect BET surface area of MOF-5 as reported by the group of Yaghi54 reached up to 2900 m2 g–1. The surface area of GO is found to be 9.45 m2 g–1. The specific surface area of the synthesized nanocomposite material is increased due to the combination of MOF-5 and GO. The calculated results indicate that the average pore size of the MOF-5@GO nanocomposite is found to be 0.014 nm. The higher surface area and pore volume of MOF-5@GO nanocomposites can afford extra possible sites for adsorption reactions. The MOF-5@GO nanocomposite displays a type III curve and H3 hysteresis loop, and this indicates that the MOF-5@GO nanocomposite is shown as a mesoporous structure with a relatively high surface area.
2.5. Morphological Characterization
The morphologies of nanocomposite are studied by HRTEM and FESEM, and illustrations of the pristine GO sheet, pure MOF-5, and RhB-adsorbed MOF-5@GO nanocomposites are shown in Figure 4. The FESEM image of GO shows that it is a typical sheet-like randomly aggregated thin crumpled layer structure as shown in Figure 4a. The FESEM image of pure MOF-5 depicts a stacked elongated hexagonal structure as shown in Figure 4b. However, in the FESEM image in Figure 4c and HRTEM image in Figure 4d of RhB-MOF-5@GO nanocomposites, MOF-5 formed an irregularly shaped structure of 50–200 nm instead of an elongated hexagon, and this might be due to the facile synthesis of the nanocomposite. Furthermore, energy-dispersive X-ray spectroscopy (EDS) of RhB-adsorbed MOF-5@GO nanocomposites shows the elemental composition as well as mapping of elements such as C, O, N, Cl, and Zn as given in the Supporting Information, i.e., Figure S3a–g.
Figure 4.

FESEM monograph of (a) GO, (b) MOF-5, and (c) RhB-MOF-5@GO. (d) HRTEM image of RhB-MOF-5@GO nanocomposites.
2.6. Influence of Process Variable on Adsorption
2.6.1. Effect of pH on RhB
The absorbance spectra of the RhB were recorded in an aqueous solution from the wavelength of 350–650 nm in a quartz cell having a path length of 1 cm with λmax corresponding to RhB found at 554 nm. The absorbance spectra of RhB show a pH-independent behavior at pH 4–12 and are shown in Figure 5a. There is no noticeable change that occurs in this range. Thus, this confirms that RhB is more stable and does not lose its chemical behavior between pH 4 and 12.
Figure 5.

(a) Stability of RhB at pH 1–12. (b) Calibration plot of RhB.
2.6.2. Calibration Plot of RhB
The stock solution of RhB was prepared in double-distilled water. A series of solutions with known concentrations (1–8 ppm) were prepared in a 25 mL standard volumetric flask. The Lambert–Beer law is valid up to 6 ppm for RhB dye. RhB in aqueous solution shows a pH-independent absorption behavior at a range of 4–12. However, the calibration plot of RhB was prepared at pH 7, and the correlation coefficient (R2) was found to be 0.996 and is shown in Figure 5b. Hence, at pH 7, further estimation of RhB has been carried out.
2.6.3. Batch Extraction Study and Removal of RhB
Using the batch extraction process, the adsorption behavior of RhB on MOF-5@GO nanocomposites was studied as a function of pH, contact time, and initial concentration of the aqueous RhB solution. Each experiment was done with 50 mg of the nanocomposite at room temperature. The unabsorbed RhB concentration present in the supernatant was calculated by UV–Vis spectrophotometry. The percentage (%) removal of RhB on the MOF-5@GO nanocomposite was determined using eq 1:
| 1 |
2.6.4. Removal of RhB as a Function of pH
In the adsorption method, pH plays an important role in RhB. This study was done at 50 mg of the nanocomposite in different ratios of MOF-5 and GO and 25 mL of 20 ppm RhB at different pH values like 2, 4, 5, 6, 8, and 12 at room temperature as given in Figure 6. Adsorption of RhB on the ratio of MOF-5 and GO such as 1:1, 1:2, and 2:1 is shown in Figures 66b, and 6ca, , respectively. The highest removal of RhB was observed on the ratio of 1:1 in comparison to 1:2 and 2:1. Henceforth, the 1:1 ratio is selected for further batch study. The amount of RhB adsorbed on MOF-5@GO nanocomposites was found in a higher acidic medium (at pH 2) as compared to the basic medium and remained almost constant from pH 6 to 8. So, consequently, pH 2 and 1:1 ratio are chosen for further study.
Figure 6.

Removal of RhB at (a) 1:1, (b) 1:2, and (c) 2:1 ratios as a function of pH and (d) a function of time.
2.6.5. Removal of RhB as a Function of Contact Time
In the study, 50 mg of MOF-5@GO nanocomposites was used for 25 mL of 20 ppm RhB for adsorption while maintaining the pH at 2. Approximately 98.88% of RhB is removed within 5 min of contact time, which increased to 99.68% within 10 min, and this may be due to the availability of more adsorption sites due to a high surface area. However, adsorption remained almost constant after 15 min as shown in Figure 6d. The reason thereof, during the initial few minutes, is that the rate of removal of RhB is very fast due to the concentration gradient that formed at the start of the process between RhB and the adsorbent surface. This effect is clarified by the presence of vacant sites on the surface of MOF-5@GO nanocomposites available for adsorption. Furthermore, due to the saturation of adsorption sites or blockage of pore on MOF-5@GO nanocomposites, the adsorption percent of RhB becomes constant.
2.6.6. Effect of the Initial Concentration of RhB
The removal of RhB by MOF-5@GO nanocomposites is also affected by the initial amount of RhB present in the aqueous solution. Therefore, the consequence of initial concentration on the removal of RhB is investigated with 25 mL of RhB with 50 mg of MOF-5@GO nanocomposites at pH 2, and the concentration of RhB that varies from 5 to 550 ppm is shown in Figure 7a. The rate of removal of RhB by MOF-5@GO nanocomposites increases up to 500 ppm; however, due to saturation of available loading sites, no significant increment in adsorption percentage of RhB is further observed.
Figure 7.

Percentage removal (a) effect of the initial concentration of RhB and (b) effect of Ni2+ and Cu2+ metal ions.
The removal of RhB was found to be 60.64% (151.62 mg·g–1) at 500 ppm; therefore, RhB adsorbed on MOF-5@GO nanocomposites. Hence, to investigate the structure and morphology of MOF-5@GO nanocomposite with appropriate analytical techniques, it was prepared in large amount.
2.6.7. Effect of Metal Concentration on RhB
The effect of metal ion concentration also played a crucial role in the remediation of RhB. The effect of metal ions Ni2+ and Cu2+ at different concentrations (5–100 ppm) on the removal of RhB on MOF-5@GO nanocomposites has been studied. In the presence of Cu2+, the percentage removal efficiency of RhB on MOF-5@GO nanocomposites decreases with an increase in the concentration of a metal ion, but in the case of Ni2+ ion, the percentage removal of RhB on MOF-5@GO nanocomposites slightly decreases with increasing the concentration of a metal ion in aqueous solution.55 In the presence of heavy metals, the adsorption capacity of dyes onto the MOF-5@GO surface decreases due to the preferential adsorption of these metal ions onto the active site of the MOF-5@GO nanocomposite shown in Figure 7b.
2.7. Description of Adsorption Kinetics and Isotherms
Chemical kinetics deals with the rate of reaction, as well as its mechanism, which is given in the Supporting Information. In the adsorption process, there are three types of adsorption kinetics. Pseudo-first-order kinetics is defined by Lagergren in which the plot between log qe–qt against t gives a straight line as shown in Figure S1a, pseudo-second-order kinetics is described by Ho and McKay in which the plot between t/qt against t gives a straight line (Figure S1b), and the intraparticle diffusion (ID) model given by Weber and Morris in which the plot between qt against gives a straight line (Figure S1c) in which the correlation coefficient R2 is found to be 0.7779. The experimental parameters of pseudo-first-order and pseudo-second-order kinetics are listed in Table 1. From the experimental parameter based on the correlation coefficient value, it is observed that pseudo-second-order kinetics is best fitted as compared to pseudo-first-order kinetics.
Table 1. Parameters of the Kinetic and Adsorption Isotherm.
| pseudo-first-order
kinetics |
pseudo-second-order
kinetics |
||||||
|---|---|---|---|---|---|---|---|
| K1 (min–1) | qe (mg/g) | R2 | K2 [g/mg·min)] | qe (mg/g) | R2 | ||
| 0.4470 | 9.6272 | 0.4025 | 0.0367 | 26.7379 | 0.9908 | ||
| Freundlich
adsorption isotherm |
Langmuir
adsorption isotherm |
||||||
|---|---|---|---|---|---|---|---|
| 1/n | n | Kf | R2 | qmax (mg/g) | KL (dm3/mg) | R2 | RL |
| 0.5254 | 1.9033 | 9.4362 | 0.0861 | 169.4915 | 0.0302 | 0.9703 | 0.1418 |
The adsorption capacity of MOF-5@GO nanocomposites for RhB is also determined by the equilibrium adsorption study. There are three types of adsorption isotherm. Langmuir adsorption isotherm defines the development of the monolayer surface of RhB quantitatively around the adsorbent in which the plot between Ce/qe against Ce gives a straight line as shown in Figure S1d, and it can also be defined in terms of a dimensionless constant known as Hall separation factor (RL) shown in Figure 3b, which is found to be 0.1418. Freundlich adsorption isotherm explains the adsorption process in the heterogeneous systems and the formation of multilayer adsorption in which the plot between log qe against log Ce gives a straight line as shown in Figure S1e. Temkin adsorption isotherm explains the heat of adsorption of the entire molecule in the adsorbent–adsorbate interaction in which the plot between qe against Ce gives a straight line as shown in Figure S1f.
Experimental parameters of the Langmuir and Freundlich adsorption isotherm are listed in Table 1. From the experimental parameter based on the correlation coefficient value, it is observed that the Langmuir adsorption isotherm is best fitted as compared to the Freundlich adsorption isotherm in the adsorption of RhB on to the MOF-5@GO nanocomposite.
2.8. Natural Degradation of RhB Concerning pH
Self-degradation studies of RhB were done to see the degradation efficiency process naturally at different pH values (pH 1–12) at a time duration of 1–120 days and are shown in Figure 8a–l. In acidic conditions, at pH 1, 12.40% (Figure 8a), there is a small degradation that takes place, but in pH 2, 35.87% (Figure 8b) degraded within 60 days and it remains constant up to 120 days. In pH 3, there is no degradation up to 60 days but 21.59% (Figure 8c) degradation within 90 days takes place and it remains constant up to 120 days, but in the case of pH 4 and pH 5, there is no degradation up to 90 and 30 days, respectively, but in both cases, 30.25% (Figure 8d) and 21.72% (Figure 8e) degraded up to 120 days. In the case of pH 6, there are slight decreases after 30 days (Figure 8f). From pH 7 to pH 11, there is no degradation of RhB that was found up to 120 days (Figure 8g–k), but in the case of the strong basic medium at pH 12, slight degradation was found, which is 36.16% (Figure 8l) from 15 to 120 days.
Figure 8.

Degradation of RhB for 1–120 days at various pH values: (a) pH 1, (b) pH 2, (c) pH 3, (d) pH 4, (e) pH 5, (f) pH 6, (g) pH 7, (h) pH 8, (i), pH 9, (j) pH 10, (k) pH 11, and (l) pH 12.
According to the available reports,56,57 the pH of the seawater, river, sewage, and lake water may exist from pH 6 to pH 8, and from experimental data, it is evidenced that RhB does not undergo any degradation in this region. It can be concluded that the RhB exists for a long time in an aqueous medium and it is imperative to remediate RhB.
2.9. Adsorption Mechanism of RhB on MOF-5@GO Nanocomposites
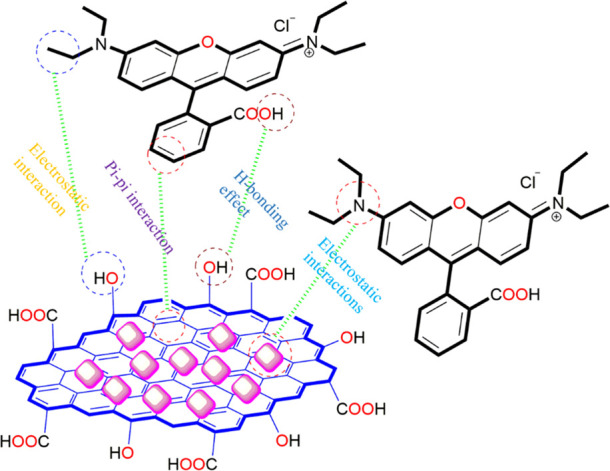
The adsorption of RhB on the surface and the cavity of MOF-5@GO nanocomposites can be due to different factors such as electrostatic/ionic interactions, hydrogen bonding, and π–π interactions.58−60 Keeping this in mind, it can be proposed that electrostatic attraction takes place between positively charged RhB molecules and negatively charged −OH groups of the surface of the MOF-5@GO nanocomposites. The MOF-5@GO nanocomposite has great advantages, such as high surface area, variable pore sizes, and different functionalities. Figure 1a(v) shows the FTIR spectrum for the comparison of MOF-5@GO nanocomposite before and after adsorption of RhB. The shifted peak position is because of the hydrogen bonding, π–π interactions, and electrostatic attraction. The removal of dye is usually based on the effect of size and the importance of ionic selectivity. Lan et al. created a mesoporous MOF of about 38 Å size-tunable cages and investigated that the size-exclusion effect depends on the separation of large dye molecules.61 The widely accepted theories accounting for the adsorption mechanism of adsorbents are based on their ionic selectivity and size effect. It may also be possible that the cause is due to the filling of pores occurring in the MOF-5 and GO, which is the inhibition of the adsorption of RhB to that of the synthesized MOF-5@GO nanocomposites. Including the high pore volume also allows them to absorb a greater amount of RhB in an aqueous solution. The mechanism for the adsorption of RhB on MOF-5@GO nanocomposites can be ionic interactions due to presence of unsaturated bonds (C=C, O−C=O) in MOF-5, negatively charged GO surface, and positive charge of RhB.62 Furthermore, π–π interaction also plays as active binding sites for the adsorption of the RhB molecule with MOF-5@GO nanocomposites. Since RhB contains C=C double bonds and π-electrons, this π-electron can easily interact with the π-electrons of benzene rings on the MOF-5 and GO surface via π–π interactions. Based on the above facts of interactions, RhB easily got adsorbed on the surface of MOF-5@GO nanocomposites. A schematic representing the proposed mechanism of RhB adsorption is shown in Figure 9.
Figure 9.

(a) Removal efficiency of RhB on MOF-5@GO nanocomposites in different cycles. (b) SEM image of MOF-5@GO nanocomposites after the fifth run.
2.10. Comparison Study
RhB removal capacities by the synthesized nanocomposites showing greater effectiveness as compared with previously reported studies are shown in Table 2. The synthesized nanocomposites demonstrate a strong cationic dye with highly efficient adsorbents MOF-5@GO nanocomposites.
Table 2. Adsorption Capacity of RhB onto MOF-5@GO Nanocomposites as Compared with Previous Studiesa.
| adsorption | adsorbate | Qe (mg/g) | conditions (°C) | ref |
|---|---|---|---|---|
| CoOF | RhB | 72.15 | 20 °C | (63) |
| RGO | RhB | 13.15 | 25 °C | (64) |
| sodium montmorillonite | RhB | 42.19 | 30 °C | (65) |
| CNSs | RhB | 01.95 | 25 °C | (66) |
| MCM-22 | RhB | 01.05 | 30 °C | (67) |
| Perlite | RhB | 08.72 | 30 °C | (68) |
| Nano-NiO | RhB | 111.0 | 20 °C | (69) |
| MOF-5@GO nanocomposite | RhB | 151.5 | RT | PW |
PW, present work; RT, room temperature.
2.11. Cyclability
The recycling ability of MOF-5@GO nanocomposites is also established where it is renewed by centrifugation after the batch experiment followed by excessive washing with ethanol and dried at 75 °C before further use in the next cycle. The recycling performance of regenerated MOF-5@GO nanocomposites is shown in Figure 10a. An insignificant decrease in adsorption percentage is observed after the first three cycles, however remaining constant for the last two cycles.
Figure 10.
Schematic possible interaction in the adsorption mechanism of RhB on MOF-5@GO nanocomposites.
This slight decrement in adsorption efficiency of nanocomposites might be due to the movement of the RhB molecule toward the interior cavities of the MOF-5@GO nanocomposite and it could not be washed out easily. The SEM image of MOF-5@GO nanocomposites depicted in Figure 10b after the fifth cycle also shows that there are no significant changes occurring in the morphology. These results demonstrated quicker adsorption integrated with excellent reversibility, thus making it a promising candidate for RhB adsorption in real applications. Furthermore, as compared with previous studies, the MOF-5@GO nanocomposite displays the highest adsorption capacity, which is listed in Table 2.
3. Conclusions
We have successfully developed MOF-5@GO nanocomposites employed for the removal of toxic dye. Due to electrostatic interactions between the positively charged metal center of MOF-5 and negative charge on GO surface, MOF-5 and GO resulted in MOF-5@GO nanocomposite. MOF-5@GO nanocomposites have an excellent adsorption capacity at a ratio of 1:1 for RhB, proving its application in the remediation of toxic dye. The physicochemical properties of nanocomposites were explained with different structural and morphological characterization techniques. The morphology of RhB-adsorbed MOF-5@GO nanocomposites reveals the growth of irregular form MOF-5 nanoparticles with sizes varying between 50 and 200 nm. Results of XPS and EDS spectra revealed the presence of carbon, oxygen, and zinc metal cluster. The adsorption kinetics data reveals pseudo-second-order (R2 = 0.9908), although the adsorption isotherm model was well defined by the Langmuir adsorption isotherm (R2 = 0.9703). The effect of adsorption capacity in the presence of heavy metal ions, i.e., Ni2+ and Cu2+, shows a decrease in the presence of Cu2+ ion but insignificant in the presence of Ni2+ ion. The adsorption capacity of MOF-5@GO nanocomposites was found to be 99.58% with 20 ppm at pH 2. In conclusion, MOF-5@GO nanocomposite is synthesized in one step, it is environmentally friendly, and cost-effective with high adsorption efficiency and outstanding reusability, which makes it a better adsorbent material for the removal of RhB from waste water.
4. Experimental Section
4.1. Synthesis of Graphene Oxide
GO was synthesized according to previous reports,70−72 with some modifications via the improved Hummer’s method. In brief, 90:10 mL of concentrated H2SO4:H3PO4 and graphite powder (1.5 g) were added with constant stirring for 15 min. Afterward, potassium permanganate (8 g) was added slowly into the above mixture and was heated at 50–55 °C with constant stirring for 12 h. The reaction was cooled to room temperature and poured into ice-cold water followed by the addition of hydrogen peroxide (3.5 mL) and stirred for 1 h, yielding the bright yellow precipitate. The mixture was kept overnight and centrifuged for 20 min at 7000 rpm (Sigma, Laboratory Centrifuges 3K30 Sartorius). The remaining solid material was then washed with hydrogen chloride, ethanol (2x), and diethyl ether (2x) twice for purification. The final solid brownish color GO sample was vacuum dried at 45 °C for 10 h.
4.2. Synthesis of MOF-5 and MOF-5@GO Nanocomposite
Zinc acetate (4.24 g) and benzene dicarboxylic acid (1.26 g) were dissolved in N,N-dimethylformamide (DMF) in a beaker with constant stirring up to 2 h to obtain a homogeneous mixture and placed in an oven at 125 °C for 24 h in a Teflon-lined sealed solvothermal vessel, resulting in a solid colorless precipitate. It was gradually cooled to room temperature and centrifuged at 7000 rpm for 15 min. The product was washed with N,N-dimethylformamide (100 x 2), dried under vacuum at room temperature, and stored under a desiccator.
MOF-5 was synthesized according to a previously reported method73,74 with minor modifications. MOF-5@GO nanocomposites were synthesized by a grinding method at different ratios (1:1, 1:2, and 2:1). The mixture was then dried at room temperature for 12 h and used as an adsorbent, and the synthesis is schematically depicted in Scheme 1.
Scheme 1. Simple Representation of the Synthesis of MOF-5@GO Nanocomposites.

Acknowledgments
We are grateful to the Head, Department of Chemistry, and Director, USIC, University of Delhi, India for providing instrumentation facilities. The authors acknowledge SAIF-AIIMS, New Delhi, for HRTEM facilities. G.K. is also thankful to the UGC-SRF (file no. 19/06/2016(i)EU-V) for providing financial support.
Supporting Information Available
The Supporting Information is available free of charge at https://pubs.acs.org/doi/10.1021/acsomega.1c00143.
Materials and method; description of adsorption kinetics and adsorption isotherm; N2 adsorption–desorption of GO, MOF-5, and MOF-5@GO nanocomposites; and EDS elemental analysis (PDF)
The authors declare no competing financial interest.
Supplementary Material
References
- Ai L.; Zhang C.; Meng L. Adsorption of Methyl Orange from Aqueous Solution on Hydrothermal Synthesized Mg-Al Layered Double Hydroxide. J. Chem. Eng. Data 2011, 56, 4217–4225. 10.1021/je200743u. [DOI] [Google Scholar]
- Li Z.; Ma B.; Zhang X.; Sang Y.; Liu H. One-pot synthesis of BiOCl nanosheets with dual functional carbon for ultra-highly efficient photocatalytic degradation of RhB. Environ. Res. 2020, 182, 109077. 10.1016/j.envres.2019.109077. [DOI] [PubMed] [Google Scholar]
- Wang J.; Qin L.; Lin J.; Zhu J.; Zhang Y.; Liu J.; van der Bruggen B. Enzymatic construction of antibacterial ultrathin membranes for dyes removal. Chem. Eng. J. 2017, 323, 56–63. 10.1016/j.cej.2017.04.089. [DOI] [Google Scholar]
- Liu E.; Du Y.; Bai X.; Fan J.; Hu X. Synergistic improvement of Cr (VI) reduction and RhB degradation using RP/g-C3N4 photocatalyst under visible light irradiation. Arabian Journal of Chemistry 2020, 13, 3836–3848. 10.1016/j.arabjc.2019.02.001. [DOI] [Google Scholar]
- Idris M. N.; Ahmad Z. A.; Ahmad M. A. Adsorption equilibrium of malachite green dye onto rubber seed coat based activated carbon. Int. J. Basic Appl. Sci. 2011, 11, 38–43. [Google Scholar]
- Liu L.; Gao Z. Y.; Su X. P.; Chen X.; Jiang L.; Yao J. M. Adsorption Removal of Dyes from Single and Binary Solutions Using a Cellulose-based Bioadsorbent. ACS Sustainable Chem. Eng. 2015, 3, 432–442. 10.1021/sc500848m. [DOI] [Google Scholar]
- Menzel R.; Iruretagoyena D.; Wang Y.; Bawaked S. M.; Mokhtar M.; Al-Thabaiti S. A.; Basahel S. N.; Shaffer M. S. P. Graphene oxide/mixed metal oxide hybrid materials for enhanced adsorption desulfurization of liquid hydrocarbon fuels. Fuel 2016, 181, 531–536. 10.1016/j.fuel.2016.04.125. [DOI] [Google Scholar]
- Wong Y. C.; Szeto Y. S.; Cheung W. H.; Mckay G. Equilibrium Studies for Acid Dye Adsorption onto Chitosan. Langmuir 2003, 19, 7888. 10.1021/la030064y. [DOI] [Google Scholar]
- Mariyam A.; Shahid M.; Mantasha I.; Khan M. S.; Ahmad M. S. Tetrazole Based Porous Metal Organic Framework (MOF): Topological Analysis and Dye Adsorption Properties. J. Inorg. Organomet. Polym. 2020, 30, 1935–1943. 10.1007/s10904-019-01334-6. [DOI] [Google Scholar]
- Ashrafi S. D.; Rezaei S.; Forootanfar H.; Mahvi A. H.; Faramarzi M. A. The enzymatic decolorization and detoxification of synthetic dyes by the laccase from a soil-isolated ascomycete, Paraconiothyrium variabile. Int. Biodeterior. Biodegrad. 2013, 85, 173–181. 10.1016/j.ibiod.2013.07.006. [DOI] [Google Scholar]
- Liu Y.; Ng Z.; Khan E. A.; Jeong H. K.; Ching C. B.; Lai Z. Synthesis of continuous MOF-5 membranes on porous a-alumina substrates. Microporous Mesoporous Mater. 2009, 118, 296–301. 10.1016/j.micromeso.2008.08.054. [DOI] [Google Scholar]
- Dalvand A.; Nabizadeh R.; Ganjali M. R.; Khoobi M.; Nazmara S.; Mahvi A. H. Modeling of Reactive Blue 19 azo dye removal from colored textile wastewater using L-arginine-functionalized Fe3O4 nanoparticles: Optimization, reusability, kinetic and equilibrium studies. J. Magn. Magn. Mater. 2016, 404, 179–189. 10.1016/j.jmmm.2015.12.040. [DOI] [Google Scholar]
- Mirzadeh S. S.; Khezri S. M.; Rezaei S.; Forootanfar H.; Mahvi A. H.; Faramarzi M. A. Decolorization of two synthetic dyes using the purified laccase of Paraconiothyrium variabile immobilized on porous silica beads. J. Environ. Health Sci. Eng. 2014, 12, 1–9. 10.1186/2052-336X-12-6. [DOI] [PMC free article] [PubMed] [Google Scholar]
- Bazrafshan E.; Mostafapour F. K.; Hosseini A. R.; Khorshid A. R.; Mahvi A. H. Decolorisation of Reactive Red 120 Dye by Using Single-Walled Carbon Nanotubes in Aqueous Solutions. Journal of Chemistry 2013, 2013, 1–8. 10.1155/2013/938374. [DOI] [Google Scholar]
- Sivakumar P.; Palanisamy P. N. Adsorption studies of basic red 29 by a nonconventional activated carbon prepared from Euphorbia antiquorum L. Int. J. ChemTech Res. 2009, 1, 502–510. [Google Scholar]
- Mogha N. K.; Gosain S.; Masram D. T. Gold nanoworms immobilized graphene oxide polymer brush nanohybrid for catalytic degradation studies of organic dyes. Appl. Surf. Sci. 2017, 396, 1427–1434. 10.1016/j.apsusc.2016.11.182. [DOI] [Google Scholar]
- Dreyer D. R.; Park S.; Bielawski C. W.; Ruoff R. S. The chemistry of graphene oxide. Chem. Soc. Rev. 2010, 39, 228–240. 10.1039/B917103G. [DOI] [PubMed] [Google Scholar]
- Zhu J.; Yang D.; Yin Z.; Yan Q.; Zhang H. Graphene and graphene-based materials for energy storage applications. Small 2014, 10, 3480–3498. 10.1002/smll.201303202. [DOI] [PubMed] [Google Scholar]
- Janiak C.; Vieth J. K. MOFs, MILs and more: concepts, properties and applications for porous coordination networks (PCNs). New J. Chem. 2010, 34, 2366–2388. 10.1039/c0nj00275e. [DOI] [Google Scholar]
- Wang Y.; Hou C.; Zhang Y.; He F.; Liu M.; Li X. Preparation of graphene nano-sheet bonded PDA/MOF microcapsules with immobilized glucose oxidase as a mimetic multi-enzyme system for electrochemical sensing of glucose. J. Mater. Chem. B 2016, 4, 3695–3702. 10.1039/C6TB00276E. [DOI] [PubMed] [Google Scholar]
- Fan W.; Wang X.; Xu B.; Wang Y.; Liu D.; Zhang M.; Shang Y.; Dai F.; Zhang L.; Sun D. Amino-functionalized MOFs with high physicochemical stability for efficient gas storage/separation, dye adsorption and catalytic performance. J. Mater. Chem. A 2018, 6, 24486. 10.1039/C8TA07839D. [DOI] [Google Scholar]
- Eddaoudi M.; Kim J.; Rosi N.; Vodak D.; Wachter J.; O’Keeffe M.; Yaghi O. M. Systematic design of pore size and functionality in isoreticular MOFs and their application in methane storage. Science 2002, 295, 469–472. 10.1126/science.1067208. [DOI] [PubMed] [Google Scholar]
- Kumar G.; Mogha N. K.; Masram D. T. Zr-Based Metal-Organic Framework/Reduced Graphene Oxide Composites for Catalytic Synthesis of 2,3-Dihydroquinazolin4(1H)-one Derivatives. ACS Appl. Nano Mater. 2021, 10.1021/acsanm.0c03322. [DOI] [Google Scholar]
- Petit C.; Bandosz T. J. Exploring the coordination chemistry of MOF-graphite oxide composites and their applications as adsorbents. Dalton Trans. 2012, 41, 4027. 10.1039/c2dt12017h. [DOI] [PubMed] [Google Scholar]
- Bandosz T. J.; Petit C. MOF/graphite oxide hybrid materials: exploring the new concept of adsorbents and catalysts. Adsorption 2010, 17, 5–16. 10.1007/s10450-010-9267-5. [DOI] [Google Scholar]
- Pu S.; Zhu R.; Ma H.; Deng D.; Pei X.; Qi F.; Chu W. Facile in-situ design strategy to disperse TiO2 nanoparticles on graphene for the enhanced photocatalytic degradation of rhodamine 6G. Appl. Catal. B 2017, 218, 208–219. 10.1016/j.apcatb.2017.06.039. [DOI] [Google Scholar]
- MiarAlipour S.; Friedmann D.; Scott J.; Amal R. TiO2/porous adsorbents: Recent advances and novel applications. J. Hazard. Mater. 2018, 341, 404–423. 10.1016/j.jhazmat.2017.07.070. [DOI] [PubMed] [Google Scholar]
- Ramesha G. K.; Kumar A. V.; Muralidhara H. B.; Sampath S. Graphene and graphene oxide as effective adsorbents toward anionic and cationic dyes. J. Colloid Interface Sci. 2011, 361, 270–277. 10.1016/j.jcis.2011.05.050. [DOI] [PubMed] [Google Scholar]
- Liu T.; Li Y.; Du Q.; Sun J.; Jiao Y.; Yang G.; Wang Z.; Xia Y.; Zhang W.; Wang K.; Zhu H.; Wu D. Adsorption of methylene blue from aqueous solution by graphene. Colloids Surf., B 2012, 90, 197–203. 10.1016/j.colsurfb.2011.10.019. [DOI] [PubMed] [Google Scholar]
- Petit C.; Bandosz T. J. MOF-graphite oxide nanocomposites: surface characterization and evaluation as adsorbents of ammonia. J. Mater. Chem. 2009, 19, 6521. 10.1039/b908862h. [DOI] [Google Scholar]
- Gao W.; Alemany L. B.; Ci L.; Ajayan P. M. New insights into the structure and reduction of graphite oxide. Nature Chem. 2009, 1, 403–408. 10.1038/nchem.281. [DOI] [PubMed] [Google Scholar]
- Compton O. C.; Nguyen S. T. Graphene oxide, highly reduced graphene oxide, and graphene: versatile building blocks for carbon-based materials. Small 2010, 6, 711–723. 10.1002/smll.200901934. [DOI] [PubMed] [Google Scholar]
- Dreyer D. R.; Todd A. D.; Bielawski C. W. Harnessing the chemistry of graphene oxide. Chem. Soc. Rev. 2009, 43, 228–240. 10.1039/C4CS00060A. [DOI] [PubMed] [Google Scholar]
- Li Q.; Fan F.; Wang Y.; Feng W.; Ji P. Enzyme Immobilization on Carboxyl-Functionalized Graphene Oxide for Catalysis in Organic Solvent. Ind. Eng. Chem. Res. 2013, 52, 6343–6348. 10.1021/ie400558u. [DOI] [Google Scholar]
- Liao Y.; Gao Y.; Zhu S.; Zheng J.; Chen Z.; Yin C.; Lou X.; Zhang D. Facile Fabrication of N-doped Graphene as Efficient Electrocatalyst for Oxygen Reduction Reaction. ACS Appl. Mater. Interfaces 2015, 7, 19619–19625. 10.1021/acsami.5b05649. [DOI] [PubMed] [Google Scholar]
- Park S.; An J.; Jung I.; Piner R. D.; An S. J.; Li X.; Velamakanni A.; Ruoff R. S. Colloidal suspensions of highly reduced graphene oxide in a wide variety of organic solvents. Nano Lett. 2009, 9, 1593–1597. 10.1021/nl803798y. [DOI] [PubMed] [Google Scholar]
- Petit C.; Bandosz T. J. Enhanced adsorption of ammonia on metal-organic framework/graphite oxide composites: analysis of surface interactions. Adv. Funct. Mater. 2010, 20, 111e118. 10.1002/adfm.200900880. [DOI] [Google Scholar]
- Firouzjaei M. D.; Shamsabadi A. A.; Aktij S. A.; Seyedfour S. F.; Gh M. S.; Rahimpour A.; Esfahani M. R.; Ulbricht M.; Soroush M. Exploiting Synergetic Effects of Graphene Oxide and a Silver-Based Metal-Organic Framework to Enhance Antifouling and Anti-Biofouling Properties of Thin-Film Nanocomposite Membranes. ACS Appl. Mater. Interfaces 2018, 10, 42967–42978. 10.1021/acsami.8b12714. [DOI] [PubMed] [Google Scholar]
- Yeh C.-N.; Raidongia K.; Shao J.; Yang Q.-H.; Huang J. On the origin of the stability of graphene oxide membranes in water. Nat. Chem. 2015, 7, 166–170. 10.1038/nchem.2145. [DOI] [PubMed] [Google Scholar]
- Petit C.; Bandosz T. J. MOF-Graphite Oxide Composites: Combining the Uniqueness of Graphene Layers and Metal-Organic Frameworks. Adv. Mater. 2009, 21, 4753–4757. 10.1002/adma.200901581. [DOI] [Google Scholar]
- Petit C.; Burress J.; Bandosz T. J. The synthesis and characterization of copper-based Metal-organic framework/graphite oxide composites. Carbon 2011, 49, 563–572. 10.1016/j.carbon.2010.09.059. [DOI] [Google Scholar]
- Liu L.; Zhang B.; Zhang Y.; He Y.; Huang L.; Tan S.; Cai X. Simultaneous Removal of Cationic and Anionic Dyes from Environmental Water Using Montmorillonite-Pillared Graphene Oxide. J. Chem. Eng. Data 2015, 60, 1270–1278. 10.1021/je5009312. [DOI] [Google Scholar]
- Karimzadeh Z.; Javanbakht S.; Namazi H. Carboxymethylcellulose/MOF-5/Graphene oxide bio-nanocomposite as antibacterial drug nanocarrier agent. Bioimpacts 2018, 9, 5–13. 10.15171/bi.2019.02. [DOI] [PMC free article] [PubMed] [Google Scholar]
- Lamdab U.; Wetchakun K.; Kangwansupamonkon W.; Wetchakun N. Effect of a pH-controlled co-precipitation process on rhodamine B adsorption of MnFe2O4 nanoparticles. RSC Adv. 2018, 8, 6709. 10.1039/C7RA13570J. [DOI] [PMC free article] [PubMed] [Google Scholar]
- Jabbari V.; Veleta J. M.; Zarei-Chaleshtori M.; Gardea-Torresdey J.; Villagran D. Green synthesis of magnetic MOF@GO and MOF@CNT hybrid nanocomposites with high adsorption capacity towards organic pollutants. Chem. Eng. J. 2016, 304, 774–783. 10.1016/j.cej.2016.06.034. [DOI] [Google Scholar]
- Divya K. S.; Chandran A.; Reethu V. N.; Mathew S. Enhanced photocatalytic performance of RGO/Ag nanocomposites produced via a facile microwave irradiation for the degradation of Rhodamine B in aqueous solution. Appl. Surf. Sci. 2018, 444, 811–818. 10.1016/j.apsusc.2018.01.303. [DOI] [Google Scholar]
- Rehman A. U.; Tirmizi S. A.; Badshah A.; Ammad H. M.; Jawad M.; Abbas S. M.; Rana U. A.; Khan S. U. D. Synthesis of highly stable MOF-5@MWCNTs nanocomposite with improved hydrophobic properties. Arabian J. Chem. 2018, 11, 26–33. 10.1016/j.arabjc.2017.01.012. [DOI] [Google Scholar]
- Greathouse J. A.; Allendorf M. D. The interaction of water with MOF-5 simulated by molecular dynamics. J. Am. Chem. Soc. 2006, 128, 10678–10679. 10.1021/ja063506b. [DOI] [PubMed] [Google Scholar]
- Han S. S.; Choi S.-H.; van Duin A. C. T. Molecular dynamics simulations of stability of metal-organic frameworks against H2O using the ReaxFF reactive force field. Chem. Commun. 2010, 46, 5713–5715. 10.1039/c0cc01132k. [DOI] [PubMed] [Google Scholar]
- Al-Gaashani R.; Najjar A.; Zakaria Y.; Mansour S.; Atieh M. A. XPS and structural studies of high-quality graphene oxide and reduced graphene oxide prepared by different chemical oxidation methods. Ceram. Int. 2019, 45, 14439–14448. 10.1016/j.ceramint.2019.04.165. [DOI] [Google Scholar]
- Chul H. D.; Vinodh R.; Gopi C. V. V. M.; Deviprasath C.; Kim H.-J.; Yi M. Effect of the cobalt and zinc ratio on the preparation of zeolitic imidazole frameworks (ZIFs): synthesis, characterization and supercapacitor applications. Dalton Trans. 2019, 48, 14808–14819. 10.1039/C9DT03306H. [DOI] [PubMed] [Google Scholar]
- Yuan J.; Liu W.; Zhang X.; Zhang Y.; Yang W.; Lai W.; Li X.; Zhang J.; Li X. MOF derived ZnSe-FeSe2/RGO Nanocomposites with enhanced sodium/potassium storage. J. Power Sources 2020, 455, 227937. 10.1016/j.jpowsour.2020.227937. [DOI] [Google Scholar]
- Lestari W. W.; Wibowo A. H.; Astuti S.; Irwinsyah Pamungkas A. Z.; Krisnandi Y. K. Fabrication of hybrid coating material of polypropylene itaconate containing MOF-5 for CO2 capture. Prog. Org. Coat. 2018, 115, 49–55. 10.1016/j.porgcoat.2017.11.006. [DOI] [Google Scholar]
- Li H.; Eddaoudi M.; O’Keeffe M.; Yaghi O. M. Design and synthesis of an exceptionally stable and highly porous metal-organic framework. Nature 1999, 402, 276–279. 10.1038/46248. [DOI] [Google Scholar]
- Kant A.; Datta M. Adsorption characteristics of Victoria blue on low-cost natural sand and its removal from aqueous media. Eur. Chem. Bull 2014, 3, 752–759. 10.17628/ecb.2014.3.752-759. [DOI] [Google Scholar]
- Feng Z.; Su B.; Xiao D. D.; Ye L. Y. Study on pH value and its variation characteristics of the main rivers into Dianchi lake under the anthropogenic and natural processes. Yunnan, China, Taylor and Francis 2017, 38, 1197–1210. 10.1080/02522667.2017.1367501. [DOI] [Google Scholar]
- Zhang C.; He D.; Ma J.; Tang W.; Waite T. D. aradaic reactions in capacitive deionization (CDI) - problems and possibilities: A review. Water Res. 2018, 128, 314–330. 10.1016/j.watres.2017.10.024. [DOI] [PubMed] [Google Scholar]
- Yua Y.; Murthya B. N.; Shaptera J. G.; Constantopoulosa K. T.; Voelckerb N. H.; Ellis A. V. Benzene carboxylic acid derivatized graphene oxide nanosheets on natural zeolites as effective adsorbents for cationic dye removal. J. Hazard. Mater. 2013, 260, 330–338. 10.1016/j.jhazmat.2013.05.041. [DOI] [PubMed] [Google Scholar]
- Mittal H.; Mishra S. B. Gum ghatti and Fe3O4 magnetic nanoparticles-based nanocomposites for the effective adsorption of rhodamine B. Carbohydr. Polym. 2014, 101, 1255–1264. 10.1016/j.carbpol.2013.09.045. [DOI] [PubMed] [Google Scholar]
- Yang C.; Wu S.; Cheng J.; Chen Y. Indium-based metal-organic framework/graphite oxide composite as an efficient adsorbent in the adsorption of rhodamine B from aqueous solution. J. Alloys Compd. 2016, 687, 804–812. 10.1016/j.jallcom.2016.06.173. [DOI] [Google Scholar]
- Lan Y. Q.; Jiang H. L.; Li S. L.; Xu Q. Mesoporous metal-organic frameworks with size-tunable cages: selective CO2 uptake, encapsulation of Ln3+ cations for luminescence, and column-chromatographic dye separation. Adv. Mater. 2011, 23, 5015–5020. 10.1002/adma.201102880. [DOI] [PubMed] [Google Scholar]
- Haque E.; Jun J. W.; Jhung S. H. Adsorptive removal of methyl orange and methylene blue from aqueous solution with a metal-organic framework material, iron terephthalate (MOF-235). J. Hazard. Mater. 2011, 185, 507–511. 10.1016/j.jhazmat.2010.09.035. [DOI] [PubMed] [Google Scholar]
- Barylak M.; Cendrowski K.; Mijowska E. Application of Carbonized Metal-Organic Framework as Efficient Adsorbent of Cationic Dye. Ind. Eng. Chem. Res. 2018, 57, 4867–4879. 10.1021/acs.iecr.7b03790. [DOI] [Google Scholar]
- Sun H.; Cao L.; Lu L. Magnetite/reduced graphene oxide nanocomposites: One step solvothermal synthesis and use as a novel platform for removal of dye pollutants. Nano Res. 2011, 4, 550–562. 10.1007/s12274-011-0111-3. [DOI] [Google Scholar]
- Selvam P. P.; Preethi S.; Basakaralingam P.; Thinakaran N.; Sivasamy S.; Sivanesan S. Removal of rhodamine B from aqueous solution by adsorption onto sodium montmorillonite. J. Hazard. Mater. 2008, 155, 39–44. 10.1016/j.jhazmat.2007.11.025. [DOI] [PubMed] [Google Scholar]
- Qu J.; Zhang Q.; Xia Y.; Cong Q.; Luo C. Synthesis of carbon nanospheres using fallen willow leaves and adsorption of Rhodamine B and heavy metals by them. Environ. Sci. Pollut. Res. 2015, 22, 1408–1419. 10.1007/s11356-014-3447-x. [DOI] [PubMed] [Google Scholar]
- Wang S.; Li H.; Xu L. Application of zeolite MCM-22 for basic dye removal from wastewater. J. Colloid Interface Sci. 2006, 295, 71–78. 10.1016/j.jcis.2005.08.006. [DOI] [PubMed] [Google Scholar]
- Vijayakumar G.; Tamilarasan R.; Dharmendirakuma M. Adsorption, Kinetic, Equilibrium and Thermodynamic studies on the removal of basic dye Rhodamine-B from aqueous solution by the use of natural adsorbent perlite. J. Mater. Environ. Sci. 2012, 3, 157–170. [Google Scholar]
- Motahari F.; Mozdianfard M. R.; Salavati-Niasari M. Synthesis and adsorption studies of NiO nanoparticles in the presence of H(2)acacen ligand, for removing Rhodamine B in wastewater treatment. Process Saf. Environ. Prot. 2015, 93, 282–292. 10.1016/j.psep.2014.06.006. [DOI] [Google Scholar]
- Marcano D. C.; Kosynkin D. V.; Berlin J. M.; Sinitskii A.; Sun Z.; Slesarev A.; Alemany L. B.; Lu W.; Tour J. M. Improved synthesis of graphene oxide. ACS Nano 2010, 4, 4806–4814. 10.1021/nn1006368. [DOI] [PubMed] [Google Scholar]
- Kumar G.; Mogha N. K.; Kumar M.; Subodh; Masram D. T. NiO nanocomposites/rGO as a heterogeneous catalyst for imidazole scaffolds with applications in inhibiting the DNA binding activity. Dalton Trans. 2020, 49, 1963–1974. 10.1039/C9DT04416G. [DOI] [PubMed] [Google Scholar]
- Subodh; Mogha N. K.; Chaudhary K.; Kumar G.; Masram D. T. Fur-imine-functionalized graphene oxide-immobilized copper oxide nanoparticle catalyst for the synthesis of xanthene derivatives. ACS Omega 2018, 3, 16377–16385. 10.1021/acsomega.8b01781. [DOI] [PMC free article] [PubMed] [Google Scholar]
- Kumar G.; Kant A.; Kumar M.; Masram D. T. Synthesis, characterizations and kinetic study of metal organic framework nanocomposite excipient used as extended-release delivery vehicle for an antibiotic drug. Inorg. Chim. Acta 2019, 496, 119036. 10.1016/j.ica.2019.119036. [DOI] [Google Scholar]
- Ming Y.; Purewal J.; Liu D.; Sudik A.; Xu C.; Yang J.; Veenstra M.; Rhodes K.; Soltis R.; Warner J.; Gaab M.; Müller U.; Siegel D. J. Thermophysical properties of MOF-5 powders. Microporous Mesoporous Mater. 2014, 185, 235–244. 10.1016/j.micromeso.2013.11.015. [DOI] [Google Scholar]
Associated Data
This section collects any data citations, data availability statements, or supplementary materials included in this article.