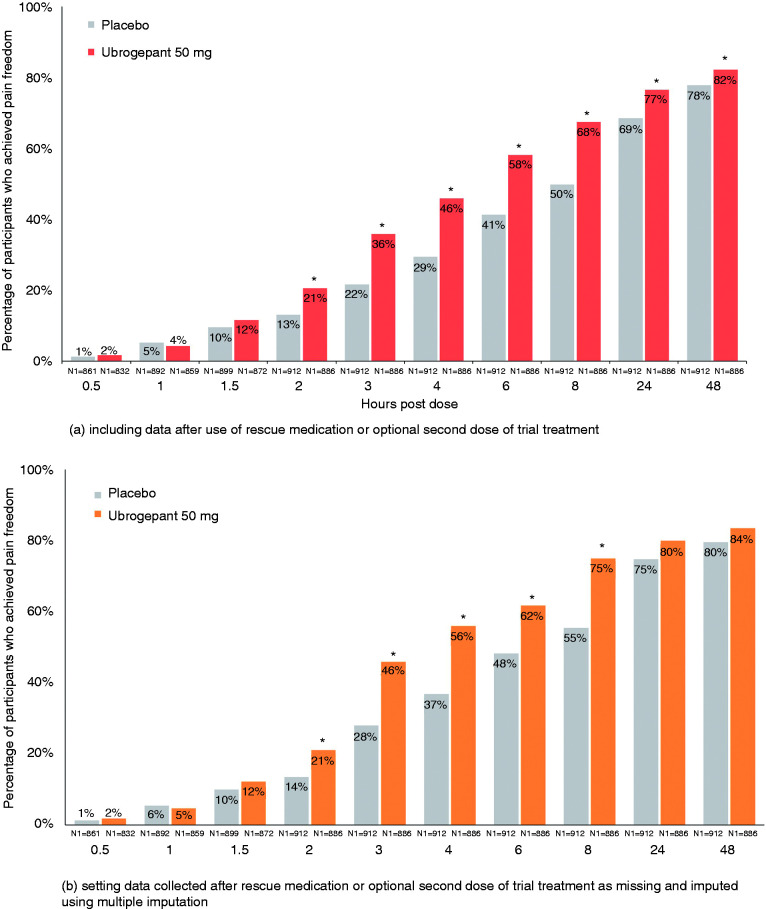
Figure 4.
Pain freedom by timepoint – pooled mITT population from ACHIEVE I and ACHIEVE II.
*Indicates p < 0.05 versus placebo. N1 = number of patients with non-missing post dose pain severity assessment at or prior to the timepoint in the modified intent-to-treat population. For the analysis that included data after use of rescue medication or optional second dose of trial treatment, missing data were handled using last observation carried forward. Response rates presented following multiple imputation represent a mean across 100 imputations. Odds ratio (95% CI) and p-value are based on logistic regression with treatment group, historical triptan response, use of medication for migraine prevention, and baseline headache severity as explanatory variables; these data are provided in Table 2 and Table 3. Percentages calculated as 100 × (n/N1).

