

Abstract
Background
Given that there is no rapid and effective method for distinguishing active tuberculosis (ATB) from latent tuberculosis infection (LTBI), the discrimination between these two statuses remains challenging. This study sought to investigate the value of nutritional indexes and tuberculosis‐specific antigen/phytohemagglutinin ratio (TBAg/PHA ratio) for distinguishing ATB from LTBI.
Methods
Participants were consecutively recruited based on positive T‐SPOT.TB results between January 2018 and January 2020. ATB was diagnosed by positive mycobacterial culture and/or positive GeneXpert MTB/RIF, with clinical symptoms and radiological characteristics suggestive of ATB. Individuals with positive T‐SPOT.TB but without the evidence of ATB were defined as LTBI. Patients younger than 17 years and undergoing anti‐TB treatment were excluded.
Results
A total of 709 (312 ATB and 397 LTBI) and another 309 (120 ATB and 189 LTBI) subjects were respectively recruited from Tongji Hospital (Qiaokou cohort) and Sino‐French New City Hospital (Caidian cohort). The level of prealbumin was significantly lower in ATB than in LTBI. With a cut‐off value of 139 mg/L, the sensitivity and specificity of prealbumin in distinguishing ATB from LTBI were 50.96% (45.41%‐56.51%) and 91.69% (88.97%‐94.40%). Meanwhile, TBAg/PHA ratio was found statistically higher in ATB compared with LTBI. If using the threshold of 0.29, the sensitivity and specificity of TBAg/PHA ratio were 65.71% (60.44%‐70.97%) and 90.93% (88.11%‐93.76%), respectively. Moreover, the combination of prealbumin and TBAg/PHA ratio (obtaining by diagnostic model) yielded better specificity (90.18%, [87.25%‐93.10%]) and sensitivity (87.18%, [83.47%‐90.89%]), while the clinical utility index (CUI) positive and CUI negative were respectively 0.76 and 0.81. After anti‐TB treatment, TBAg/PHA ratio was declined while the level of prealbumin was restored (Wilcoxon test, P < 0.001). Furthermore, the performance of diagnostic model obtained in Qiaokou cohort was confirmed in Caidian cohort.
Conclusions
The diagnostic model based on combination of prealbumin and TBAg/PHA ratio is a rapid and accurate tool for discriminating ATB from LTBI.
What’s known
TBAg/PHA ratio has moderate value for active tuberculosis diagnosis.
Prealbumin shows moderate value in tuberculosis diagnosis.
What’s new
The combination of prealbumin and TBAg/PHA ratio could serve as an accurate approach for differentiating ATB from LTBI.
Dynamic monitoring of prealbumin and TBAg/PHA ratio can be used for guiding anti‐TB treatment.
1. INTRODUCTION
Tuberculosis (TB), caused by Mycobacterium tuberculosis (MTB) infection, remains a predominant health concern on a global scale and the leading cause of mortality from a single infectious agent, with 1.5 million deaths reported in 2018 by World Health Organisation (WHO). 1 , 2 Meanwhile, latent tuberculosis infection (LTBI), which is clarified as individuals infected with MTB but without clinical symptoms of active TB (ATB), is an infectious status with about 5%‐10% risk of progressing to active disease. 3 , 4 It was reported that one of four individuals estimated to have LTBI worldwide, representing a larger reservoir from which future cases of ATB will develop. 5 , 6 Therefore, accurate and early differential diagnosis of ATB and LTBI is critical for both effective treatment and prevention of TB transmission.
Confirmation of ATB is mainly based on the primary microbiological evidence. 7 Unfortunately, the current diagnostic approaches either have low sensitivity (smear microscopy) or are time consuming (mycobacterial culture). 7 , 8 Molecular techniques such as GeneXpert MTB/RIF and GeneXpert MTB/RIF Ultra have been developed in order to facilitate rapid diagnosis, but around half of the patients still cannot be confirmed. 9 , 10 The tuberculin skin test (TST) is currently most widely used test for the detection of MTB infection. However, Bacille‐Calmette‐Guérin (BCG) vaccination would mislead the interpretation of the results. 11 , 12 Although interferon‐gamma release assays including T‐SPOT.TB (T‐SPOT) and QuantiFERON‐TB Gold In‐Tube (QFT‐GIT) are the most important and widely used immunodiagnostic for MTB infection, 13 , 14 they could not successfully differentiate ATB from LTBI. 15 , 16 The limitations of conventional approaches highlight the need to identify new attractive tools. Over the last decade, substantial efforts have been made to develop novel strategies for distinguishing ATB from LTBI. 17 , 18 Some studies demonstrated that host responses and feature including cytokines, 19 , 20 lymphocyte phenotypes, 21 , 22 transcriptome, 23 , 24 genome, 25 proteome 26 , 27 and metabolome 28 , 29 correlate with latent and active TB. However, these new findings have not been further analysed in more detail and fully clinically verified. Besides, some of them are not affordable and practicable worldwide, particularly in developing countries, because of complicated procedures and high cost. As a result, there are still no effective tools to meet the clinical requirements for differentiating ATB from LTBI. Better methods are needed in this area.
TB‐specific antigen/phytohemagglutinin ratio (TBAg/PHA ratio), as a novel indicator in T‐SPOT assay, has been found feasible in differentiating ATB from LTBI by Wang and his colleagues. 30 , 31 Meanwhile, several teams have found that the level of prealbumin (PAB) was decreased in patients with ATB, which suggests that ATB patients may be immunocompromised or undernourished. 32 , 33 Although these previous studies have suggested the clinical use of TBAg/PHA ratio and PAB for TB diagnostic purpose, the combination of these indexes has not been examined. Theoretically, the combination of TBAg/PHA ratio (TB‐specific indicator) and PAB (non‐specific indicator), performing by substituting these two indicators into the regression equation, may enhance TB diagnosis, especially the differential diagnosis of ATB and LTBI. Therefore, the aim of this study was to investigate the value of the nutritional indicators represented by PAB in the diagnosis of TB, and the potential of the combination of PAB and TBAg/PHA ratio in distinguishing between ATB and LTBI.
2. METHODS
2.1. Study design
The present study was conducted at Tongji hospital (Qiaokou cohort) and Sino‐French New City Hospital (Caidian cohort). Tongji hospital is the largest tertiary hospital in central China, with 5000 beds and a ward for patients with suspected TB. Sino‐French New City Hospital is a branch hospital of Tongji Hospital with 1500 beds. All participants were enrolled based on positive T‐SPOT results from January 2018 to January 2020. Patients with clinical symptoms and radiological characteristics suggestive of ATB were consecutively recruited and those who met the diagnostic criteria for ATB are finally included. ATB cases were diagnosed as patients with positive MTB culture and/or positive GeneXpert MTB/RIF in sputum, bronchoalveolar lavage fluid or biopsy tissue. LTBI were defined as individuals with positive T‐SPOT results and met the following criteria: (a) absence of symptomatic, microbiological or radiological evidences of ATB; and (b) no history of TB. The exclusion criteria were as follows: (a) patients younger than 17 years; and (b) patients undergoing anti‐TB treatment. In order to determine the change of indicators during anti‐TB treatment, ATB patients were recruited and 3 months of anti‐TB treatment was performed with isoniazid, rifampicin, pyrazinamide and ethambutol. The negative GeneXpert MTB/RIF results and relief of the patient's symptoms were considered signs of effective treatment. This study was approved by the Ethics Committee of Tongji Hospital, Tongji Medical College, Huazhong University of Science and Technology, Wuhan, China (TJ‐IRB20190421). Informed consents were signed by patients or surrogates.
2.2. Measurement of prealbumin, albumin and total protein
Heparin anti‐coagulating peripheral blood samples were collected from subjects. The measurements of PAB (normal range, 200‐400 mg/L), albumin (ALB) (normal range, 35‐52 g/L) and total protein (TP) (normal range, 64‐83 g/L) were performed using ROCHE COBAS 8000 (Mannheim, Germany) according to the manufacturer's instructions.
2.3. T‐SPOT assay
Heparinised peripheral blood was collected and analysed using T‐SPOT assay (Oxford Immunotec, Oxford, UK) according to the manufacturer's instructions. Briefly, the isolated peripheral blood mononuclear cells (PBMCs) (2.5 × 10⁵) were added to 96‐well plates precoated with anti‐interferon‐gamma (anti‐IFN‐γ) antibody. Four wells were used for each subject: medium well, phytohemagglutinin (PHA) well, early secreted antigenic target 6 (ESAT‐6) and culture filtrate protein 10 (CFP‐10) wells. Plates were incubated for 16‐20 hours at 37°C with 5% of CO2 and developed using an anti‐IFN‐γ antibody conjugate and substrate to detect the presence of secreted IFN‐γ. Spot‐forming cells (SFC) were counted with an automated ELISPOT reader (CTL Analysers, Cleveland, OH, USA). The test result was positive if ESAT‐6 and/or CFP‐10 minus negative control ≥6 spots. The test result was negative if both ESAT‐6 minus negative control and CFP‐10 minus negative control ≤5 spots. Results were considered undetermined if the spot amounts in the PHA well were <20 or if spot amounts in the medium well were >10.
We calculated the ratios of (a) ESAT‐6 SFC to PHA SFC and (b) CFP‐10 SFC to PHA SFC. The larger of the above two values was defined as the TBAg/PHA ratio of one participant.
2.4. Statistical analysis
Continuous variables were reported as mean ± standard deviation (SD) or median (25th‐75th percentile), and categorical variables were expressed as numbers and percentages (%). The comparison between continuous variables was performed using Mann‐Whitney U test or Wilcoxon test. Mann‐Whitney U test was used for the comparison between ATB and LTBI group. Wilcoxon test was used to compare the PAB concentration and TBAg/PHA ratio of the same patient before and after anti‐TB treatment. The chi‐squared test or Fisher's exact test was used for comparison of categorical data. To build the diagnostic model for distinguishing between ATB and LTBI, variables with P < 0.1 (statistical comparison) were taken as candidates for further multivariable logistic regression analyses; and then, the regression equation (diagnostic model) was obtained and a score for each individual was calculated. Receiver operating characteristic (ROC) analysis was performed to test the ability of various methods to discriminate ATB from LTBI. 34 , 35 The cut‐off values were defined based on their maximum Youden index (sensitivity + specificity − 1). Area under the curve (AUC), sensitivity, specificity, positive predictive value (PPV), negative predictive value (NPV), positive likelihood ratio (PLR), negative likelihood ratio (NLR), clinical utility index (CUI) positive, CUI negative and accuracy, together with their 95% confidence intervals (CI), were calculated. CUI is a parameter that gives the degree to which a diagnostic test is useful in clinical practice. CUI value greater than 0.81 means excellent utility; CUI value between 0.64 and 0.81 means good utility; CUI value between 0.49 and 0.64 means fair utility; CUI value between 0.36 and 0.49 means poor utility; CUI value less than 0.36 means very poor utility. 36 The AUCs were compared using the z statistic with the procedure of Delong et al. 37 Statistical analysis and graphing were performed using GraphPad Prism 6 (GraphPad Software, CA, USA), MedCalc version 11.6 (MedCalc, Mariakerke, Belgium) and SPSS 25.0 (SPSS, Chicago, IL, USA). All statistical tests were two‐sided. Statistically significant differences were determined using P < 0.05.
3. RESULTS
3.1. Characteristics of the study participants
Two independent cohorts (Qiaokou cohort (training set) and Caidian cohort (validation set)) were included to address the study aims. A total of 709 subjects were enrolled in Qiaokou cohort, including 312 patients with ATB and 397 individuals with LTBI. Another 309 participants (120 ATB and 189 LTBI) were recruited in Caidian cohort. Demographic and clinical characteristics of the study population are summarised in Table 1. There was no statistical difference in age and gender between different groups. Around 67% of participants were male, and the median age was about 55 years.
TABLE 1.
Demographic and clinical characteristics of study population
| Variables | Qiaokou cohort (training set) | P * | Caidian cohort (validation set) | P * | P † | ||
|---|---|---|---|---|---|---|---|
| ATB (n = 312) | LTBI (n = 397) | ATB (n = 120) | LTBI (n = 189) | ||||
| Age, y | 53 (37‐65) | 55 (45‐63) | 0.228 | 55 (41‐66) | 55 (46‐62) | 0.939 | 0.762 |
| Sex, male | 217 (69.55) | 265 (66.75) | 0.428 | 79 (65.83) | 133 (70.37) | 0.402 | 0.844 |
| TB history | 63 (20.19) | 0 (0) | <0.001 | 29 (24.17) | 0 (0) | <0.001 | 0.798 |
| Presence of BCG scar | 136 (43.59) | 159 (40.05) | 0.343 | 55 (45.83) | 69 (36.51) | 0.103 | 0.659 |
| Underlying condition or illness | |||||||
| Diabetes mellitus | 21 (6.73) | 18 (4.53) | 0.203 | 9 (7.50) | 11 (5.82) | 0.559 | 0.542 |
| Solid tumour | 35 (11.22) | 34 (8.56) | 0.237 | 10 (8.33) | 17 (8.99) | 0.841 | 0.618 |
| Haematological malignancy | 11 (3.53) | 12 (3.02) | 0.707 | 6 (5.00) | 7 (3.70) | 0.58 | 0.444 |
| End‐stage renal disease | 14 (4.49) | 16 (4.03) | 0.764 | 9 (7.50) | 11 (5.82) | 0.559 | 0.128 |
| Liver cirrhosis | 8 (2.56) | 10 (2.52) | 0.97 | 8 (6.67) | 5 (2.65) | 0.086 | 0.154 |
| Organ transplantation | 5 (1.60) | 2 (0.50) | 0.142 | 4 (3.33) | 2 (1.06) | 0.158 | 0.212 |
| HIV infection | 2 (0.64) | 1 (0.25) | 0.428 | 1 (0.83) | 1 (0.53) | 0.745 | 0.638 |
| Immunosuppressive condition ‡ | 41 (13.14) | 44 (11.08) | 0.402 | 11 (9.17) | 17 (8.99) | 0.959 | 0.172 |
| Positive mycobacterial culture | 265 (84.94) | N/A | N/A | 97 (80.83) | N/A | N/A | N/A |
| Positive Xpert MTB/RIF | 224 (71.79) | N/A | N/A | 89 (74.17) | N/A | N/A | N/A |
Abbreviations: ATB, active tuberculosis; BCG, Bacille‐Calmette‐Guérin; LTBI, latent tuberculosis infection; N/A, not applicable; TB, tuberculosis.
Comparisons were performed between ATB and LTBI groups using Mann‐Whitney U test or chi‐squared test.
Comparisons were performed between Qiaokou and Caidian cohorts using Mann‐Whitney U test or chi‐squared test.
Patients who underwent organ transplantation, chemotherapy or took immunosuppressants within 3 months. Data were presented as medians (25th‐75th percentages) or numbers (percentages).
3.2. Using PAB for distinguishing between ATB and LTBI
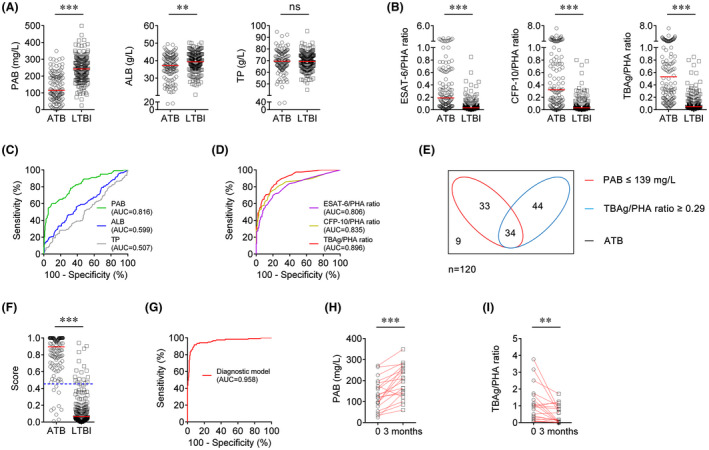
We measured the levels of PAB, ALB and TP in patients with ATB and individuals with LTBI. Compared with LTBI individuals, ATB patients had significantly lower levels of PAB and ALB (Figure 1A). However, no significant difference was found in the level of TP between patients with ATB and LTBI individuals (Figure 1A). When using PAB or ALB as diagnostic indicators, we found the performance of PAB was better than ALB in differentiating ATB from LTBI (AUC: 0.793 vs 0.616, P <0 .001) (Figure 1C). If using the cut‐off value of 139 mg/L, the sensitivity and specificity of PAB in distinguishing between ATB and LTBI were 50.96% (95% CI, 45.41%‐56.51%) and 91.69% (95% CI, 88.97%‐94.40%), respectively (Table 2).
FIGURE 1.

Establishment of diagnostic model based on combination of PAB and TBAg/PHA ratio in Qiaokou cohort. A, Scatter plots showing the levels of PAB, ALB and TP in ATB patients (n = 312) and LTBI individuals (n = 397). Horizontal lines indicate the median. ***P < 0.001, ns, no significance (Mann‐Whitney U test). B, Scatter plots showing ESAT‐6/PHA ratio, CFP‐10/PHA ratio and TBAg/PHA ratio in ATB patients (n = 312) and LTBI individuals (n = 397). Horizontal lines indicate the median. ***P < 0.001 (Mann‐Whitney U test). C, ROC analysis showing the performance of PAB, ALB and TP in differentiating ATB from LTBI. D, ROC analysis showing the performance of ESAT‐6/PHA ratio, CFP‐10/PHA ratio and TBAg/PHA ratio in differentiating ATB from LTBI. E, Venn diagrams showing the overlap of PAB and TBAg/PHA ratio in ATB patients (n = 312). F, Scatter plots showing the score of the diagnostic model based on the combination of PAB and TBAg/PHA ratio in ATB patients (n = 312) and LTBI individuals (n = 397). Horizontal lines indicate the median. ***P < 0.001 (Mann‐Whitney U test). Blue dotted lines indicate the cut‐off value in distinguishing these two groups. G, ROC analysis showing the performance of the diagnostic model based on the combination of PAB and TBAg/PHA ratio in distinguishing ATB from LTBI. H, Line graphs showing the level of PAB in ATB patients (n = 40) before and after 3 months of anti‐TB treatment. ***P < 0.001 (Wilcoxon test). I, Line graphs showing TBAg/PHA ratio in ATB patients (n = 40) before and after 3 months of anti‐TB treatment. ***P < 0.001 (Wilcoxon test). ALB, albumin; ATB, active tuberculosis; AUC, area under the curve; CFP‐10, culture filtrate protein 10; ESAT‐6, early secreted antigenic target 6; LTBI, latent tuberculosis infection; PAB, prealbumin; PHA, phytohaemagglutinin; ROC, receiver operating characteristic; TBAg, tuberculosis‐specific antigens; TP, total protein
TABLE 2.
The performance of various approaches for discriminating ATB from LTBI in Qiaokou cohort
| Variables | Threshold value | AUC (95% CI) | Sensitivity (95% CI) (%) | Specificity (95% CI) (%) | PPV (95% CI) (%) | NPV (95% CI) (%) | PLR (95% CI) | NLR (95% CI) | CUI positive | CUI negative | Accuracy (%) |
|---|---|---|---|---|---|---|---|---|---|---|---|
| PAB (mg/L) | 139 | 0.793 † (0.759‐0.826) | 50.96 (45.41‐56.51) | 91.69 (88.97‐94.40) | 82.81 (77.48‐88.15) | 70.41 (66.47‐74.34) | 6.13 (4.34‐8.65) | 0.53 (0.48‐0.60) | 0.42 | 0.65 | 73.77 |
| TBAg/PHA ratio | 0.29 | 0.876 ‡ (0.851‐0.902) | 65.71 (60.44‐70.97) | 90.93 (88.11‐93.76) | 85.06 (80.56‐89.56) | 77.14 (73.33‐80.94) | 7.25 (5.25‐9.99) | 0.38 (0.32‐0.44) | 0.56 | 0.7 | 79.83 |
| Diagnostic model* | 0.454 | 0.944 (0.928‐0.960) | 87.18 (83.47‐90.89) | 90.18 (87.25‐93.10) | 87.46 (83.78‐91.14) | 89.95 (87.00‐92.90) | 8.87 (6.57‐11.99) | 0.14 (0.11‐0.19) | 0.76 | 0.81 | 88.86 |
Abbreviations: ATB, active tuberculosis; AUC, area under the curve; CI, confidence interval; CUI, clinical utility index; LTBI, latent tuberculosis infection; NLR, negative likelihood ratio; NPV, negative predictive value; PAB, prealbumin; PHA, phytohaemagglutinin; PLR, positive likelihood ratio; PPV, positive predictive value; TBAg, tuberculosis‐specific antigens.
Diagnostic model based on combination of PAB and TBAg/PHA ratio.
P < 0.001, compared with diagnostic model using the z statistic.
P < 0.001, compared with diagnostic model using the z statistic.
3.3. The performance of TBAg/PHA ratio for discriminating ATB from LTBI
We compared the results of T‐SPOT assay between ATB and LTBI group. It was observed that ESAT‐6/PHA ratio, CFP‐10/PHA ratio and TBAg/PHA ratio were all significantly elevated in ATB compared with LTBI (Figure 1B). The ROC analysis showed that the AUC of TBAg/PHA ratio was significantly higher than that of either ESAT‐6/PHA ratio or CFP‐10/PHA ratio (Figure 1D). When a threshold was set as 0.29, TBAg/PHA ratio was able to discriminate ATB from LTBI with a sensitivity of 65.71% (95% CI, 60.44%‐70.97%) and a specificity of 90.93% (95% CI, 88.11%‐93.76%) (Table 2).
3.4. Establishing a diagnostic model based on the combination of PAB and TBAg/PHA ratio for distinguishing ATB from LTBI
It was found that both PAB and TBAg/PHA ratio showed moderate performance in ATB and LTBI discrimination. However, the overlap between PAB and TBAg/PHA ratio showed that the combination of these two parameters might improve the diagnostic value (Figure 1E). In order to build a diagnostic model based on combination of PAB and TBAg/PHA ratio for distinguishing ATB patients from LTBI individuals, both these two indexes were used for multivariable logistic regression analysis. A model was established as the following: P = 1/[1 + e‐(−0.022 × PAB + 6.605 × TBAg/PHA ratio + 1.957)] P, predictive value; e, natural logarithm. We found that the diagnostic model based on the combination of PAB and TBAg/PHA ratio exhibited an improved overall diagnostic performance over PAB and TBAg/PHA ratio (Table 2). The AUC and accuracy of diagnostic model to differentiate ATB from LTBI were 0.944 and 88.86%, while the sensitivity and specificity were 87.18% (95% CI, 83.47%‐90.89%) and 90.18% (95% CI, 87.25%‐93.10%), respectively, with a cut‐off value of 0.454 was used (Table 2, Figure 1F,G). The PLR and NLR of the diagnostic model were 8.87 (95% CI, 6.57‐11.99) and 0.14 (95% CI, 0.11‐0.19), respectively. Meanwhile, the CUI positive and CUI negative of the diagnostic model were 0.76 and 0.81, respectively.
3.5. Value of monitoring PAB and TBAg/PHA ratio during anti‐TB treatment
Following standard anti‐TB treatment, the level of PAB was significantly increased compared with that before treatment (Figure 1H). On the contrary, TBAg/PHA ratio was significantly decreased after 3 months of anti‐TB treatment (Figure 1I). In addition, we found that the inflammatory indicators such as hypersensitive C‐reactive protein was positively correlated with the TBAg/PHA ratio and negatively correlated with the PAB in the treated group (Figure S1).
3.6. Validation of the diagnostic model based on the combination of PAB and TBAg/PHA ratio in Caidian cohort
Another blinded validation study was separately performed in Caidian cohort. Moderate differentiation was found with PAB between ATB and LTBI (Table 3, Figure 2A,C). If using the cut‐off value of 139 mg/L obtained from Qiaokou cohort, the sensitivity and specificity were 56.67% (95% CI, 47.80%‐65.53%) and 91.53% (95% CI, 87.57%‐95.50%), respectively (Table 3). Meanwhile, excellent performance was found with the diagnostic model based on the combination of PAB and TBAg/PHA ratio for discrimination between ATB and LTBI (Figure 2B,D‐I). Notably, the diagnostic model presented a specificity of 90.48% (95% CI, 86.29%‐94.66%) and a sensitivity of 91.67% (95% CI, 86.72%‐96.61%) in distinguishing between ATB and LTBI when a threshold of 0.454 was used. The PPV and NPV of the diagnostic model were 85.94% (95% CI, 79.92%‐91.96%) and 94.48% (95% CI, 91.15%‐97.80%), respectively. Besides, the CUI positive and CUI negative of the model were 0.83 and 0.85, respectively.
TABLE 3.
The performance of various approaches for discriminating ATB from LTBI in Caidian cohort
| Variables | Threshold value | AUC (95% CI) | Sensitivity (95% CI) (%) | Specificity (95% CI) (%) | PPV (95% CI) (%) | NPV (95% CI) (%) | PLR (95% CI) | NLR (95% CI) | CUI positive | CUI negative | Accuracy (%) |
|---|---|---|---|---|---|---|---|---|---|---|---|
| PAB (mg/L) | 139 | 0.816 † (0.767‐0.865) | 56.67 (47.80‐65.53) | 91.53 (87.57‐95.50) | 80.95 (72.55‐89.35) | 76.89 (71.38‐82.40) | 6.69 (4.08‐10.97) | 0.47 (0.38‐0.58) | 0.46 | 0.7 | 77.99 |
| TBAg/PHA ratio | 0.29 | 0.896 ‡ (0.862‐0.930) | 65.00 (56.47‐73.53) | 90.48 (86.29‐94.66) | 81.25 (73.44‐89.06) | 80.28 (74.94‐85.62) | 6.83 (4.31‐10.80) | 0.39 (0.30‐0.50) | 0.53 | 0.73 | 80.58 |
| Diagnostic model* | 0.454 | 0.958 (0.934‐0.982) | 91.67 (86.72‐96.61) | 90.48 (86.29‐94.66) | 85.94 (79.92‐91.96) | 94.48 (91.15‐97.80) | 9.63 (6.18‐14.99) | 0.09 (0.05‐0.17) | 0.83 | 0.85 | 90.94 |
Abbreviations: ATB, active tuberculosis; AUC, area under the curve; CI, confidence interval; CUI, clinical utility index; LTBI, latent tuberculosis infection; NLR, negative likelihood ratio; NPV, negative predictive value; PAB, prealbumin; PHA, phytohaemagglutinin; PLR, positive likelihood ratio; PPV, positive predictive value; TBAg, tuberculosis‐specific antigens.
Diagnostic model based on combination of PAB and TBAg/PHA ratio.
P < 0.001, compared with diagnostic model using the z statistic.
P < 0.01, compared with diagnostic model using the z statistic.
FIGURE 2.
Validation of diagnostic model based on combination of PAB and TBAg/PHA ratio in Caidian cohort. A, Scatter plots showing the levels of PAB, ALB and TP in ATB patients (n = 120) and LTBI individuals (n = 189). Horizontal lines indicate the median. **P < 0.01, ***P < 0.001, ns, no significance (Mann‐Whitney U test). B, Scatter plots showing ESAT‐6/PHA ratio, CFP‐10/PHA ratio and TBAg/PHA ratio in ATB patients (n = 120) and LTBI individuals (n = 189). Horizontal lines indicate the median. ***P < 0.001 (Mann‐Whitney U test). C, ROC analysis showing the performance of PAB, ALB and TP in differentiating ATB from LTBI. D, ROC analysis showing the performance of ESAT‐6/PHA ratio, CFP‐10/PHA ratio and TBAg/PHA ratio in differentiating ATB from LTBI. E, Venn diagrams showing the overlap of PAB and TBAg/PHA ratio in ATB patients (n = 120). F, Scatter plots showing the score of the diagnostic model based on the combination of PAB and TBAg/PHA ratio in ATB patients (n = 120) and LTBI individuals (n = 189). Horizontal lines indicate the median. ***P < 0.001 (Mann‐Whitney U test). Blue dotted lines indicate the cut‐off value in distinguishing these two groups. G, ROC analysis showing the performance of the diagnostic model based on the combination of PAB and TBAg/PHA ratio in distinguishing ATB from LTBI. H, Line graphs showing the level of PAB in ATB patients (n = 20) before and after 3 months of anti‐TB treatment. ***P < 0.001 (Wilcoxon test). I, Line graphs showing TBAg/PHA ratio in ATB patients (n = 20) before and after 3 months of anti‐TB treatment. **P < 0.01 (Wilcoxon test). ALB, albumin; ATB, active tuberculosis; AUC, area under the curve; CFP‐10, culture filtrate protein 10; ESAT‐6, early secreted antigenic target 6; LTBI, latent tuberculosis infection; PAB, prealbumin; PHA, phytohaemagglutinin; ROC, receiver operating characteristic; TBAg, tuberculosis‐specific antigens; TP, total protein
4. DISCUSSION
To the best of our knowledge, the present study is the first large case‐control study to comprehensively explore the value of nutritional indicators and TBAg/PHA ratio in the differentiation between ATB and LTBI. We found that ALB and TP did not have sufficient accuracy for the differential diagnosis between ATB and LTBI. PAB, however, might have relatively high value for this issue. Then, we aimed to apply a model based on the combination of PAB and TBAg/PHA ratio for differential diagnosis between ATB and LTBI. It was found that the diagnostic model based on combination of PAB and TBAg/PHA ratio has good performance for distinguishing between ATB and LTBI. Besides, the reverse trend of PAB and TBAg/PHA ratio during the subsequent anti‐TB treatment also suggests that dynamic monitoring of PAB and TBAg/PHA ratio offers great potential as a useful tool for guiding anti‐TB treatment.
The key point for ending TB is efficient identification of patients with ATB and individuals with LTBI. 38 , 39 , 40 , 41 , 42 , 43 Nevertheless, the differential diagnosis between ATB and LTBI is hampered by the flaws of conventional tests. 44 , 45 , 46 More and more studies have shown that MTB infection would generate a status of relatively poor immunity in host. 47 Previous studies have reported that there was a decrease in the number of peripheral blood lymphocytes 48 and serum iron in patients with ATB. 28 , 49 These evidences suggest that TB patients may be in a state of malnutrition because of the damage to the host's nutrient absorption system or the depletion of the host's nutrients by the pathogen. 50 Hence, protein indicators represented by PAB and ALB have been found to have certain potential in the field of TB diagnosis. 32
One interesting question is why TBAg/PHA ratio and PAB have complementary effects on TB diagnosis. We speculate that TBAg/PHA ratio and PAB exhibit different value in MTB‐infected individuals with different immune status. Previous studies have showed that TBAg/PHA ratio were obviously decreased in immunocompromised ATB patients. 51 Therefore, it is very difficult to distinguish ATB from LTBI in this condition because most times those low T‐SPOT results are attributed to LTBI. However, the level of PAB was decreased in immunocompromised patients. Thus, the performance of PAB in distinguishing ATB from LTBI may be better in immunocompromised patients than immunocompetent ones. In contrast, the performance of TBAg/PHA ratio is better than PAB in distinguishing ATB from LTBI in immunocompetent patients. Thus, it is reasonable that combining these two indicators could improve the performance for TB diagnosis. After anti‐TB treatment, the burden of MTB and the number of TB‐specific cells would decrease. Thus, the TB‐specific response would be attenuated, while the body's immunity would restore and the levels of nutritional indicators such as PAB would increase after anti‐TB treatment.
The present study established a diagnostic model with satisfactory accuracy based on two indicators and the model was successfully validated by using data from an independent cohort. On the flip side, our established model can be rapidly and easily determined. Therefore, this new strategy may improve TB diagnosis, particularly in resource‐limited countries with high TB burden.
Several limitations should be mentioned in this study. First, in terms of all subjects in the current study were recruited based on a positive T‐SPOT assay, MTB‐infected patients with negative T‐SPOT results were not involved. The proportion of ATB patients with negative T‐SPOT results may reach around 10%, 52 and the inclusion of this part of the population would reduce the performance of the model established in the current study. Second, although this is a two‐centre study, the number of included participants is limited in each centre. Meanwhile, this study used a case‐control design, which does not fully reflect diagnostic performance. Further validation by multiple centres under different TB burden with a large sample size and a prospective cohort design is needed. Third, some indicators such as body mass index might influence the level of PAB. This may affect the performance of our model to a certain extent. Fourth, the performance of the model was not validated by using healthy controls, this needs to be further determined. Ultimately, our research does not include adolescents and children. However, the needs of these people for TB diagnosis should also be met.
In summary, we successfully established a diagnostic model based on the combination of non‐specific marker (PAB) and TB‐specific marker (TBAg/PHA ratio) for the differential diagnosis between ATB and LTBI. It could serve as an attractive approach to determine the status of MTB infection.
DISCLOSURE
The authors declare there are no competing interests.
AUTHOR CONTRIBUTIONS
YL, FW and ZS conceived the research and drafted the manuscript. YL and YX participated the study design and managed statistical analyses. YL, XY, QL and GT collected the samples and clinical data. YL, LM and HS performed the experiment. All authors contributed to manuscript revision and have read and approved the final version.
Supporting information
Figure S1
ACKNOWLEDGEMENTS
We thank the patients for cooperating with our investigation. We acknowledge the professionalism and compassion demonstrated by all the healthcare workers.
Luo Y, Xue Y, Yuan X, et al. Combination of prealbumin and tuberculosis‐specific antigen/phytohemagglutinin ratio for discriminating active tuberculosis from latent tuberculosis infection. Int J Clin Pract.2021;75:e13831. 10.1111/ijcp.13831
Funding informationThis work was supported by the National Mega Project on Major Infectious Disease Prevention (2017ZX10103005‐007) and the National Natural Science Foundation of China (81401639).
Contributor Information
Feng Wang, Email: fengwang@tjh.tjmu.edu.cn.
Ziyong Sun, Email: zysun@tjh.tjmu.edu.cn.
DATA AVAILABILITY STATEMENT
The data that supports the findings of this study are available in the article and supplementary materials. Further enquiries can be directed to the corresponding authors.
REFERENCES
- 1. World Health Organization . Global Tuberculosis Report; 2019. https://www.who.int/tb/publications/global_report/en/. Accessed May 02, 2020.
- 2. Collaborators GBDCoD . Global, regional, and national age‐sex‐specific mortality for 282 causes of death in 195 countries and territories, 1980–2017: a systematic analysis for the Global Burden of Disease Study 2017. Lancet. 2018;392:1736‐1788. [DOI] [PMC free article] [PubMed] [Google Scholar]
- 3. Cohen A, Mathiasen VD, Schön T, Wejse C. The global prevalence of latent tuberculosis: a systematic review and meta‐analysis. Eur Respir J. 2019;54:1900655. [DOI] [PubMed] [Google Scholar]
- 4. Blumberg HM, Ernst JD. The challenge of latent TB infection. JAMA. 2016;316:931‐933. [DOI] [PMC free article] [PubMed] [Google Scholar]
- 5. Houben RM, Dodd PJ. The global burden of latent tuberculosis infection: a re‐estimation using mathematical modelling. PLoS Med. 2016;13:e1002152. [DOI] [PMC free article] [PubMed] [Google Scholar]
- 6. Turetz ML, Ma KC. Diagnosis and management of latent tuberculosis. Curr Opin Infect Dis. 2016;29:205‐211. [DOI] [PubMed] [Google Scholar]
- 7. World Health Organization . Implementing tuberculosis diagnostics.Policy framework, Geneva; 2015.
- 8. Dheda K, Barry CE, Maartens G. Tuberculosis. Lancet. 2016;387:1211‐1226. [DOI] [PMC free article] [PubMed] [Google Scholar]
- 9. Horne DJ, Kohli M, Zifodya JS, et al. Xpert MTB/RIF and Xpert MTB/RIF Ultra for pulmonary tuberculosis and rifampicin resistance in adults. Cochrane Database Syst Rev. 2019;6:CD009593. [DOI] [PMC free article] [PubMed] [Google Scholar]
- 10. Chakravorty S, Simmons AM, Rowneki M, et al. The new Xpert MTB/RIF ultra: improving detection of mycobacterium tuberculosis and resistance to rifampin in an assay suitable for point‐of‐care testing. MBio. 2017;8:e00812‐e817. [DOI] [PMC free article] [PubMed] [Google Scholar]
- 11. Gudjonsdottir MJ, Kotz K, Nielsen RS, et al. Relation between BCG vaccine scar and an interferon‐gamma release assay in immigrant children with "positive" tuberculin skin test (>/=10 mm). BMC Infect Dis. 2016;16:540. [DOI] [PMC free article] [PubMed] [Google Scholar]
- 12. Levy MZ, Medeiros EA, Shang N, et al. TST reversion in a BCG‐revaccinated population of nursing and medical students, Sao Paulo, Brazil, 1997–2000. Int J Tuberc Lung Dis. 2005;9:771‐776. [PubMed] [Google Scholar]
- 13. Du F, Xie L, Zhang Y, et al. Prospective comparison of QFT‐GIT and T‐SPOT.TB assays for diagnosis of active tuberculosis. Sci Rep. 2018;8:5882. [DOI] [PMC free article] [PubMed] [Google Scholar]
- 14. Sester M, Sotgiu G, Lange C, et al. Interferon‐gamma release assays for the diagnosis of active tuberculosis: a systematic review and meta‐analysis. Eur Respir J. 2011;37:100‐111. [DOI] [PubMed] [Google Scholar]
- 15. Auguste P, Tsertsvadze A, Pink J, et al. Comparing interferon‐gamma release assays with tuberculin skin test for identifying latent tuberculosis infection that progresses to active tuberculosis: systematic review and meta‐analysis. BMC Infect Dis. 2017;17:200. [DOI] [PMC free article] [PubMed] [Google Scholar]
- 16. Lu P, Chen X, Zhu LM, Yang H‐T. Interferon‐gamma release assays for the diagnosis of tuberculosis: a systematic review and meta‐analysis. Lung. 2016;194:447‐458. [DOI] [PubMed] [Google Scholar]
- 17. MacLean E, Broger T, Yerliyaka S, Fernandez‐Carballo BL, Pai M, Denkinger CM. A systematic review of biomarkers to detect active tuberculosis. Nat Microbiol. 2019;4:748‐758. [DOI] [PubMed] [Google Scholar]
- 18. Walzl G, McNerney R, du Plessis N, et al. Tuberculosis: advances and challenges in development of new diagnostics and biomarkers. Lancet Infect Dis. 2018;18:e199‐e210. [DOI] [PubMed] [Google Scholar]
- 19. Won EJ, Choi JH, Cho YN, et al. Biomarkers for discrimination between latent tuberculosis infection and active tuberculosis disease. J Infect. 2017;74:281‐293. [DOI] [PubMed] [Google Scholar]
- 20. Wu J, Wang S, Lu C, et al. Multiple cytokine responses in discriminating between active tuberculosis and latent tuberculosis infection. Tuberculosis. 2017;102:68‐75. [DOI] [PubMed] [Google Scholar]
- 21. Musvosvi M, Duffy D, Filander E, et al. T‐cell biomarkers for diagnosis of tuberculosis: candidate evaluation by a simple whole blood assay for clinical translation. Eur Respir J. 2018;51:1800153. [DOI] [PubMed] [Google Scholar]
- 22. Adekambi T, Ibegbu CC, Cagle S, et al. Biomarkers on patient T cells diagnose active tuberculosis and monitor treatment response. J Clin Invest. 2015;125:1827‐1838. [DOI] [PMC free article] [PubMed] [Google Scholar]
- 23. Ho J, Bokil NJ, Nguyen PTB, et al. A transcriptional blood signature distinguishes early tuberculosis disease from latent tuberculosis infection and uninfected individuals in a Vietnamese cohort. J Infect. 2020;81:72‐80. [DOI] [PubMed] [Google Scholar]
- 24. Turner CT, Gupta RK, Tsaliki E, et al. Blood transcriptional biomarkers for active pulmonary tuberculosis in a high‐burden setting: a prospective, observational, diagnostic accuracy study. Lancet Respir Med. 2020;8:407‐419. [DOI] [PMC free article] [PubMed] [Google Scholar]
- 25. Warsinske H, Vashisht R, Khatri P. Host‐response‐based gene signatures for tuberculosis diagnosis: a systematic comparison of 16 signatures. PLoS Med. 2019;16:e1002786. [DOI] [PMC free article] [PubMed] [Google Scholar]
- 26. Chaisson R, Penn‐Nicholson A, Hraha T, et al. Discovery and validation of a prognostic proteomic signature for tuberculosis progression: a prospective cohort study. PLoS Med. 2019;16:e1002781. [DOI] [PMC free article] [PubMed] [Google Scholar]
- 27. Yang Q, Chen Q, Zhang M, et al. Identification of eight‐protein biosignature for diagnosis of tuberculosis. Thorax. 2020;75:576‐583. [DOI] [PMC free article] [PubMed] [Google Scholar]
- 28. Dai Y, Shan W, Yang Q, et al. Biomarkers of iron metabolism facilitate clinical diagnosis in M ycobacterium tuberculosis infection. Thorax. 2019;74:1161‐1167. [DOI] [PMC free article] [PubMed] [Google Scholar]
- 29. Weiner J 3rd, Maertzdorf J, Sutherland JS, et al. Metabolite changes in blood predict the onset of tuberculosis. Nat Commun. 2018;9:5208. [DOI] [PMC free article] [PubMed] [Google Scholar]
- 30. Wang F, Hou HY, Wu SJ, et al. Using the TBAg/PHA ratio in the T‐SPOT((R)).TB assay to distinguish TB disease from LTBI in an endemic area. Int J Tuberc Lung Dis. 2016;20:487‐493. [DOI] [PubMed] [Google Scholar]
- 31. Bosco MJ, Hou H, Mao L, et al. The performance of the TBAg/PHA ratio in the diagnosis of active TB disease in immunocompromised patients. Int J Infect Dis. 2017;59:55‐60. [DOI] [PubMed] [Google Scholar]
- 32. Luo H, Zhu B, Gong L, Yang J, Jiang Y, Zhou X. The value of serum prealbumin in the diagnosis and therapeutic response of tuberculosis: a retrospective study. PLoS One. 2013;8:e79940. [DOI] [PMC free article] [PubMed] [Google Scholar]
- 33. Niyongabo T, Henzel D, Idi M, et al. Tuberculosis, human immunodeficiency virus infection, and malnutrition in Burundi. Nutrition. 1999;15:289‐293. [DOI] [PubMed] [Google Scholar]
- 34. Zweig MH, Campbell G. Receiver‐operating characteristic (ROC) plots: a fundamental evaluation tool in clinical medicine. Clin Chem. 1993;39:561‐577. [PubMed] [Google Scholar]
- 35. Hanley JA, McNeil BJ. The meaning and use of the area under a receiver operating characteristic (ROC) curve. Radiology. 1982;143:29‐36. [DOI] [PubMed] [Google Scholar]
- 36. Bolboaca SD. Medical diagnostic tests: a review of test anatomy, phases, and statistical treatment of data. Comput Math Methods Med. 2019;2019:1891569. [DOI] [PMC free article] [PubMed] [Google Scholar]
- 37. DeLong ER, DeLong DM, Clarke‐Pearson DL. Comparing the areas under two or more correlated receiver operating characteristic curves: a nonparametric approach. Biometrics. 1988;44:837‐845. [PubMed] [Google Scholar]
- 38. Furin J, Cox H, Pai M. Tuberculosis. Lancet. 2019;393:1642‐1656. [DOI] [PubMed] [Google Scholar]
- 39. World Health Organization . The End TB Strategy. Geneva, Swtzerland: World Health Organization; 2015. [Google Scholar]
- 40. Churchyard GJ, Swindells S. Controlling latent TB tuberculosis infection in high‐burden countries: a neglected strategy to end TB. PLoS Med. 2019;16:e1002787. [DOI] [PMC free article] [PubMed] [Google Scholar]
- 41. Keshavjee S, Amanullah F, Cattamanchi A, et al. Moving toward tuberculosis elimination: critical issues for research in diagnostics and therapeutics for tuberculosis infection. Am J Respir Crit Care Med. 2019;199:564‐571. [DOI] [PMC free article] [PubMed] [Google Scholar]
- 42. Petersen E, Chakaya J, Jawad FM, Ippolito G, Zumla A. Latent tuberculosis infection: diagnostic tests and when to treat. Lancet Infect Dis. 2019;19:231‐233. [DOI] [PubMed] [Google Scholar]
- 43. Hoppe LE, Kettle R, Eisenhut M, Abubakar I. Tuberculosis–diagnosis, management, prevention, and control: summary of updated NICE guidance. BMJ. 2016;352:h6747. [DOI] [PubMed] [Google Scholar]
- 44. Meier NR, Jacobsen M, Ottenhoff THM, Ritz N. A systematic review on novel mycobacterium tuberculosis antigens and their discriminatory potential for the diagnosis of latent and active tuberculosis. Front Immunol. 2018;9:2476. [DOI] [PMC free article] [PubMed] [Google Scholar]
- 45. Gebreselassie N, Falzon D, Zignol M, Kasaeva T. Tuberculosis research questions identified through the WHO policy guideline development process. Eur Respir J. 2019;53:1802407. [DOI] [PubMed] [Google Scholar]
- 46. Hatherill M, Chaisson RE, Denkinger CM. Addressing critical needs in the fight to end tuberculosis with innovative tools and strategies. PLoS Med. 2019;16:e1002795. [DOI] [PMC free article] [PubMed] [Google Scholar]
- 47. Cegielski JP, McMurray DN. The relationship between malnutrition and tuberculosis: evidence from studies in humans and experimental animals. Int J Tuberc Lung Dis. 2004;8:286‐298. [PubMed] [Google Scholar]
- 48. Iliaz S, Iliaz R, Ortakoylu G, Bahadir A, Bagci B, Caglar E. Value of neutrophil/lymphocyte ratio in the differential diagnosis of sarcoidosis and tuberculosis. Ann Thorac Med. 2014;9:232‐235. [DOI] [PMC free article] [PubMed] [Google Scholar]
- 49. Luo Y, Xue Y, Lin Q, et al. A combination of iron metabolism indexes and tuberculosis‐specific antigen/phytohemagglutinin ratio for distinguishing active tuberculosis from latent tuberculosis infection. Int J Infect Dis. 2020;97:190‐196. [DOI] [PubMed] [Google Scholar]
- 50. Kant S, Gupta H, Ahluwalia S. Significance of nutrition in pulmonary tuberculosis. Crit Rev Food Sci Nutr. 2015;55:955‐963. [DOI] [PubMed] [Google Scholar]
- 51. Wang F, Yu J, Zhou Y, et al. The use of TB‐specific antigen/phytohemagglutinin ratio for diagnosis and treatment monitoring of extrapulmonary tuberculosis. Front Immunol. 2018;9:1047. [DOI] [PMC free article] [PubMed] [Google Scholar]
- 52. Liao CH, Lai CC, Tan CK, et al. False‐negative results by enzyme‐linked immunospot assay for interferon‐gamma among patients with culture‐confirmed tuberculosis. J Infection. 2009;59:421‐423. [DOI] [PubMed] [Google Scholar]
Associated Data
This section collects any data citations, data availability statements, or supplementary materials included in this article.
Supplementary Materials
Figure S1
Data Availability Statement
The data that supports the findings of this study are available in the article and supplementary materials. Further enquiries can be directed to the corresponding authors.