Abstract
Adverse drug reactions (ADRs) are of major concern in drug safety. However, due to the biological complexity of human systems, understanding the underlying mechanisms involved in development of ADRs remains a challenging task. Here, we applied network sciences to analyze a tripartite network between 1000 drugs, 1407 targets, and 6164 ADRs. It allowed us to suggest drug targets susceptible to be associated to ADRs and organs, based on the system organ class (SOC). Furthermore, a score was developed to determine the contribution of a set of proteins to ADRs. Finally, we identified proteins that might increase the susceptibility of genes to ADRs, on the basis of knowledge about genomic structural variation in genes encoding proteins targeted by drugs. Such analysis should pave the way to individualize drug therapy and precision medicine.
Keywords: Network sciences, drug safety, pharmacology, adverse drug reactions, precision medicine
1. Introduction
The occurrence of adverse drug reactions (ADRs) is an important concern for the health of patients as well as for the healthcare sector as it costs several billion dollars every year. ADRs account for 5 % to 7 % of all hospitalized individuals and represent the fifth most common cause of death in hospitals.[ 1 , 2 , 3 ] ADR is defined as a noxious and unintended response to drug therapy at a normal dose. Several factors, including polypharmacy, age, type of prescribed medicines, and genomic variations, might influence its occurrence. [4] For example, drug‐drug interactions (DDIs) from combined medication have been reported to account for 30 % of all ADRs. [5] In addition, genetic factors and structural variations may predispose a person to some ADRs. It has been reported that pharmacogenomics accounts for about 80 % of the variability in drug efficacy and safety. [6] Therefore, identifying the underlying mechanisms of these ADRs is necessary to limit their severity and mortality and to improve drug safety.
As a large number of drugs interact with more than a single target, perturbated protein interaction network system‐wide approaches may be more suitable to capture the effects of drugs on the human body.[ 7 , 8 ] A variety of methods linking ADRs to drug actions have been proposed. One common approach is to correlate the chemical structure of a drug compound with a particular set of ADRs.[ 9 , 10 , 11 ] However, chemically unrelated structures might share ADRs, targeting similar off‐targets or pathways. To overcome this limitation, methods based on target profiling similarity and side effect similarity have been investigated.[ 12 , 13 ] Campillos et al. [14] proposed a method based on side effect similarity to associate drug pairs with common protein targets, whereas Fliri et al. [15] adopted a systems biology approach, showing that drugs with similar bioactivity profiles tend to cause similar side effects. In another study, Lounkine et al. developed an enrichment score that associates targets with ADRs based on the likelihood of the target‐ADR pairs co‐occurring as compared to random associations. [16] Garcia‐Serna and Mestres [17] assigned a strength score between drug and secondary effects (SE) depending on the reporting frequency among the five SE sources used in their study, where “1” denoted presence of SE in all sources, and “0.2” denoted presence in only one source.
More recently, systems pharmacology approaches, combining network sciences and chemical biology, have been developed to predict and understand ADRs. Network sciences allow the integration of heterogeneous data sources and the quantification of their interactions.[ 18 , 19 ] Several studies have reported new insights on ADRs based on network representation and analysis. A bipartite graph and supervised machine learning were developed to predict new drug‐protein pairs by combining chemical space (chemical structure similarity), genomic space (amino acid similarity), and pharmacological effect. [20] Based on the topological properties of protein‐protein interactions, network biology methods were applied to identify proteins involved in specific ADRs.[ 21 , 22 ] Chen et al. performed an ADR‐protein network and identified 41 network modules related to specific ADRs. [23] Oprea et al. included tissue information on a drug‐target‐SE network and reported that a drug is more likely to cause SE in the organ/tissue where it is more likely to accumulate. [24] Recently, a combined deep learning and biomedical tripartite network approach to predict drug‐ADR associations was reported. [25]
In the present study, we developed a network biology model that complements the ones previously mentioned to identify and prioritize drug targets involved in specific ADRs as well as in more general terms, based on the system organ class (SOC) implemented in the Medical Dictionary for Regulatory Activities (MedDRA). [26] In addition, we included genomic structural variation (SV) information in the models to determine drug target associations contributing to the highest ADR susceptibility in individuals.
2. Material and Methods
2.1. Data
2.1.1. DrugBank
To build the network model, we used the DrugBank database v5.1.5. [27] It is a free online database with a wide range of information on drugs, notably drug‐target relationships. Considering all drugs, and only human proteins, we collected 11,355 small molecules targeting 3510 proteins, reaching 24,579 drug‐target interactions.
2.1.2. DrugCentral
DrugCentral is a drug information resource, which includes, among others, Food and Drug Administration (FDA) Adverse Event Reporting System (FAERS). [28] The likelihood ratio test (LRT) for the safety signal detection method proposed by Huang et al. was used. [29] Any drug‐ADR with a likelihood ratio (llr) superior to the likelihood ratio threshold was conserved in our analysis, giving us 92,794 associations with 8501 unique ADRs. Moreover, on the basis of the Medical Dictionary for Regulatory Activities (MedDRA), ADRs can be categorized using the System Organ Class (SOC) classification, which is the highest level in MedDRA hierarchy. [26] Therefore, all the compiled ADRs were categorized through the 27 SOCs, representing them at the level of organs and body systems, including other special categories (e. g., social factors, surgery, poison, and injury). The SOC abbreviations are described in Table S1 in the Supporting Information.
2.1.3. Database of Genomic Variants
For information on the genomic structural variation observed in the population, we used the Database of Genomic Variants (DGV). [30] DGV provides high‐quality structural variations (SVs), defined as a region of DNA elements approximately 1 kb and larger and can include inversions and balanced translocations or genomic imbalances (insertions and deletions), commonly referred to as copy number variants (CNVs). The content of DGV represents SV identified in healthy control samples from large published cohorts and integrated by the DGV team. This database contained 8 million entries in 2019. We worked with the latest release available from the GRCh37(hg19) assembly of supporting variants section (http://dgv.tcag.ca/dgv/docs/GRCh37_hg19_supportingvariants_2020‐02‐25.txt). We extracted SVs with variant subtypes, including “deletion”, “duplication”, “loss” and “gain”. SVs without frequency and gene information were removed. This leads to 83541 SVs with frequencies. For clarity, we combined deletion and loss under the term “loss” and duplication and gain to the term “gain”.
2.2. Tools
2.2.1. Network Development & Representation
All compiled data are represented as a graph. A graph is a mathematical model consisting of a set of nodes defined by properties that are linked by relationships (edges). We used the Neo4j tool (www.neo4j.com), which is a high‐performance NOSQL graphics database using Cypher‐based query commands. Data collected from the DrugBank, DrugCentral, and DGV databases were integrated together into a network. First, the drug‐target reported in DrugBank was considered. The SV information from the DGV was then connected to the targets, forming a drug‐target‐SV network. In parallel, the drug‐ADR‐SOC network was built from DrugCentral data. Finally, we merged both networks. As we have no information about specific target‐ADRs, putative links were added to the drug‐ADR associations, based on the assumption that if a drug has an ADR, then the protein targets may be causing it.
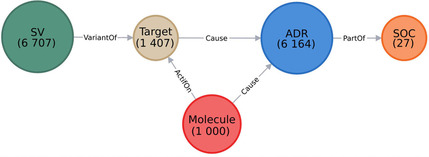
We deleted the nodes that either did not have any link, or did not have a link considering all integrated collected data (for instance, if a drug is connected to a target, but had no ADR linked to it, we would remove this specific molecule node). This step allowed to refine and reduce the compiled data, and to keep only a fully linked graph (Figure 1A). An example is also represented in Figure 1B with the drug bivaluridin
Figure 1.
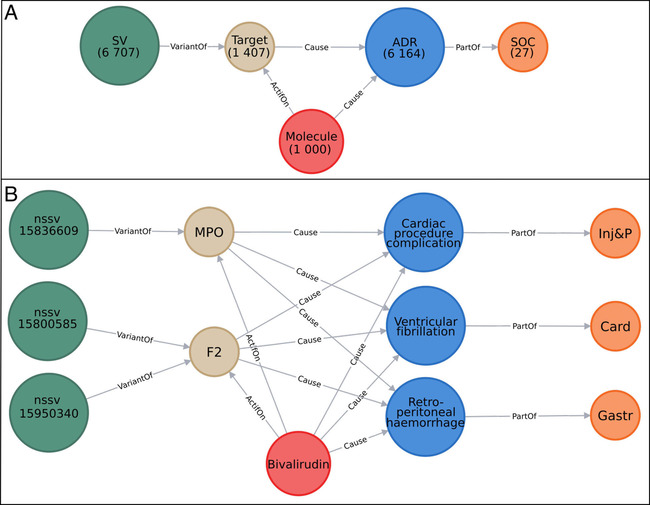
A) Overview of the integrative developed network. The nodes are represented by circles and colored according to their labels. The numbers of nodes in the entire network are written below their labels. B) Example of a part of the network. Here, 3 nodes “SV” are represented in dark green and named after their variant accession number, 2 nodes “Target” in beige named after their gene name, 1 node “Molecule” in red named after the molecule name, 3 nodes “ADR” in blue named after their ADR term, and 3 nodes “SOC” in orange named after their SOC abbreviation. The edges (in gray) show the relations between different nodes. This network was created using the Neo4j tool.
2.2.2. Networks Analysis
Several parameters were considered to analyze the three networks (Drug‐ADR, Drug‐Target and, Drug‐Target‐ADR). Among them, we investigated the following:
Network density measures the fraction of edges in the network, compared to the theoretical maximum number of edges connecting each node.
Network centrality is a measure of how central its most central node is in relation to all the other nodes.
The degree of a node corresponds to the number of edges connected to a node.
Network heterogeneity measures the variance of the connectivity distribution in a network.
Betweenness centrality is the frequency with which the shortest paths between any pair of nodes pass through that node. Betweenness centrality estimates the global influence of a node in controlling the interaction between a pair of nodes passing through this node in the network. A node with high betweenness centrality is usually a node concentrated in a dense subnetwork with many connections to other nodes. Such a node has a larger impact on the information flow in the global network. [31] Betweenness centrality is usually associated with closeness centrality, measuring the importance of a node in a subnetwork. It assumes that the closer a node is to other nodes, the more likely it is to be included in the shortest paths.
Radiality is a node centrality index. If the radiality is high, it means that, with respect to its diameter, the node is generally closer to the other nodes, whereas low radiality means that the node is peripheral.
The topological coefficient is a relative measure of the extent to which a node shares its neighbors with other nodes. Nodes that have one or no neighbors are assigned a topological coefficient of zero.
The connectivity of a node is the number of its neighbors. The neighborhood connectivity of a node n is defined as the average connectivity of all neighbors of n.
For, the drug‐target‐ADR network, the drug‐ADR linkages were removed, to conserve only the Drug‐Target‐ADR‐SOC connections in the network indices calculation.
All analyses were performed using R [32] and the Network Analysis plugin from Cytoscape (v.3.6.1) (www.cytoscape.org). Some figures required special R packages such as “circlize” [33] to produce the chord diagram, and “lattice” [34] and “ggplot2”, [35] which produce various types of plots.
3. Results and Discussion
3.1. Drug‐ADR and Drug‐SOC Networks
Based on the 1000 drugs from the Drugbank, we collected 6164 ADRs from DrugCentral. To analyze the multiple ADR‐drug annotations, an undirected network‐based model was developed. Although such a large model is difficult to visualize, network analysis allows the identification of some interesting features and modules related to the topology of the graphs. The obtained drug‐ADR network was sparse, with a total of 7164 nodes (drugs and ADRs combined). It has a low network density (0.003), a network heterogeneity of 2.98 (tendency to contain hubs), an average number of 24 neighbors, and a network centrality of 0.21 (close to 0 when all nodes have the same centrality and close to 1 when one actor has the maximal centrality). ‘Nausea’, ‘Vomiting’ and ‘Drug ineffective’ are the ADRs with the highest closeness centrality (around 0.48), and radiality (around 0.86) i. e. they have the highest number of drugs connected (407, 402 and 390 respectively). Methotrexate (used in acute lymphoblastic leukemia, breast cancer, rheumatoid arthritis), alendronic acid (indicated for the treatment of osteoporosis), and prednisone (an anti‐inflammatory or immunosuppressive drug derived from cortisone) show the highest number of links to ADRs (1561, 1422, and 1377, respectively). Interestingly, 155 drugs are associated with only one ADR (293 drugs have less than five ADRs), and 1626 ADRs are only related to one drug (3718 ADRs are connected to less than five drugs). However, a single ADR for a drug does not mean that this ADR appears only for this drug. For example, prucalopride, a drug indicated for the treatment of chronic idiopathic constipation, shows ‘Vomiting’ as unique ADR, even if ‘Vomiting’ is connected to 402 drugs. Similarly,“Agoraphobia” was the only ADR seen with the antidepressant paroxetine. However, this drug is annotated to 449 ADRs. An interesting feature is the topological coefficient (TC), which measures how much a node shares its neighbors with other nodes. For example, the ADR ‘Mental disability’ is indicated with two drugs and has a TC of 1, that is, the drugs aminophylline and theophylline are annotated for the same 55 ADRs (Neighborhood Connectivity score). Drugs sharing the same set of ADRs can be analogs – such as droxidopa and norepinephrine for the ‘Tracheal atresia’ ADR, mycophenolate mofetil and mycophenolic acid for ‘Wound infection pseudomonas’ ADR – but also structurally different, although indicated for the same treatment (fluorouracil and capecitabine for ‘Tumor perforation’ or atovaquone and proguanil for ‘Plasmodium falciparum infection’).
Based on the ADR‐drug interaction pairs, it is possible to create an ADR‐ADR network that reaches close to 5 million unique interactions between 6164 ADR terms. This network allows the identification of ADRs interrelated to other ADRs by large sets of drugs. This is the case, for example, with the ADRs ‘Nausea’ and ‘Vomiting’ sharing 360 drugs and ‘Dizziness’ and ‘Nausea’ sharing 288 drugs. Some ADRs are also related to common blood tests to evaluate liver problems such as increased alanine aminotransferase and increased aspartate aminotransferase, which share 219 drugs. Therefore, although many drugs have common general ADRs, drugs may also be related to specific ADRs. In the second step, each ADR has been annotated to one of the 27 SOCs defined in MedDra. Using this classification, we developed an SOC‐SOC network to visualize the 27 SOC interactions by drugs (Figure 2). The larger the SOC, the more the drugs depict ADRs for this SOC. Similarly, the larger the edge between the two SOCs, the less the drugs have specific ADRs. We observed a fully connected network between the 27 SOCs. Globally, the ‘General disorders and administration site conditions’, the ‘Injury, poisoning and procedural complications’, and the ‘Nervous System disorders’ are the most targeted SOCs by drugs with 684, 653, and 616 drugs, respectively. ‘Reproductive system and breast disorders’, ‘Endocrine disorders’, and ‘Ear and labyrinth disorders’ are less impacted with 144, 156 and 170 drugs, respectively (Figure 2). The majority of the SOCs are highly connected to the ‘General disorders and administration site conditions’. In addition, many compounds with'Nervous System disorders’ also present ‘Pregnancy, puerperium, and perinatal condition’ (182 drugs). Similarly, ‘Cardiac disorders’ and ‘Vascular disorders’ (361 drugs) are linked as well as ‘Gastrointestinal disorders’ with ‘Injury, poisoning, and procedural complications’ (458 drugs). We can observe that drugs annotated to ‘Infections and infestations’ are also linked to ‘Respiratory, thoracic, and mediastinal disorders’, ‘Gastrointestinal disorders’, and ‘Renal and urinary disorders’, which might give some input about the comorbidities seen with the Covid‐19. [36]
Figure 2.
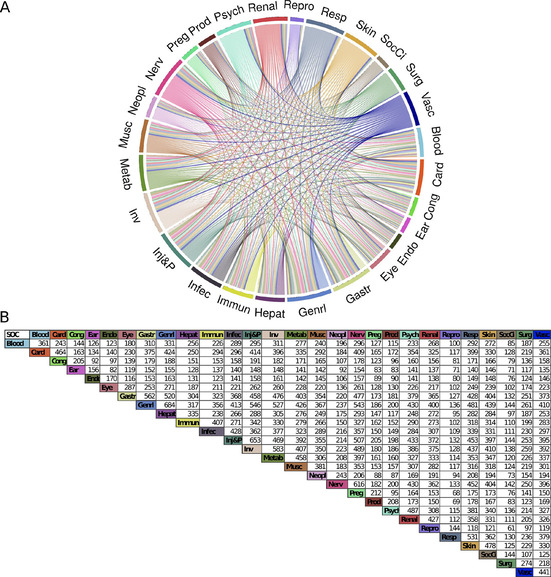
A) System Organ Class (SOC) network. Each colored segment (node) corresponds to one SOC and is named according to its SOC abbreviation name (Supporting information). The segment size depicts the number of drugs associated with their corresponding SOC. Each edge represents a drug that causes an ADR linked to their corresponding SOCs. The chord diagram was developed using the R package circlize. B) SOC association counting table. Each value represents the number of drugs common to both SOCs.
3.2. Drug‐Target‐ADR and Drug‐Target‐SOC Networks
After analyzing both drug‐ADR and drug‐SOC interactions, we included available drug target information from the DrugBank database in the previously developed network and performed a tripartite network analysis to assess drug targets that are potentially associated with an ADR or an SOC. The principle is the more drugs share common ADRs and proteins, the more the proteins are associated to these ADRs. By integrating the drug target information into the drug‐ADR model, we built a network of 515959 interactions between drugs, targets, ADRs, and SOCs. The full list of the network scores obtained for each node is available in the Supporting Information (Table S2). The drug‐target‐ADR network is still sparse with a network density of 0.014 between the 8571 nodes and a similar network heterogeneity (2.43). The average number of neighbors (120) as well as the network centrality (0.66) is higher, meaning that some nodes (proteins) are more central than others (drugs and ADRs). Proteins targeted by drugs are essentially cytochromes and transporters, except for the serum albumin protein (ALB) (Table S3 in Supporting Information). As primary targets are drug‐metabolizing enzymes (DMEs), these results are not surprising.[ 37 , 38 ] If we remove the cytochrome enzymes, proteins such as ALB, SLC22 A6, PTGS1, UGT2B7, UGT1 A9, and PTGS2 are highly related to ‘Acute kidney injury’ (Figure 3). Some of these proteins have been associated with this adverse effect in studies.[ 39 , 40 , 41 ] ‘Somnolence’ is highly related to ADRA1 A, but so far, no clear relationship has been reported in the literature. Finally, ‘Toxicity to various agents’ is highly associated with the human H1 receptor (HRH1). Although antihistamine drugs are associated with many ADRs, a recent study has reported that the polymorphism of HRH1 may be related to the severity of ADR, notably sedation. [42]
Figure 3.
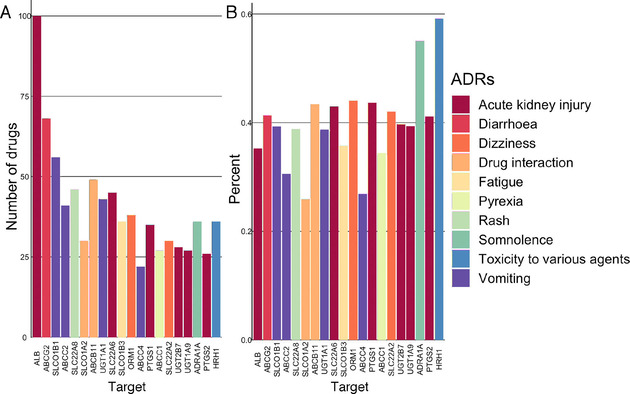
A) The 20 proteins associated with the highest number of drugs for an ADR. B) The proportion of these 20 proteins associated with an ADR among the other proteins linked to this ADR.
In the tripartite network, 84 drugs were annotated to a unique protein (449 drugs with less than five proteins). Through the drug‐ADR relationships, it is possible to assume that some proteins have an impact on specific ADRs. For example, the 4‐hydroxyphenylpyruvate dioxygenase protein (HPD) is the unique target of the drug nitisone in DrugBank and is linked to the ADR ‘Amino acid level increased’, ‘Liver transplant’ and ‘Hepatocellular carcinoma’. The squalene monooxygenase protein (SQLE) is linked to the drug naftifine and the ADR ‘Blister’, and the Oxytocin Receptor (OXTR) connect the drug carbetocin and the ADR ‘Acute kidney injury’. Interestingly, 166 proteins (11 % of the drug targets) connect one drug to only one ADR. Similarly, we can estimate whether these proteins are central in the linkage between drugs and ADRs. For example, the protein GNRHR2 is linked to the ADR ‘Ovarian hyperstimulation syndrome’ and the drug nafarelin (Figure 4A). GNRHR2 has a low Neighborhood Connectivity score (16.5), and its topological coefficient (TC) is one of the lowest (0.51). This means that GNRHR2 is relatively specific to this ADR and has a high possibility of being involved with this ADR. Protein DDAH2 has the highest Neighborhood Connectivity score (424), but a higher radiality (0.67) and a lower TC (0.50). This is due to DDAH2 being linked to citrulline that is annotated to 14 targets and the ADR “drug ineffective”, which is linked to 834 proteins. This protein does not seem to be a central partner in this ADR.
Figure 4.
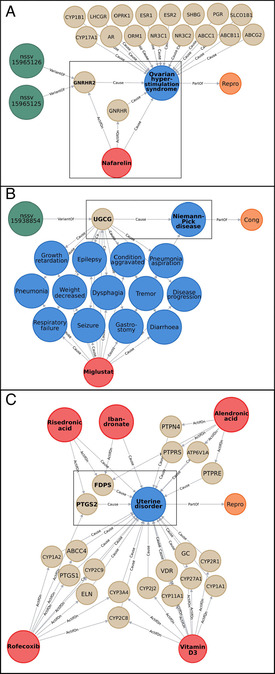
Zoomed‐in parts of the network as example. “SV” nodes are represented in dark green and named after their variant accession number, “Target” nodes in beige named after their gene name, “Molecule” nodes in red named after their name, “ADR” nodes in blue named after their name, and “SOC” nodes in orange named after their SOC abbreviation. The edges (in gray) show the relations between different nodes. Nodes cited in the text are framed in black and written in bold. A) Example of subnetwork involving the target “GNRHR2” and the ADR “Ovarian hyperstimulation syndrome”. B) Example of subnetwork involving the target “UGCG” and the ADR “Niemann‐Pick disease”. Only 13/18 ADRs linked to the miglustat molecule are represented. C) Example of subnetwork involving the ADR “Uterine disorder”, its 5 molecules and 20 targets.
In contrast, there is a set of 23 proteins (P5CR2, P3H2, PPIC, EPRS, P3H1, PYCR1, PPIA, P4HA1, L3HYPDH, P3H3, PPIG, PYCR2, SLC6 A14, PYCRL, PROSC, PPIF, SLC6 A7, PPIB, P4HA2, PARS2, PPIH, SLC16 A10, PRODH) that are linked to the nutraceutical Proline and the ADR ‘Fetal growth restriction’.
With a TC of 0.64, these nodes are more specific to this ADR. The proteins with the highest connections are essentially cytochromes and transporters. CYP3A4 has the highest closeness centrality (0.66) and radiality (0.91). This is the most central node. However, its TC is the lowest (0.06), meaning that there is no clear relationship between a set of drugs and a set of ADRs with which CYP3 A is involved.
Finally, 16 ADRs are associated with only one protein. For example, ‘Niemann‐Pick disease’ is linked only with the UGCG protein, and the drug miglustat (Figure 4B); the ADR ‘Mixed dementia’ is linked with the cytochrome CYP1A2, and the drug bendamustine; and the ‘Implant site rash’ is associated to the GNRHR receptor, and the drug histrelin. However, these proteins can be related to other ADRs, as many drugs influence these proteins. The Neighborhood Connectivity score can inform us if the nodes (drugs and proteins) linked to an ADR are highly connected to other ADRs. For ‘Niemann‐Pick disease’, the UGCG protein is connected to 18 other ADRs through the drug miglustat (see Figure 4B where only 13 of its ADRs are shown), whereas for ‘Mixed dementia’, CYP1A2 is linked to 3547 ADRs through 131 drugs. On average, 18.5 proteins are predicted to have an effect on more than one ADR, confirming the possible role of some proteins in many ADRs. To estimate the contribution of each protein to an ADR, we developed an equation (eq. 1) combining the proportion of the proteins targeted by a drug and adding the ensemble of proportions for all drugs involved in the same ADR.[Eq. 1]
With
Dg,i,k : Drug known to cause ADRx, That also interact with the protein associated with ADRx.
TD g,i,k : Total number of proteins interacting with Dg,i,k.
Protein1…n : Protein associated with ADRx.
Such an equation allows the assessment of the contribution of each protein to an ADR. The information is available in the Supporting Information (Table S4).
For example, the ADR ‘Prostate cancer stage IV’, which is linked to one drug (leuprolide) that targets two proteins (GNRHR and CYP3A4), will have a contribution of 0.5 to GNRHR and 0.5 to CYP3A4. The ADR ‘Uterine disorder’ is linked to five drugs that are linked to 20 proteins (Figure 4C). Integrating proteins targeted by these drugs, the farnesyl pyrophosphate synthase (FDPS) obtains a score of 1.7, whereas the second one (PTGS2) obtains 0.625, and the other proteins less than 0.23. Therefore, these two proteins could contribute the most to this ADR. Of course, for some general ADR like ‘Nausea’ for which 944 proteins are linked, the contribution of each protein might be questionable, but for many ADRs for which we have fewer proteins, this approach can be used to prioritize proteins causing ADRs.
Finally, we developed a drug‐target‐SOC network. At the SOC level, 177 proteins are linked specifically to one SOC. Many proteins do not seem to be specific to one SOC. Many proteins targeted by drugs are linked to ‘Metab’, ‘Infec’, ‘Gastr’, and ‘Inv’ in majority (Figure 5 and Table S5 in Supporting Information).
Figure 5.
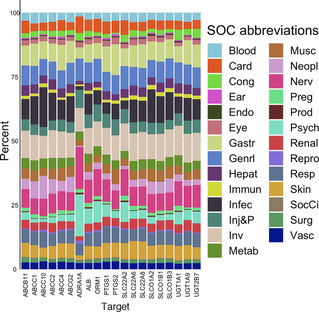
Proportion of drug‐SOC associated with the 20 proteins having the most drug‐ADR associations. Each color corresponds to an SOC and the size of the color bar the proportion of drug‐ADR associations for the protein to a specific SOC.
Through the SOC‐SOC network, we can observe that many proteins are involved in two SOCs. The ‘Nervous System disorders’ share more than 1000 targets with the ‘General disorders and administration site conditions’, the ‘Injury, poisoning and procedural complications’, and the ‘Gastrointestinal system’. The ‘Respiratory system’ is also highly connected with other systems. The ‘Reproduction systems’ and the ‘Social circumstances’ are SOCs that are the least connected to other systems with 400 to 500 proteins involved in the two SOCs (Figure 6).
Figure 6.
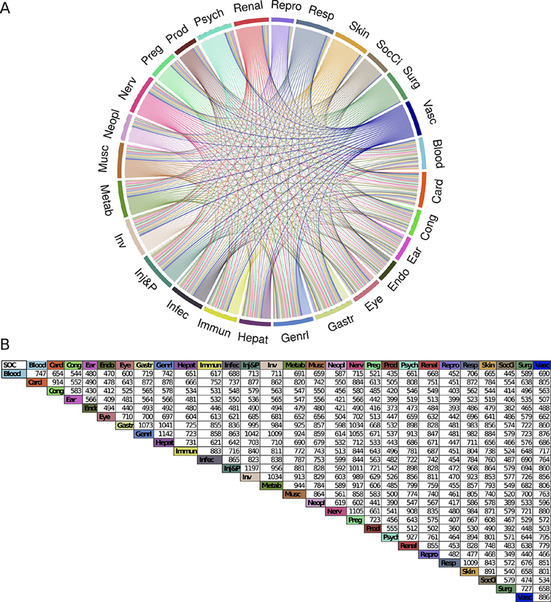
Chord diagram of the SOC‐SOC interaction network based on the target SOC information.
3.3. Structural Variations (SVs) on Drug Targets Associated with ADRs
Matching the 1407 proteins with the data from the Database of Genomic Variants (DGV), we identified 1117 drug targets having SVs; 794 SVs were defined as ‘gain’ (replication of the protein) and 957 SVs defined as ‘loss’ (deletion of the protein) (Table S6 in Supporting Information). Figure 7 shows the drug targets with the highest frequency of deletion, replication, and SV associated with the highest number of drugs.
Figure 7.
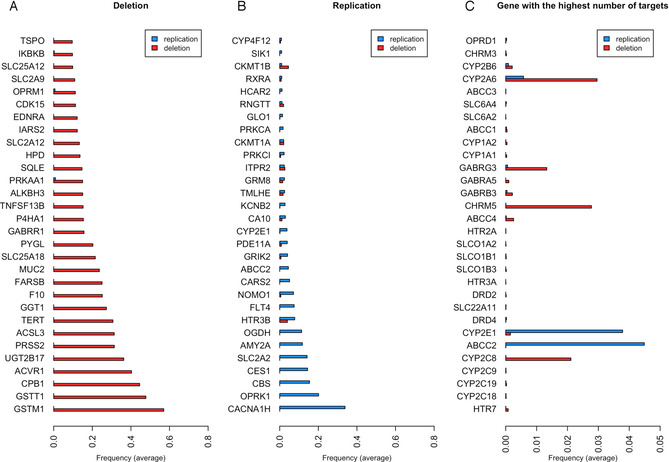
Frequency of structural variations (SVs) according to the variant subtype (deletion or duplication) for A) the 30 genes with the highest frequency of deletion, B) the 30 genes with the highest frequency of replication, and C) the 30 genes with the highest number of drugs.
One of the proteins that shows the highest frequency of replication is opioid receptor kappa (OPRK1). The polymorphism of this protein has recently been reported to affect pain relief from opioids. [43] Studies on cancer and postoperative patients show that carriers of the homozygote G allele have higher pain scores and require higher morphine doses, thereby indicating reduced signaling efficacy and a possibly declined receptor expression. [44] A total of 52 drugs target this protein, and some of them show as ADR ‘Drug abuse’, ‘Drug tolerance’, ‘Drug hypersensitivity’, ‘Drug ineffective’, ‘Drug intolerance’, or ‘Drug withdrawal syndrome’ and so might be related to this SV. CES1 also has a high frequency of replication. CES1 is involved in the catalysis of the hydrolytic biotransformation of a variety of compounds containing an ester, amide, or carbamate function to their respective free acids and alcohols. [45] Numerous drugs, including the psychostimulant methylphenidate (MPH) used in the treatment of attention‐deficit hyperactivity disorder (ADHD), angiotensin‐converting enzyme inhibitors (quinapril, imidapril, temocapril, and cilazapril), anti‐cancer agents (CPT‐11), and narcotics and analgesics (cocaine and meperidine) are all hCES1 substrates, and the ADRs associated with these drugs could involve in some individuals an SV of this protein. [46] On the other hand, glutathione S‐transferase, GSTM1, and GSTT1 genes are more frequently subject to deletion. Studies have reported the susceptibility of these enzymes to clinical toxicities, notably gastrointestinal toxicity. [47] This is a typical ADR that we see, for example, with acetaminophen (paracetamol). The opioid receptor mu (OPRM1) is also among the most frequently deleted genes. Therefore, opioid receptors seem to have frequent SV (deleted or replicated) that might explain ADRs related to drug inefficacy. In general, we retrieved drug‐metabolizing enzymes (notably cytochromes) with the most frequent SV. As these proteins are also highly targeted by drugs, we can assume that the susceptibility to ADRs caused by an SV on these targets is not negligible. For example, the antidepressant fluoxetine targets CYP2C9, CYP2C19, CYP1A2, CYP2B6, CYP3A4, CYP3A5, ORM1, SLC6A4, HTR2 C, and KCNH2, which have some of the highest frequencies among SV. We could assume that patients having an SV on one of these proteins and taking this treatment have a greater susceptibility to one of the ADRs linked to this drug. Interestingly, at the top of the list, we can observe the serotonin, dopamine, and noradrenaline neurotransmitter transporters. As they are the primary targets of many antidepressants, it could be one of the explanations for the inefficacy or ADR associated with them. [48]
4. Conclusions
The present study explored the reported ADRs of drugs and the potential drug‐target associations causing these ADRs, using network sciences. Although it is possible to assume the role of some proteins for some specific ADRs, many biological targets are related to several ADRs. Grouping ADRs into SOCs allowed the observation of organs more affected by ADRs, and whether the drug‐specific ADRs were more localized in an SOC or spread over several organs. We have to be aware that some terms such as ‘Drug ineffective’, ‘Device ineffective’ and ‘Therapeutic product ineffective’ are listed as ADRs in the reporting system provided by the FDA, although these terms mean that there is no reaction occurring by the administration of a drug in a normal dose. This is a known situation. As Wysowsky et al. observed, the most frequently reported adverse event was ‘Drug ineffective’. [49]
The findings of ADRs are essentially based on clinical trials or spontaneous reports but are rarely related to genomic variations. The inclusion of structural variations in the drug‐target data is an interesting avenue as the high polymorphism of some genes might contribute to increase the susceptibility to an ADR. In our study, we considered structural variations of more than 1 kb, which cover a complete loss or a large gain of a gene that is important for the functionality of a protein. There are more local genetic variations such as single‐nucleotide polymorphisms (SNPs) which can also be related to the occurrence of ADRs, but the impact of such local variations in a protein target is more difficult to assess. Pharmacogenomic studies investigating the role of genetic variations in drug response and results for some drugs have been reported and can be accessed.[ 50 , 51 ]
Some challenges remain in utilizing the full potential of network sciences to decipher the mechanisms behind drug‐ADR associations and network pharmacology. [52] The coverage of the drug‐target associations is not fully accomplished, and ADRs might be caused by some targets not yet determined for a drug. In addition, our network does not consider the binding affinity value between a drug and a target. Besides, drugs might directly impact the expression of genes. With the opportunity to access omics data, notably transcriptomic data, toxicogenomic studies would allow an analysis of the deregulation of genes and pathways in a specific cell type, tissue, or organ, in the presence of a drug. The integration of such information will be beneficial for obtaining a more comprehensive pharmacological profile of drugs.
Conflict of Interest
None declared.
Supporting information
As a service to our authors and readers, this journal provides supporting information supplied by the authors. Such materials are peer reviewed and may be re‐organized for online delivery, but are not copy‐edited or typeset. Technical support issues arising from supporting information (other than missing files) should be addressed to the authors.
Supplementary
Supplementary
Supplementary
Supplementary
Supplementary
Supplementary
Acknowledgements
We would like to thank the doctoral school “Pierre Louis de santé publique” and the pharmaceutical company Servier for their support on this study. This study contributes to IdEx Université de Paris ANR‐18‐IDEX‐0001.
B. Dafniet, N. Cerisier, K. Audouze, O. Taboureau, Mol. Inf. 2020, 39, 2000116.
References
- 1. Lazarou J., Pomeranz B. H., Corey P. N., JAMA. 1998, 279, 1200–1205. [DOI] [PubMed] [Google Scholar]
- 2. Giardina C., Cutroneo P. M., Mocciaro E., Russo G. T., Mandraffino G., Basile G., Rapisarda F., Ferrara R., Spina E., Arcoraci V., Front. Pharmacol. 2018, 9, 350. [DOI] [PMC free article] [PubMed] [Google Scholar]
- 3. Kongkaew C., Noyce P. R., Ashcroft D. M., Ann. Pharmacother. 2008. , 42, 1017–1025. [DOI] [PubMed] [Google Scholar]
- 4. Patel T. K., Patel P. B., Curr. Drug Saf. 2016, 11, 128–136. [DOI] [PubMed] [Google Scholar]
- 5. Iyer S. V., Harpaz R., LePendu P., Bauer-Mehren A., Shah N. H., J. Am. Med. Inform. Assoc. 2013, 21(2), 353–62. [DOI] [PMC free article] [PubMed] [Google Scholar]
- 6. Cacabelos R., Cacabelos N., Carril J. C., Expert Rev. Clin. Pharmacol. 2019, 12, 407–442. [DOI] [PubMed] [Google Scholar]
- 7. Hopkins A. L., Nat. Chem. Biol., 2008, 4, 682–690. [DOI] [PubMed] [Google Scholar]
- 8. Audouze K., Juncker A. S., Roque F. J., Krysiak-Baltyn K., Weinhold N., Taboureau O., Jensen T. S., Brunak S., PLoS Comput. Biol. 2010, 6: e1000788. [DOI] [PMC free article] [PubMed] [Google Scholar]
- 9. Scheiber J., Jenkins J. L., Sukuru S. C. K., Bender A., Mikhailov D., Milik M., Azzaoui K., Whitebread S., Hamon J., Urban L., et al., J. Med. Chem. 2009, 52, 3103–3107. [DOI] [PubMed] [Google Scholar]
- 10. Atias N., Sharan R., J. Comput. Biol., 2011, 18, 207–218. [DOI] [PubMed] [Google Scholar]
- 11. Ho T−B., Le L., Thai D. T., Taewijit S., Curr. Pharm. Des. 2016, 22, 3498–3526. [DOI] [PubMed] [Google Scholar]
- 12. Boland M. R., Jacunski A., Lorberbaum T., Romano J., Moskovitch R., Tatonetti N., Wiley Interdiscip Rev. Syst. Biol. Med. 2016, 8, 104–22. [DOI] [PMC free article] [PubMed] [Google Scholar]
- 13. Zhou H., Gao M., Skolnick J., Sci. Rep. 2015, 5, 11090. [DOI] [PMC free article] [PubMed] [Google Scholar]
- 14. Campillos M., Kuhn M. M., Gavin A. C., Jensen L. J., Bork P., Science, 2008, 321, 263–266. [DOI] [PubMed] [Google Scholar]
- 15. Fliri A. F., Loging W. T., Volkmann R. A., ChemMedChem, 2007, 2, 1774–1782. [DOI] [PubMed] [Google Scholar]
- 16. Lounkine E., Keiser M. J., Whitebread M. S., Mikhailov D., Hamon J., Jenkins J. L., Lavan P., Weber P. E., Doak A. K., Côté S., et al., Nature, 2012, 486, 361–367. [DOI] [PMC free article] [PubMed] [Google Scholar]
- 17. Garcia-Serna R., Mestres J., Expert Opin. Drug Metab. Toxicol. 2010, 6, 1253–1263. [DOI] [PubMed] [Google Scholar]
- 18.A. L. Barabási, Network Science (Cambridge Univ. Press, 2016).
- 19. Boezio B., Audouze K., Ducrot P., Taboureau O., Mol. Inf. 2017, 36, 1700048. [DOI] [PubMed] [Google Scholar]
- 20. Yamanishi Y., Kotera M., Kanehisa M., Goto S., Bioinformatics. 2010, 26, 246–54. [DOI] [PMC free article] [PubMed] [Google Scholar]
- 21. Jiang Y., Li Y., Kuang Q., Ye L., Wu Y., Yang L., Li M., Anal. Methods 2014. , 6, 2692–2698. [Google Scholar]
- 22. Hwang Y., Oh M., Jang G., Lee T., Park C., Ahn J., Yoon Y., Mol. BioSyst. 2017, 13, 1788–1796. [DOI] [PubMed] [Google Scholar]
- 23. Chen X., Liu X., Jia X., Tan F., Yang R., Chen S., Liu L., Wang Y., Chen Y., Sci. Rep. 2013, 3, 1744. [DOI] [PMC free article] [PubMed] [Google Scholar]
- 24. Oprea T. I., Nielsen S. K., Ursu O., Yang J. J., Taboureau O., Mathias S. L., Kouskoumvekaki l., Sklar L. A., Bologa C. G., Mol. Inf. 2011, 30, 100–111. [DOI] [PMC free article] [PubMed] [Google Scholar]
- 25. Xue R., Liai J., Shao X., Han K., Long J., Shao L., Ai N., Fan X., Chem. Res. Toxicol. 2020, 33, 202–210. [DOI] [PubMed] [Google Scholar]
- 26.Brown E. G., Wood L., Wood S. The Medical Dictionary for Regulatory Activities (MedDRA), Drug Saf.1999. 20, 109–117. [DOI] [PubMed]
- 27. Wishart D. S., Feunang Y. D., Guo A. C., Lo E. J., Marcu A., Grant J. R., Sajed T., Johnson D., Li C., Sayeeda Z., Assempour N., et al., Nucleic Acids Res. 2018, 46, D1074-D1082. [DOI] [PMC free article] [PubMed] [Google Scholar]
- 28. Ursu O., Holmes O. J., Bologa C. G., Yang J. J., Mathias S. L., Stathhias V., Nguyen D. T., Schürer S., Oprea T., Nucleic Acids Res. 2019, 47, D963-D970. [DOI] [PMC free article] [PubMed] [Google Scholar]
- 29. Huang L., Zalkikar J., Tiwari R. C., J. Am. Stat. Assoc. 2011, 106, 1230–1241. [Google Scholar]
- 30. MacDonald J. R., Ziman R., Yuen R. K., Feuk L., Scherer S. W., Nucleic Acids Res. 2013, 42, D986–92. [DOI] [PMC free article] [PubMed] [Google Scholar]
- 31. Harrold J. M., Ramanathan M., Mager D. E., Clin. Ther. 2013, 94, 651–658. [DOI] [PMC free article] [PubMed] [Google Scholar]
- 32.R Core Team. 2017. R: A language and environment for statistical computing. R Foundation for Statistical Computing, Vienna, Austria. URL https://www.R-project.org/.
- 33. Gu Z., Bioinformatics. 2014, 30, 2811–2. [DOI] [PubMed] [Google Scholar]
- 34.D. Sarkar. Lattice: Multivariate data visualization with R. Springer, New York. 2008. ISBN 978-0-387-75968–5.
- 35.H. Wickham. ggplot2: Elegant Graphics for Data Analysis. Springer-Verlag New York. 2016. ISBN 978-3-319-24277–4.
- 36. Richardson S., Hirsch J. S., Narasimhan M., McGinn T., Davidson K. W., et al., JAMA. 2020, doi: 10.1001/jama.2020.6775. [Google Scholar]
- 37. Guengerich F. P., MacDonald J. S., Chem. Res. Toxicol. 2007, 20, 344–369. [DOI] [PubMed] [Google Scholar]
- 38. Danielson P. B., Curr. Drug Metab. 2002. 3, 561–97. [DOI] [PubMed] [Google Scholar]
- 39. Blanco V. E., Hernandorena C. V., Scibona P., Belloso W., Musso C. G., Healthcare. 2019, 7,10. [DOI] [PMC free article] [PubMed] [Google Scholar]
- 40. Faria J., Ahmed S., Gerritsen K. G. F., Mihaila S. M., Masereeuw R., Arch. Toxicol. 2019, 93, 2297–3418. [DOI] [PubMed] [Google Scholar]
- 41. Cheng H.F, Harris R. C., Curr. Pharm. Des. 2005. 11, 1795–804. [DOI] [PubMed] [Google Scholar]
- 42. Li J., Chen W., Peng C., Zhu W., Liu Z., Zhang W., Su J., Li J., Chen X., Pharmacogenomics J. 2020, 20, 87–93. [DOI] [PubMed] [Google Scholar]
- 43. Ho J. W.D, Wallace M. R., Staud R., Fillingim R. B., Pharmacogenomics J. 2019, doi: 10.1038/s41397-019-0131-z. [Google Scholar]
- 44. Nielsen L. M., Olesen A. E., Branford R., Christrup L. L., Sato H., Pain Pract. 2015. 15(6), 580–594. [DOI] [PubMed] [Google Scholar]
- 45. Redinbo M. R., Potter P. M., Drug Discovery Today 2005, 10, 313–25. [DOI] [PubMed] [Google Scholar]
- 46. Nzabonimpa G. S., Rasmussen H. B., Brunak S., Taboureau O., Drug Metab. Pers. Ther. 2016, 31, 97–106. [DOI] [PubMed] [Google Scholar]
- 47. Abbas M., Kushwaha V. S., Srivastava K., Raza S. T., Banerjee M., Br. J. Biomed. Sci. 2018, 75, 169–174. [DOI] [PubMed] [Google Scholar]
- 48. Bousman C. A., Forbes M., Jayaram M., Eyre H., Reynolds C. F., Berk M., Hopwood M., Ng C., BMC Psychiatry. 2017, 17, 60. [DOI] [PMC free article] [PubMed] [Google Scholar]
- 49. Wysowski D. K., Swartz L., Arch. Intern. Med. 2005, 165, 1363–9. [DOI] [PubMed] [Google Scholar]
- 50. Barbarino J. M., Whirl-Carrillo M., Altman R. B., Klein T. E., Wiley Interdiscip Rev. Syst. Biol. Med. 2018, 10, e1417. [DOI] [PMC free article] [PubMed] [Google Scholar]
- 51. Luzum J. A., Pakys R. E., Elsey A. R., Haidar C. E., Peterson J. F., Whirl-Carrillo M., Handelman S. K., Palmer K., Pulley J. M., et al., Clin. Pharmacol. Ther. 2017, 102, 502–510. [DOI] [PMC free article] [PubMed] [Google Scholar]
- 52. Vogt I., Mestres J., Mol. Inf. 2019, 38, e1900032. [DOI] [PubMed] [Google Scholar]
Associated Data
This section collects any data citations, data availability statements, or supplementary materials included in this article.
Supplementary Materials
As a service to our authors and readers, this journal provides supporting information supplied by the authors. Such materials are peer reviewed and may be re‐organized for online delivery, but are not copy‐edited or typeset. Technical support issues arising from supporting information (other than missing files) should be addressed to the authors.
Supplementary
Supplementary
Supplementary
Supplementary
Supplementary
Supplementary


