

Abstract
Aims:
Evaluate the relationship between measures of glycemia with β-cell function and insulin sensitivity in adults with early type 2 diabetes mellitus (T2DM).
Methods:
This cross-sectional analysis evaluated baseline data from 3108 adults with T2DM <10 years treated with metformin alone enrolled in the Glycemia Reduction Approaches in Diabetes: A Comparative Effectiveness (GRADE) Study. Insulin and C-peptide responses and insulin sensitivity were calculated from 2-hour oral glucose tolerance tests. Regression models evaluated the relationships between glycemic measures (HbA1c, fasting and 2-hour glucose), measures of β-cell function and insulin sensitivity.
Results:
Insulin and C-peptide responses were inversely associated with insulin sensitivity. Glycemic measures were inversely associated with insulin and C-peptide responses adjusted for insulin sensitivity. HbA1c demonstrated modest associations with β-cell function (range: r −0.22 to −0.35). Fasting and 2-hour glucose were associated with early insulin and C-peptide responses (range: r −0.37 to −0.40) as well as late insulin and total insulin and C-peptide responses (range: r −0.50 to −0.60).
Conclusion:
Glycemia is strongly associated with β-cell dysfunction in adults with early T2DM treated with metformin alone. Efforts to improve glycemia should focus on interventions aimed at improving β-cell function.
Keywords: beta-cell function, insulin sensitivity, type 2 diabetes, glucose tolerance, glycemic control
1. Introduction
1.1. Impaired β-cell function and decreased insulin sensitivity are key factors in the pathogenesis and progression of type 2 diabetes mellitus (T2DM) 1.
As the β-cell becomes dysfunctional, it is unable to rapidly respond to changes in glucose concentrations and secrete adequate amounts of insulin to maintain normal glucose concentrations. In longitudinal studies, insulin responses to glucose deteriorate over time in those who progress to T2DM, while non-progressors continue to compensate for decreased insulin sensitivity by increasing insulin responses 2,3. The impairment in the insulin response is the result of β-cell dysfunction that precedes the detection of T2DM 2 and continues to progress after diagnosis 4. Using fasting measures, the UK Prospective Diabetes Study (UKPDS) found that despite glucose-lowering treatment, glycemic control deteriorated over time and was associated with deteriorating β-cell function 4.
1.2. Associations between progressively increasing glycemia and declining β-cell function in those with pre-diabetes are well recognized 5–7, being also associated with prospective risk of progression to overt T2DM 8,9.
These relationships have not been well evaluated in early diabetes (<10 years duration), with an assumption that glycemic elevations become dissociated from β-cell function as the latter declines. Evaluating the relationships between clinical measures of glycemia and estimates of β-cell function and insulin sensitivity in those with early T2DM may therefore provide important information about the underlying pathophysiology of β-cell dysfunction. Such information may be informative regarding the potential for reversal or recovery of β-cell function in relation to improvements in glycemia.
1.3. Here we examine the relationships between measures of β-cell function and glycemia in a large cohort of adults with T2DM from the Glycemia Reduction Approaches in Diabetes: A Comparative Effectiveness (GRADE) Study.
According to study requirements, at baseline participants enrolled in the GRADE Study were being uniformly treated for their diabetes with metformin alone (11), and therefore analyses were not confounded by other glucose-lowering treatments. Glycemic measures and dynamic insulin and C-peptide responses to oral glucose from standardized 75-gram oral glucose tolerance tests (OGTTs) were assessed. C-peptide, which is co-secreted by the β-cell with insulin but is not impacted by extraction from the liver 10, was also measured as it provides a measure of the β-cell response with less variability 11. We hypothesized that measures of glycemia would be inversely associated with insulin and C-peptide responses adjusted for insulin sensitivity. We also sought to evaluate the strength of association between different measures of glycemia and β-cell response parameters derived from different time intervals during the OGTT.
2. Materials and Methods
2.1. This is a cross-sectional analysis of baseline data from participants with T2DM enrolled in the GRADE Study.
GRADE is an NIH-funded multicenter study designed to evaluate the effectiveness of four different glucose-lowering medications when added to metformin on glycemic control in adults with T2DM. Rationale and full details of the study design are available on the GRADE website (https://grade.bsc.gwu.edu/ancillary-study-info). The study is being conducted at 36 funded clinical centers with 9 additional sub-sites in the United States. All participants provided written informed consent and the study was approved by each site’s institutional review board.
2.2. Participants
2.2.1. Participants were eligible to enroll in the GRADE Study if they were ≥30 years of age (≥20 years of age if Native American) at the time of T2DM diagnosis, had been diagnosed less than 10 years prior to screening for the study, had an HbA1c between 6.8–8.5% (51–69 mmol/mol), and were taking at least 1000 mg of metformin per day at the end of a run-in period.
Exclusion criteria included: suspected type 1 diabetes, treatment with glucose-lowering medications other than metformin within the past 6 months, ongoing use of medications that could impact glucose metabolism such as systemic corticosteroids, significant medical illness, or organ failure 12.
2.2.2. A total of 5047 adults were enrolled into the GRADE Study and completed the baseline visit prior to treatment randomization.
Insulin has not yet been measured in any of the samples from subjects randomized to the glargine group (n=1263) due to difficulties in measuring insulin with immunoassays in patients treated with glargine. Thus, this group was excluded from this analysis. Also excluded were 321 participants with incomplete glucose data, 350 with incomplete insulin data and 5 with incomplete C-peptide data. Thus, data from a total of 3108 were available for this analysis.
2.3. Study Procedures:
Eligible participants were enrolled and participated in a 4–8 week run-in period during which their metformin dose was increased to the target dose of 2000 mg per day, as tolerated. At the end of run-in, participants returned after an overnight fast of at least 8 hours and underwent a standard 75-gram OGTT. Metformin was not taken on the morning of the test. Participants consumed the glucose drink within 5 minutes and blood samples were drawn at 0, 30, 60, 90 and 120 minutes relative to the start of glucose ingestion. Blood samples for glucose, insulin and C-peptide were separated on-site with serum and plasma aliquoted into cryovials, frozen and shipped on dry ice to the central laboratory where they were assayed.
2.4. Assays:
HbA1c was measured in EDTA whole blood on the Tosoh HPLC Glycohemoglobin Analyzer (Tosoh Medics, Inc., San Francisco, CA) using an automated high-performance liquid chromatography method. This method is calibrated against the National Glycohemoglobin Standardization Program (NGSP) standards. Plasma glucose was measured in EDTA plasma with a hexokinase method on the Roche Cobas c501 chemistry analyzer (Roche Diagnostics, Indianapolis, IN). Insulin and C-peptide were measured in EDTA plasma on the Roche Cobas e601 immunoassay analyzer using a sandwich immunoassay (Roche Diagnostics, Indianapolis, IN 46250).
2.5. Calculations:
Insulin sensitivity (HOMA2-S) was calculated using the HOMA2 Calculator version 2.2.3 (Diabetes Trials Unit, University of Oxford, Oxford, UK) 13,14 The Matsuda index of insulin sensitivity was calculated as 104/(I0 × G0 × Im × Gm)½, where G0 and Gm are the fasting and mean glucose in mg/dL and I0 and Im are the fasting and mean insulin in mIU/L 15. The insulinogenic index (IGI), a measure of the early insulin response, was calculated as the change in insulin divided by the change in glucose from 0 to 30 minutes. A similar C-peptide index (CPI) for the early response was calculated as the change in C-peptide divided by the change in glucose from 0 to 30 minutes. For each OGTT the mean incremental area under the curve (incAUC) for glucose, insulin and C-peptide was calculated as the AUC/120 minus the fasting value. The ratios of total incAUC insulin and C-peptide responses were divided by the total incAUC glucose (incAUCins/incAUCglu and incAUC-CP/incAUCglu) to reflect total insulin and C-peptide responses to glucose over the OGTT. The late insulin response was calculated as 100 × (InsulinAUC60–120/60-I0)/GlucoseAUC60–120/60-G0). An estimate of insulin clearance was calculated as fasting C-peptide divided by fasting insulin.
2.6. Statistical Analysis
2.6.1. Participant characteristics were summarized using means and standard deviations for quantitative variables and counts and column percentages for qualitative variables.
Comparisons across HbA1c sub-groups use the Χ2-test of independence for qualitative variables and the F-test for quantitative variables. As HOMA2-S is based in part on the fasting glucose concentration, correlations are not reported for this pair of variables.
2.6.2. Insulin, HOMA2-S, the Matsuda index, insulinogenic and C-peptide indices, the late insulin response and the ratios of incremental insulin and C-peptide AUC to incremental glucose AUC included extreme outliers.
To reduce the influence of outliers on analyses, these variables were Winsorized, i.e. values above or below specified cutoffs were replaced by the cutoffs. For each variable, the Winsorization upper (lower) cutoff was set to the median plus (minus) 8.9 times the distance from the median to the upper (lower) quartiles. For a normally distributed variable, this would result in cutoffs 6 standard deviations above and below the mean. The number of Winsorized values ranged from 5 (0.2%) for insulin at 30 minutes to 26 (0.8%) for the late insulin response.
2.6.3. Scatterplots are presented with lowess smoothing. Spearman correlations are reported as unadjusted, and then adjusted for sex, age, race, BMI, eGFR, metformin dose and diabetes duration.
The adjusted Spearman correlations are calculated as the Pearson correlations between the residuals of models with a rank transformed dependent variable. Correlation values are only shown if they are nominally significant at the 0.05 level and at least 0.1 in absolute value. Finally, two correlations were considered to differ (i.e. were relatively stronger or weaker) if their difference was statistically significant at the 0.05 level and the two correlations differed by 0.05 or more.
3. Results
3.1. Participant Characteristics
3.1.1. Table 1 provides descriptive details on the baseline characteristics for all participants and participants grouped by clinically-related HbA1c values.
Table 1.
Descriptive characteristics of the cohort by baseline HbA1c
| Groups by Baseline HbA1c % (mmol/mol) | ||||||
|---|---|---|---|---|---|---|
| 6.8–6.9 | 7.0–7.4 | 7.5–7.9 | 8.0–8.5 | |||
| (50.8–2.9) | (53.0–8.4) | (58.5–63.8) | (63.9–69.4) | All | p-value* | |
| N | 441 | 1,171 | 837 | 659 | 3,108 | |
| Female (%) | 153 (34.7%) | 446 (38.1%) | 282 (33.7%) | 243 (36.9%) | 1,124 (36.2%) | 0.199 |
| Age (y) | 57.0±9.9 | 57.2±10.0 | 56.4±9.9 | 55.4±10.1 | 56.6±10.0 | 0.002 |
| Race (%) | 0.444 | |||||
| Am Ind/Alaska Native | 11 (2.5%) | 35 (3.0%) | 27 (3.2%) | 30 (4.6%) | 103 (3.3%) | |
| Asian | 16 (3.6%) | 49 (4.2%) | 35 (4.2%) | 19 (2.9%) | 119 (3.8%) | |
| Hawaiian/Pacific Islander | 4 (0.9%) | 8 (0.7%) | 4 (0.5%) | 4 (0.6%) | 20 (0.6%) | |
| Black or African-American | 94 (21.3%) | 224 (19.1%) | 135 (16.1%) | 100 (15.2%) | 553 (17.8%) | |
| White | 280 (63.5%) | 775 (66.2%) | 574 (68.6%) | 455 (69.0%) | 2,084 (67.1%) | |
| Other/multiple | 30 (6.8%) | 66 (5.6%) | 51 (6.1%) | 42 (6.4%) | 189 (6.1%) | |
| Unknown/not reported | 6 (1.4%) | 14 (1.2%) | 11 (1.3%) | 9 (1.4%) | 40 (1.3%) | |
| Hispanic (%) | 86 (19.6%) | 202 (17.4%) | 177 (21.4%) | 146 (22.3%) | 611 (19.8%) | 0.040 |
| Weight (kg) | 97.9 ± 21.6 | 98.7 ± 21.9 | 100.7 ± 22.0 | 100.7 ± 23.1 | 99.6 ± 22.1 | 0.036 |
| BMI (kg/m2) | 33.8 ± 6.8 | 33.9 ± 6.4 | 34.4 ± 6.9 | 34.5 ± 6.8 | 34.2 ± 6.7 | 0.084 |
| Waist circumference (cm) | 110.5 ± 15.3 | 111.6 ± 15.8 | 112.8 ± 15.7 | 113.5 ± 15.8 | 112.2 ± 15.7 | 0.005 |
| Duration of diabetes (y) | 3.4 ± 2.6 | 4.0 ± 2.7 | 4.1 ± 2.8 | 4.4 ± 2.8 | 4.0 ± 2.8 | <0.001 |
| Metformin dose (mg/day) | <0.001 | |||||
| 1000 | 24 (5.4%) | 48 (4.1%) | 21 (2.5%) | 14 (2.1%) | 107 (3.4%) | |
| 1500 | 24 (5.4%) | 56 (4.8%) | 30 (3.6%) | 14 (2.1%) | 124 (4.0%) | |
| 2000 | 393 (89.1%) | 1,067 (91.1%) | 786 (93.9%) | 631 (95.8%) | 2,877 (92.6%) | |
| eGFR (ml/min) | 93.5 ± 16.7 | 94.3 ± 17.0 | 95.6 ± 16.5 | 98.4 ± 16.9 | 95.4 ± 16.9 | <0.001 |
| HbA1c (%) | 6.9 ± 0.0 | 7.2 ± 0.1 | 7.7 ± 0.1 | 8.2 ± 0.2 | 7.5 ± 0.5 | <0.001 |
| HbA1c (mmol/mol) | 51.4±0.5 | 55.2±1. | 60.5±1.5 | 66.4±1.9 | 58.4±5.3 | <0.001 |
| Fasting glucose (mmol/L) | 7.4 ± 1.2 | 8.0 ± 1.4 | 8.7 ± 1.6 | 9.5 ± 2.0 | 8.4 ± 1.7 | <0.001 |
| 2-hour glucose (mmol/L) | 14.5 ± 2.9 | 15.3 ± 2.9 | 16.4 ± 2.9 | 7.6 ± 2.9 | 16.0 ± 3.1 | <0.001 |
| Inc. glucose AUC mean (mmol/L) | 6.0 ± 1.5 | 6.1 ± 1.6 | 6.4 ± 1.5 | 6.5 ± 1.6 | 6.3 ± 1.6 | <0.001 |
| Fasting insulin (pmol/L) | 119.9 ± 78.8 | 126.3 ± 86.4 | 134.1 ± 95.9 | 133.1 ± 90.6 | 128.9 ± 89.0 | 0.002 |
| HOMA2-S (%) | 63.3 ± 47.5 | 56.5 ± 37.8 | 54.7 ± 39.2 | 54.3 ± 41.8 | 56.5 ± 40.6 | <0.001 |
| Matsuda index (1/(uU * mg/dL2)) | 2.4 ± 1.7 | 2.1 ± 1.3 | 2.1 ± 1.4 | 2.0 ± 1.4 | 2.1 ± 1.4 | <0.001 |
| Insulinogenic index (nmol/mol) | 47.2 ± 35.2 | 40.1 ± 31.9 | 33.0 ± 28.2 | 27.4 ± 21.3 | 36.5 ± 30.2 | <0.001 |
| Late insulin response (pmol/mol) | 53.7 ± 40.9 | 46.4 ± 38.1 | 34.5 ± 29.7 | 27.8 ± 24.0 | 40.3 ± 35.0 | <0.001 |
| Inc insulin AUC mean (pmol/L) | 48.2 ± 34.9 | 42.5 ± 29.2 | 34.1 ± 24.6 | 28.8 ± 22.6 | 38.1 ± 28.4 | <0.001 |
| incAUCins/incAUCglu (nmol/mol) | 51.0 ± 36.1 | 44.5 ± 34.1 | 34.2 ± 27.5 | 27.6 ± 21.7 | 39.1 ± 31.5 | <0.001 |
| Fasting C-peptide (nmol/L) | 1.3 ± 0.5 | 1.3 ± 0.5 | 1.4 ± 0.6 | 1.4 ± 0.6 | 1.3 ± 0.6 | 0.027 |
| CP Index (nmol/mol) | 0.96 ± 0.63 | 0.81 ± 0.79 | 0.68 ± 0.51 | 0.57 ± 0.43 | 0.75 ± 0.65 | <0.001 |
| Inc CP AUC mean (nmol/L) | 1.3 ± 0.6 | 1.2 ± 0.6 | 1.0 ± 0.5 | 0.9 ± 0.5 | 1.1 ± 0.6 | <0.001 |
| incAUC-CP/incAUCglu (umol/mol) | 0.2 ± 0.1 | 0.2 ± 0.1 | 0.2 ± 0.1 | 0.1 ±0.1 | 0.2 ± 0.1 | <0.001 |
| Fasting C-peptide/fasting insulin (umol/pmol) | 12.9 ± 4.9 | 12.5 ± 4.5 | 12.5 ± 4.6 | 12.2 ± 4.6 | 12.5 ± 4.6 | 0.135 |
Mean ± SD.
Comparisons across HbA1c sub-groups use the χ2-test of independence for qualitative variables and the F-test for quantitative variables.
eGFR = estimated glomerular filtration rate, incAUC = incremental area under the curve, CP = C-peptide.
The cohort was majority male, middle aged, and obese, and had T2DM for an average of 4.0±2.8 years. The cohort was racially diverse with the majority White. Most participants were taking the study-targeted maximum dose metformin of 2000 mg per day at the time of the OGTT.
3.2. Relationship between Insulin Sensitivity and Insulin and C-peptide Responses
3.2.1. Insulin and C-peptide responses to glucose were inversely associated with insulin sensitivity estimated using either HOMA2-S or Matsuda Index (Figure 1).
Figure 1:
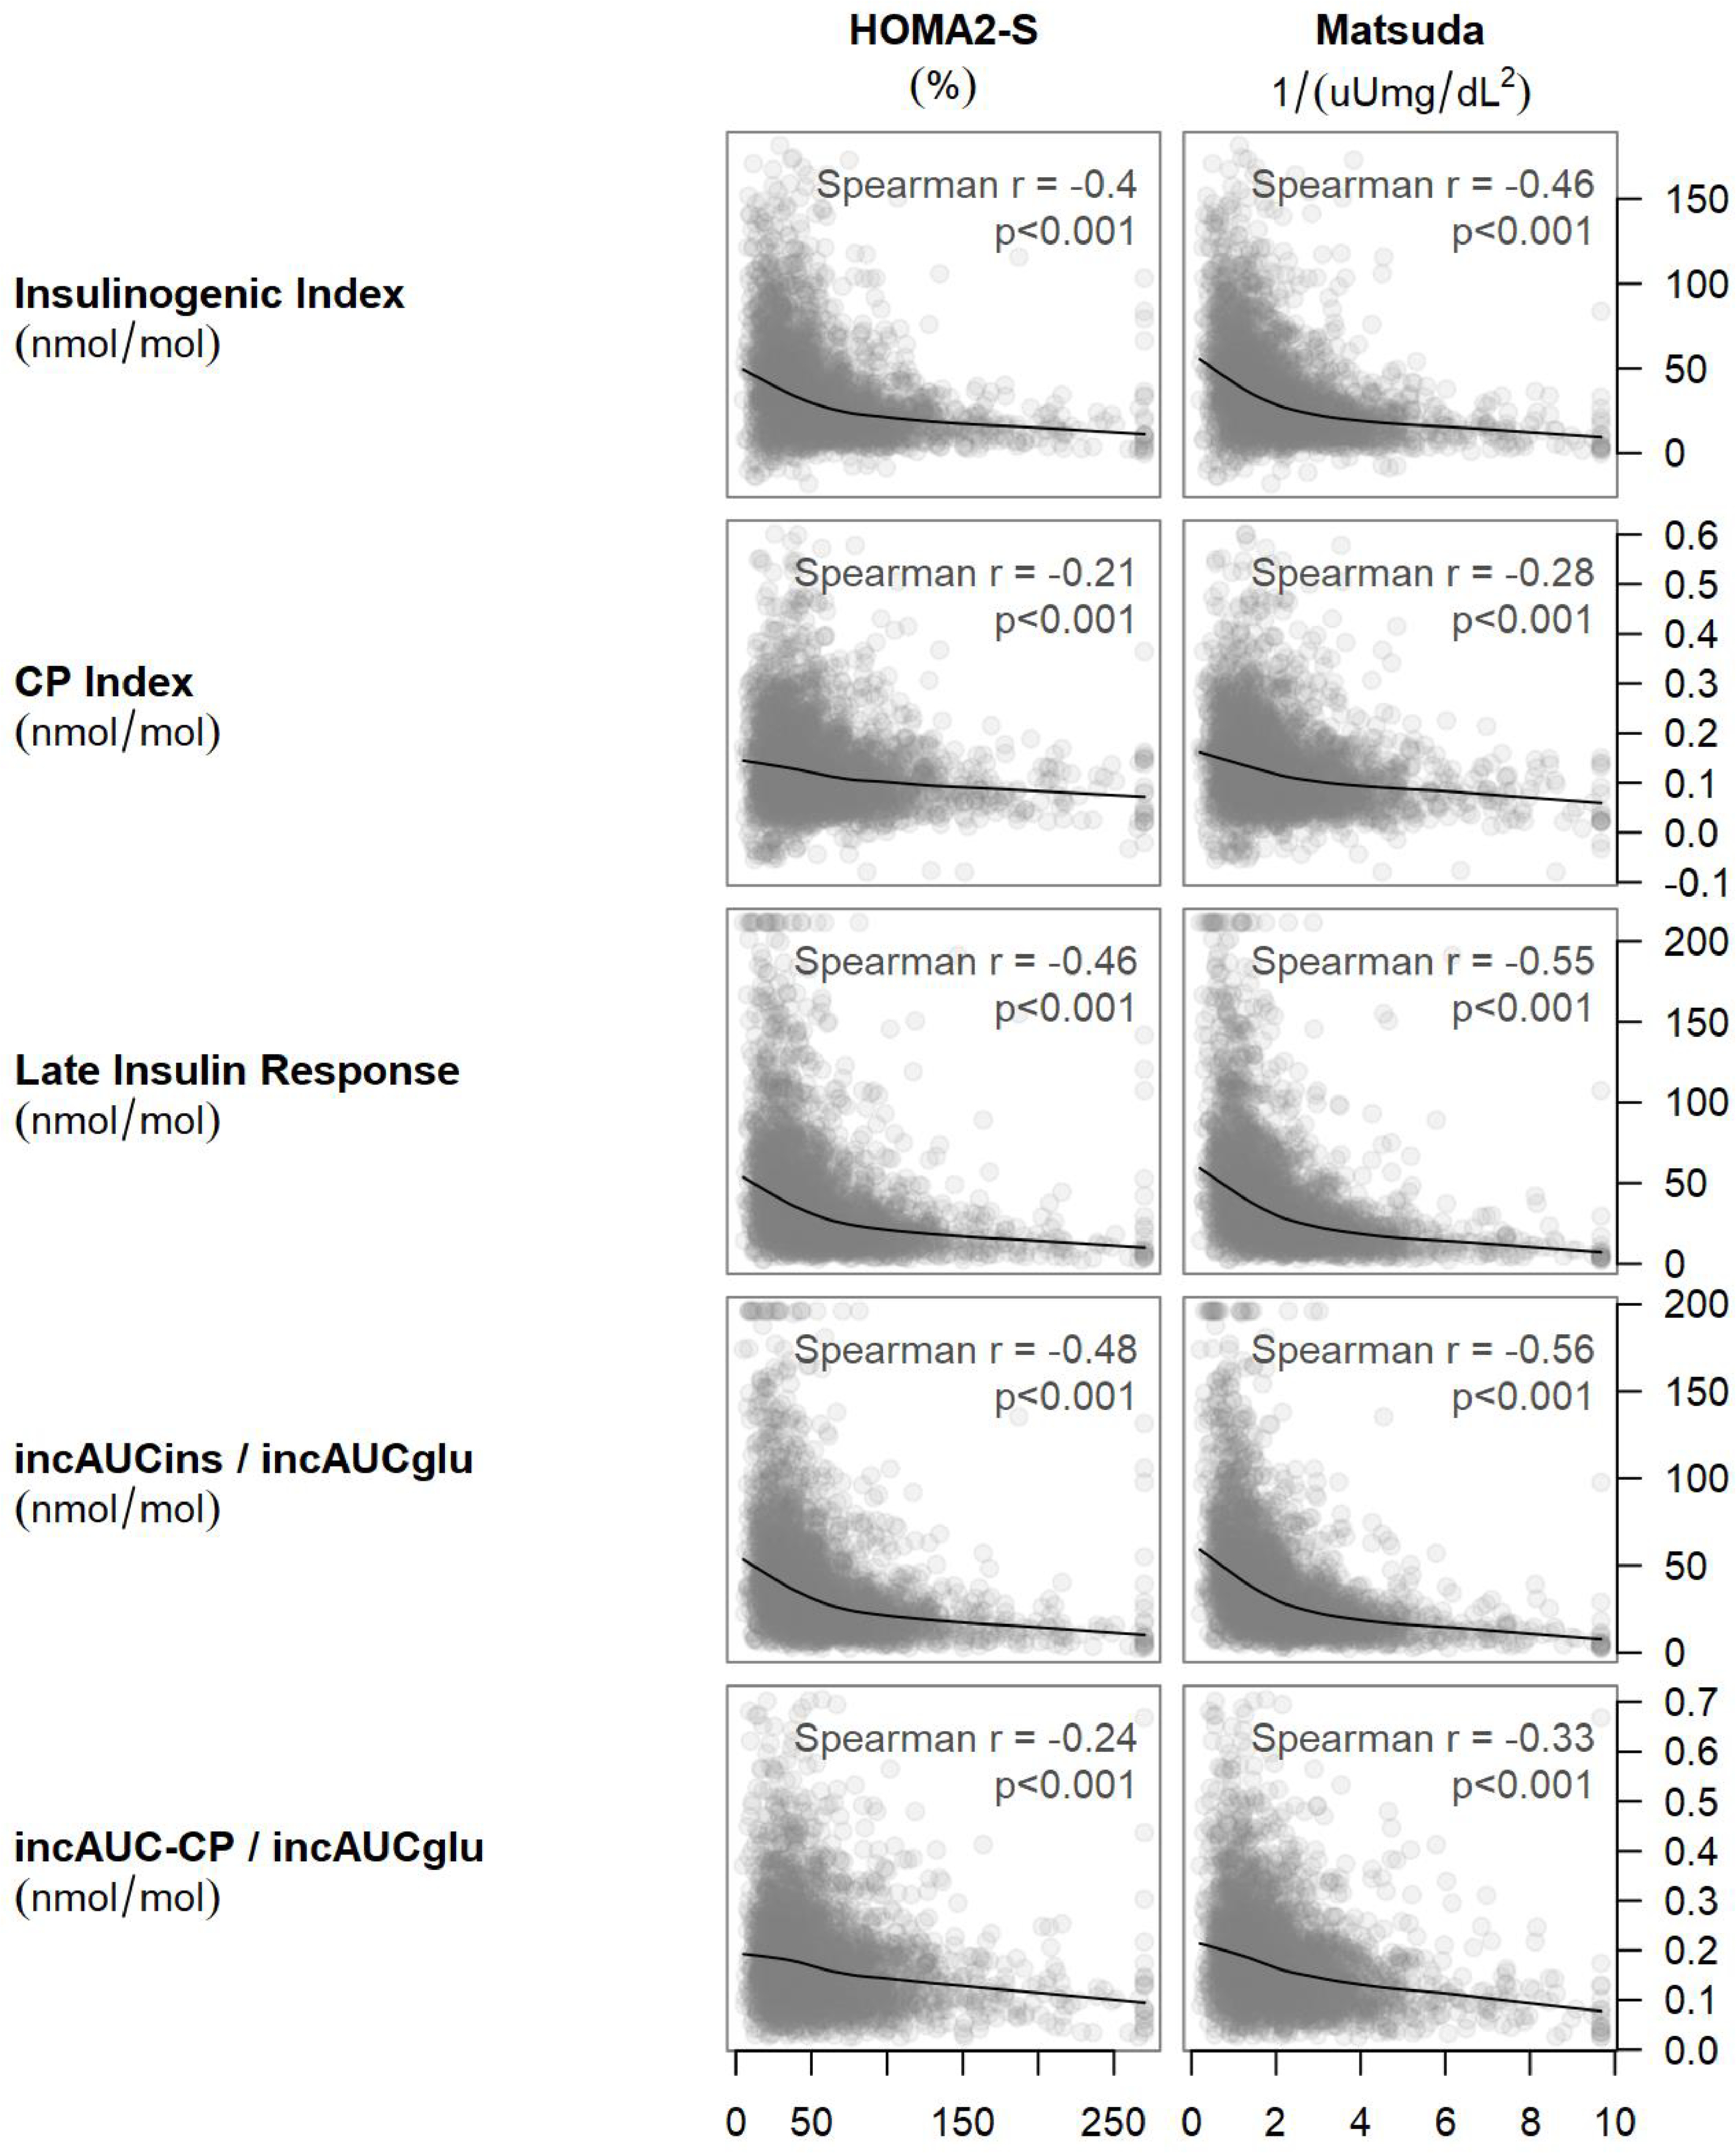
Scatterplots of HOMA2-S and Matsuda index against the insulinogenic index, the late insulin response, the C-peptide index, and the ratios of incremental areas under the insulin and C-peptide curves to the incremental area under the glucose curve. The smooth curves are from lowess smoothers. For each plot, the Spearman correlation and its asymptotic p-value are reported.
This inverse relationship was much flatter for C-peptide than for insulin. Based on this relationship, insulin and C-peptide responses were adjusted for insulin sensitivity in statistical models to assess β-cell function.
3.3. Relationship between Glycemic Measures, Insulin Sensitivity and β-cell Responses
3.3.1. Figure 2 shows the unadjusted associations of measures of glycemia with measures of insulin sensitivity and insulin and C-peptide responses.
Figure 2.
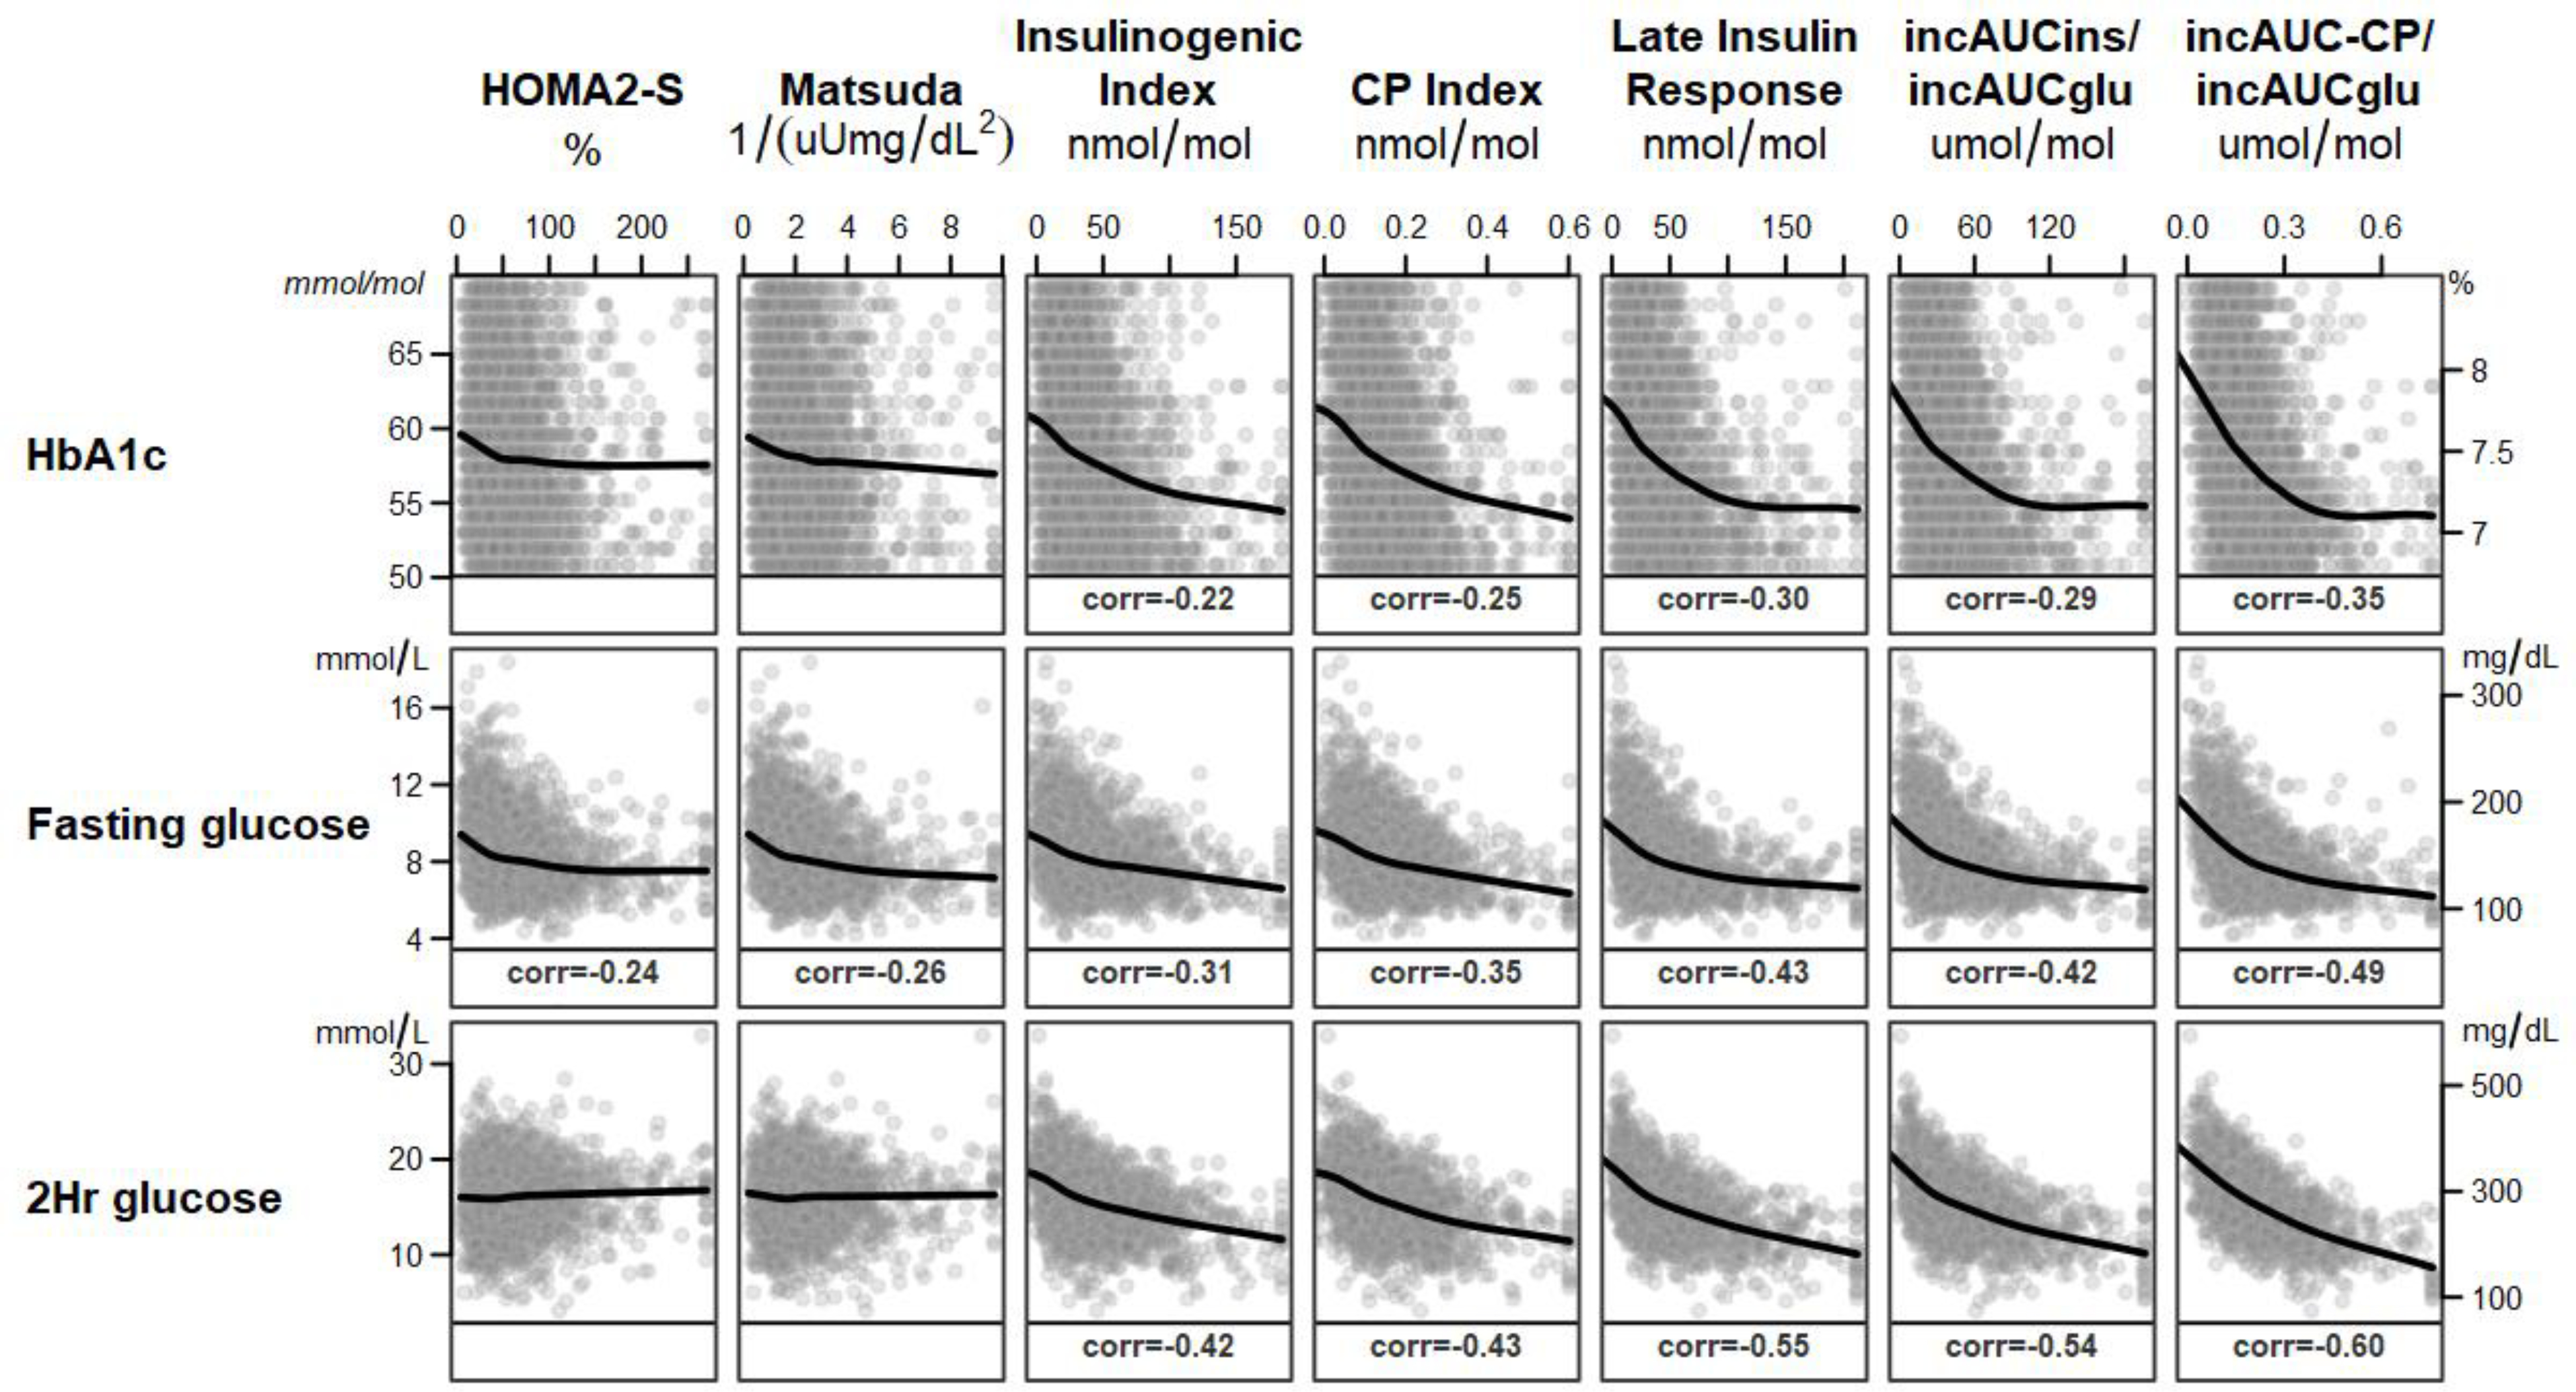
Unadjusted associations between glycemic variables (rows across) and insulin sensitivity and insulin (ins) and C-peptide (CP) responses (columns down) are depicted. HbA1c and fasting and 2-hour plasma glucose concentrations were inversely associated with insulin sensitivity and insulin and C-peptide responses. The associations were steeper for insulin and C-peptide responses than for insulin sensitivity. Only Spearman correlations significant at the p<0.05 level and absolute r values at least 0.1 are shown. Glu=glucose
Figure 3 shows the correlation coefficients after adjusting for age, sex, race, BMI, eGFR, metformin dose, diabetes duration and HOMA2-S.
Figure 3.
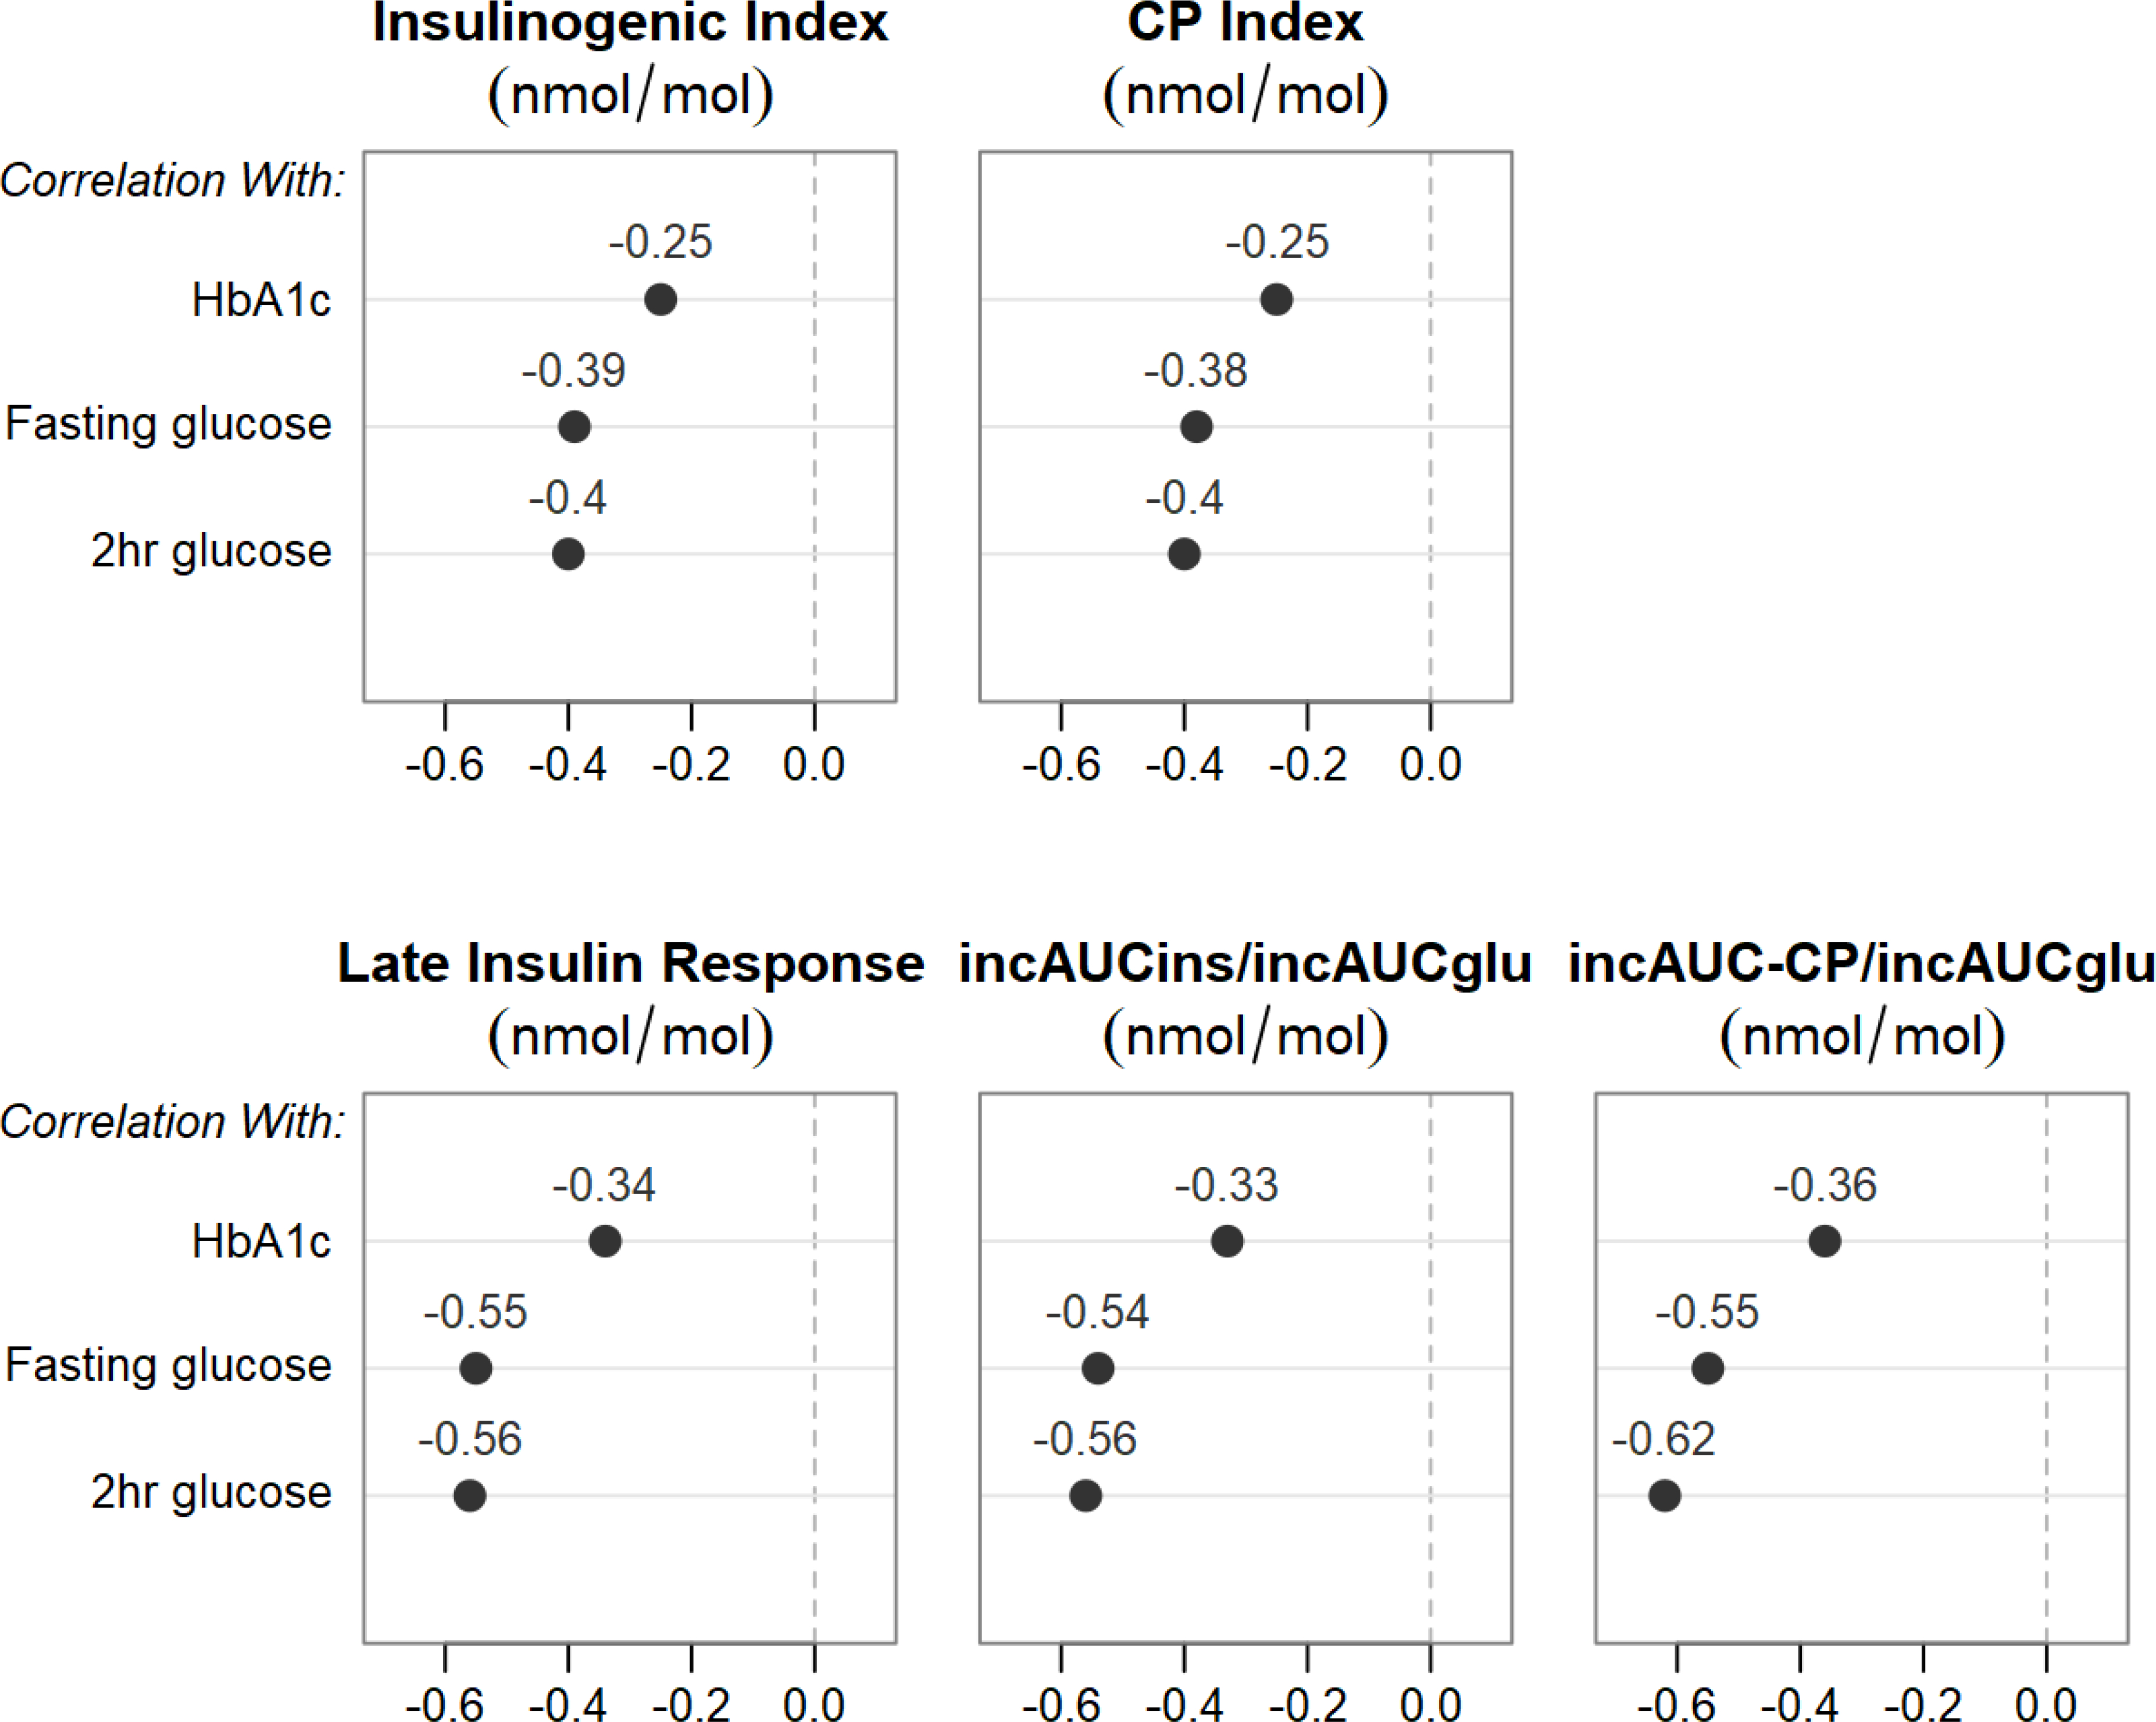
Relationships between multiple measures of glycemia and insulin (ins) and C-peptide (CP) responses. All partial correlation models were adjusted for sex, age, race, BMI, eGFR, metformin dose, diabetes duration and HOMA2-S. The solid circles represent correlations that met both absolute r values >0.1 and p<0.05 criteria.
3.3.2. There were significant but weak inverse relationships for HbA1c with HOMA2-S (r=−0.082, p<0.001) and the Matsuda index (r=−0.073, p<0.001).
Stronger associations were observed for the relationships for fasting glucose with HOMA2-S (r=−0.24, p<0.001) and Matsuda Index (r=−0.256, p<0.001). Of note, both HOMA2-S and Matsuda Index include fasting glucose as part of their calculation. Two-hour glucose was not associated with HOMA2-S (r=0.044, p=0.14) or the Matsuda Index (r=−0.01, p=0.57) in the unadjusted models, but the association with Matsuda Index reached significance in the fully adjusted model (r=−0.13, p<0.001). The fasting C-peptide/insulin ratio, an estimate of insulin clearance, was only weakly associated with HbA1c (r=−0.045, p=0.013), fasting glucose (r=0.107, p<0.001) and 2-hour glucose (r=0.08, p<0.001).
3.3.3. All insulin and C-peptide response measures were inversely associated with HbA1c and with fasting and 2-hour glucose concentrations (Figure 2).
No threshold or inflection point was apparent, but values appear to plateau when HbA1c reaches 7.2%, which is at the lower end of the eligibility criteria (6.8–8.5%). Adjustment for insulin sensitivity with HOMA2-S strengthened the relationship with HbA1c, but the changes were small and adjustment with Matsuda Index instead of HOMA2-S produced similar results (data not shown).
3.3.4. Figure 3 depicts the correlation coefficients (r values) between glycemic measures and insulin and C-peptide responses after full adjustment including insulin sensitivity.
Associations were evident for early, late and incremental insulin and C-peptide responses, with slightly higher r values noted for the late insulin response and incAUC insulin and C-peptide responses than the early responses. Correlations between HbA1c and insulin and C-peptide responses had lower r values compared to correlations between fasting and 2-hour glucose with insulin and C-peptide responses. Finally, r values for C-peptide and insulin responses were very similar for the early response, but higher for incAUC-CP/incAUCglu than for incAUCins/incAUCglu.
4. Discussion
4.1. Insulin resistance and β-cell dysfunction are well recognized as key features underlying the development of T2DM.
Once T2DM is established and glucose-lowering medication is started, the roles that insulin sensitivity and β-cell function play in glycemic control are less clear. There are four salient points in this examination of the relationship between glycemia and β-cell peptide responses in adults with early T2DM. First, we demonstrate that the inverse nonlinear relationships between insulin sensitivity and insulin and C-peptide responses to glucose are still present, suggesting that the modulating effect of insulin sensitivity on β-cell secretory responses is still operative in early T2DM. Second, we found significant inverse correlations between glycemic measures and insulin and C-peptide responses suggesting that residual β-cell function remains a major determinant of glycemic control. Those with the highest insulin and C-peptide responses had the lowest HbA1c and glucose concentrations and vice versa. Third, glycemic measures were inversely correlated with all β-cell responses but were more strongly associated with the late insulin response as well as the incAUC insulin and C-peptide responses than the early insulin and C-peptide responses. Finally, HbA1c demonstrated steep inverse relationships with insulin and C-peptide responses at HbA1c values >7.2%, but also had high variability and lower correlations than fasting and 2-hour glucose concentrations.
4.2. Insulin sensitivity in populations without diabetes is an independent predictor of progression to T2DM 9,16
Here, we observed a broad range of insulin sensitivity within the GRADE cohort, and, in keeping with the existing literature, an inverse relationship between insulin sensitivity and insulin and C-peptide responses. Glycemia was not strongly associated with insulin sensitivity as the relationships between measures of glycemia and insulin sensitivity were fairly flat. This contrasts with associations between measures of glycemia and estimates of β-cell function which were steep and had stronger correlations. This suggests that β-cell function in early T2DM is a more important predictor of glycemic control than insulin sensitivity.
4.3. Loss of the early insulin response is critical in the pathogenesis of diabetes and is predictive of development of T2DM 17.
In studies in the Pima Indians, the first phase insulin response to intravenous glucose decreased progressively from normal glucose tolerance to diabetes 2 and predicted progression 16. In fact, when considered in the context of the prevailing insulin sensitivity, reduced β-cell function was already present in those who progressed at a time when they still had normal glucose tolerance. Similarly, the oral disposition index (insulinogenic index adjusted for prevailing insulin sensitivity) decreased from normal glucose tolerance to impaired glucose tolerance to T2DM 6,7 and predicted progression to T2DM at 10 years above and beyond baseline fasting and 2-hour glucose levels 6. Interestingly, in those with normal glucose tolerance, the oral disposition index decreased as the fasting glucose increased across the normal glucose range 18. The current data demonstrate that there are further gradations of early insulin and C-peptide responses in relation to glycemia well above the diabetes diagnostic cut-point and that the early response remains important for glycemic management in early T2DM.
Studies in participants without diabetes have also shown that the late phase insulin response from 60–120 minutes independently predicts development of diabetes and improves a standard prediction model containing the early insulin response 19. In the GRADE cohort glycemic measures were inversely associated with late insulin and incAUC insulin and incAUC C-peptide responses, with r values slightly higher than for those relationships with the early responses. This observation suggests that in those with early T2DM, where the early insulin response is already deficient, preservation of late insulin secretion also plays an important role in lowering glucose levels. The inverse relationship with late insulin and total insulin and C-peptide responses also appears to be most evident in those with higher HbA1c. This implies that in those with poorer glycemic control, small improvements in β-cell secretory function could have dramatic effects on improving glycemic control; conversely, worsening of β-cell secretory function would be predicted to have a larger negative impact on glycemic control.
4.4. HbA1c is the most common measure of glycemia used in clinical practice.
While HbA1c was significantly associated with insulin and C-peptide responses with fairly steep relationships, there was broad variability and the correlation r values were lower than those for fasting and 2-hour glucose concentrations. This is likely in part tautological since fasting and 2-hour glucose values are incorporated into the equations for the measures of insulin sensitivity and release and are performed on the same day, while HbA1c reflects average glucose levels over a longer period of time and can be affected by multiple other factors including red cell turnover 20. Given these findings, HbA1c is probably not as reliable as a surrogate measure of β-cell function as fasting and 2-hour glucose concentrations.
4.5. The strengths of this study include the large number of participants with early T2DM uniformly treated with metformin alone.
Thus, the results are not confounded by glucose-lowering medications with differing mechanisms of action. Further, the cohort includes both men and women and a range of ethnic and racial groups. Additionally, insulin and C-peptide were measured at frequent time points during standardized OGTTs, allowing assessments of β-cell function, which is not typical of most large clinical trials. Despite differences in kinetics of insulin and C-peptide clearance, we found that the β-cell responses derived from these two measures were similarly correlated with measures of glycemia, suggesting that either measure could be used to better understand the mechanisms underlying treatment effects and disease pathophysiology in adults with T2DM treated with metformin.
4.6. In conclusion, analyses of the baseline data from the GRADE cohort contribute to the literature demonstrating that β-cell function is of importance in determining glycemia in early T2DM, and importantly demonstrate the extension of known relationships between glycemia and β-cell function into the diabetes range of glycemia, defined in GRADE by a HbA1c 6.8–8.5%.
While early insulin responses are diminished early in the pathogenesis of T2DM, both early and late insulin responses were found to be important in overall glycemic control. These observations argue that where possible measures to estimate β-cell function should be included in clinical trials in order to understand the physiologic basis for treatment effects, and that interventions most likely to be of benefit on glycemia should specifically target mechanisms to improve or preserve β-cell function.
Supplementary Material
Highlights.
HbA1c and glucose levels reflect underlying β-cell dysfunction in type 2 diabetes.
Glycemia correlates more strongly with β-cell dysfunction than insulin resistance.
Glycemia correlates better with late and total vs. early insulin/glucose responses.
Acknowledgements
ICMJE Statement: All authors affirm that authorship is merited based on the ICMJE authorship criteria.
Support: The GRADE Study is supported by a grant from the National Institute of Diabetes and Digestive and Kidney Diseases (NIDDK) of the National Institutes of Health under Award Number U01-DK-098246. The planning of GRADE was supported by a U34 planning grant from the NIDDK (U34-DK-088043). The American Diabetes Association supported the initial planning meeting for the U34 proposal. The National Heart, Lung, and Blood Institute and the Centers for Disease Control and Prevention also provided funding support. The Department of Veterans Affairs provided resources and facilities. Additional support was provided by grant numbers P30 DK017047, P30 DK020541, P30 DK020572, P30 DK072476, P30 DK079626, P30 DK092926, U54 GM104940, UL1 TR000439, UL1 TR000445, UL1 TR001108, UL1 TR001409, UL1 TR001449, UL1 TR002243, UL1 TR002345, UL1 TR002378, UL1 TR002489, UL1 TR002529, UL1 TR002535, UL1 TR002537, and UL1 TR002548. Educational materials have been provided by the National Diabetes Education Program. Material support in the form of donated medications and supplies has been provided by Becton, Dickinson and Company, Bristol-Myers Squibb, Merck, Novo Nordisk, Roche Diagnostics, and Sanofi. The content of this manuscript is solely the responsibility of the authors and does not necessarily represent the official views of the National Institutes of Health.
Disclosure Summary:
The writing group reports the following as relevant conflicts of interest: KMU reports support from Medtronics, personal fees from Novo Nordisk, outside the submitted work; NR reports grants and other support from Novo Nordisk, outside the submitted work; RMC reports grants from National Institutes of Health during the conduct of the study; other support from Bristol Myers Squibb and Pfizer, outside the submitted work; DJW reports grants from an NIDDK funded trial during the conduct of the study; and other support from Novo Nordisk, outside the submitted work. SEK reports grants from NIH during the conduct of the study; personal fees from Boehringer Ingelheim, Eli Lilly, Intarcia, Janssen, Merck, Novo Nordisk, and Pfizer, outside the submitted work. KJM reports grants from National Institutes of Health during the conduct of the study; and at the time of publication. KJM is an employee of Eli Lilly and Company. Data collection, analysis, and preparation of the manuscript occurred prior to this employment and were independent of Eli Lilly and Company. NY, JB, MAB, EVG, FIB, JML, and PR have nothing to disclose. KMU and SEK are supported by funding from the United States Department of Veterans Affairs.
Footnotes
Publisher's Disclaimer: This is a PDF file of an unedited manuscript that has been accepted for publication. As a service to our customers we are providing this early version of the manuscript. The manuscript will undergo copyediting, typesetting, and review of the resulting proof before it is published in its final form. Please note that during the production process errors may be discovered which could affect the content, and all legal disclaimers that apply to the journal pertain.
This Trial is registered in Clinicaltrials.gov as NCT01794143.
Data Availability Statement:
The Glycemia Reduction Approaches in Diabetes: A Comparative Effectiveness Study (GRADE) is being conducted with funding from the National Institute of Diabetes and Digestive and Kidney Diseases (NIDDK). This manuscript is based on the baseline (pre-treatment) data from the 5047 participants enrolled into the study. This baseline data will be archived with the NIDDK data repository and will be available for sharing with other investigators by Q3 of 2020.
References
- 1.Kahn SE. The importance of the beta-cell in the pathogenesis of type 2 diabetes mellitus. Am J Med. 2000;108 Suppl 6a:2S–8S. [DOI] [PubMed] [Google Scholar]
- 2.Weyer C, Bogardus C, Mott DM, Pratley RE. The natural history of insulin secretory dysfunction and insulin resistance in the pathogenesis of type 2 diabetes mellitus. J Clin Invest. 1999;104(6):787–794. [DOI] [PMC free article] [PubMed] [Google Scholar]
- 3.Festa A, Williams K, D'Agostino R Jr., Wagenknecht LE, Haffner SM. The natural course of β-cell function in nondiabetic and diabetic individuals: the Insulin Resistance Atherosclerosis Study. Diabetes. 2006;55(4):1114–1120. [DOI] [PubMed] [Google Scholar]
- 4.U.K. prospective diabetes study 16. Overview of 6 years' therapy of type II diabetes: a progressive disease. U.K. Prospective Diabetes Study Group. Diabetes. 1995;44(11):1249–1258. [PubMed] [Google Scholar]
- 5.Manco M, Panunzi S, Macfarlane DP, et al. One-hour plasma glucose identifies insulin resistance and beta-cell dysfunction in individuals with normal glucose tolerance: cross-sectional data from the Relationship between Insulin Sensitivity and Cardiovascular Risk (RISC) study. Diabetes Care. 2010;33(9):2090–2097. [DOI] [PMC free article] [PubMed] [Google Scholar]
- 6.Utzschneider KM, Prigeon RL, Faulenbach MV, et al. Oral disposition index predicts the development of future diabetes above and beyond fasting and 2-h glucose levels. Diabetes Care. 2009;32(2):335–341. [DOI] [PMC free article] [PubMed] [Google Scholar]
- 7.Jensen CC, Cnop M, Hull RL, Fujimoto WY, Kahn SE. β-cell function is a major contributor to oral glucose tolerance in high-risk relatives of four ethnic groups in the U.S. Diabetes. 2002;51(7):2170–2178. [DOI] [PubMed] [Google Scholar]
- 8.Gastaldelli A, Ferrannini E, Miyazaki Y, Matsuda M, DeFronzo RA. Beta-cell dysfunction and glucose intolerance: results from the San Antonio metabolism (SAM) study. Diabetologia. 2004;47(1):31–39. [DOI] [PubMed] [Google Scholar]
- 9.Kitabchi AE, Temprosa M, Knowler WC, et al. Role of insulin secretion and sensitivity in the evolution of type 2 diabetes in the diabetes prevention program: effects of lifestyle intervention and metformin. Diabetes. 2005;54(8):2404–2414. [DOI] [PMC free article] [PubMed] [Google Scholar]
- 10.Polonsky K, Jaspan J, Pugh W, et al. Metabolism of C-peptide in the dog. In vivo demonstration of the absence of hepatic extraction. J Clin Invest. 1983;72(3):1114–1123. [DOI] [PMC free article] [PubMed] [Google Scholar]
- 11.Utzschneider KM, Prigeon RL, Tong J, et al. Within-subject variability of measures of β-cell function derived from a 2 h OGTT: implications for research studies. Diabetologia. 2007;50(12):2516–2525. [DOI] [PubMed] [Google Scholar]
- 12.Nathan DM, Buse JB, Kahn SE, et al. Rationale and design of the glycemia reduction approaches in diabetes: a comparative effectiveness study (GRADE). Diabetes Care. 2013;36(8):2254–2261. [DOI] [PMC free article] [PubMed] [Google Scholar]
- 13.Matthews DR, Hosker JP, Rudenski AS, Naylor BA, Treacher DF, Turner RC. Homeostasis model assessment: insulin resistance and β-cell function from fasting plasma glucose and insulin concentrations in man. Diabetologia. 1985;28(7):412–419. [DOI] [PubMed] [Google Scholar]
- 14.Wallace TM, Levy JC, Matthews DR. Use and abuse of HOMA modeling. Diabetes Care. 2004;27(6):1487–1495. [DOI] [PubMed] [Google Scholar]
- 15.Matsuda M, DeFronzo RA. Insulin sensitivity indices obtained from oral glucose tolerance testing: comparison with the euglycemic insulin clamp. Diabetes Care. 1999;22(9):1462–1470. [DOI] [PubMed] [Google Scholar]
- 16.Weyer C, Tataranni PA, Bogardus C, Pratley RE. Insulin resistance and insulin secretory dysfunction are independent predictors of worsening of glucose tolerance during each stage of type 2 diabetes development. Diabetes Care. 2001;24(1):89–94. [DOI] [PubMed] [Google Scholar]
- 17.DelPrato S. Loss of early insulin secretion leads to postprandial hyperglycaemia. Diabetologia. 2003;46 Suppl 1:M2–8. [DOI] [PubMed] [Google Scholar]
- 18.Esser N, Utzschneider KM, Kahn SE. Early beta cell dysfunction vs insulin hypersecretion as the primary event in the pathogenesis of dysglycaemia. Diabetologia. 2020;63(10):2007–2021. [DOI] [PubMed] [Google Scholar]
- 19.Lorenzo C, Williams K, Haffner SM. Insulin secretion based on the late oral glucose tolerance test period and incident diabetes: the San Antonio Heart Study. Diabet Med. 2012;29(8):e151–158. [DOI] [PMC free article] [PubMed] [Google Scholar]
- 20.Radin MS. Pitfalls in hemoglobin A1c measurement: when results may be misleading. J Gen Intern Med. 2014;29(2):388–394. [DOI] [PMC free article] [PubMed] [Google Scholar]
Associated Data
This section collects any data citations, data availability statements, or supplementary materials included in this article.
Supplementary Materials
Data Availability Statement
The Glycemia Reduction Approaches in Diabetes: A Comparative Effectiveness Study (GRADE) is being conducted with funding from the National Institute of Diabetes and Digestive and Kidney Diseases (NIDDK). This manuscript is based on the baseline (pre-treatment) data from the 5047 participants enrolled into the study. This baseline data will be archived with the NIDDK data repository and will be available for sharing with other investigators by Q3 of 2020.