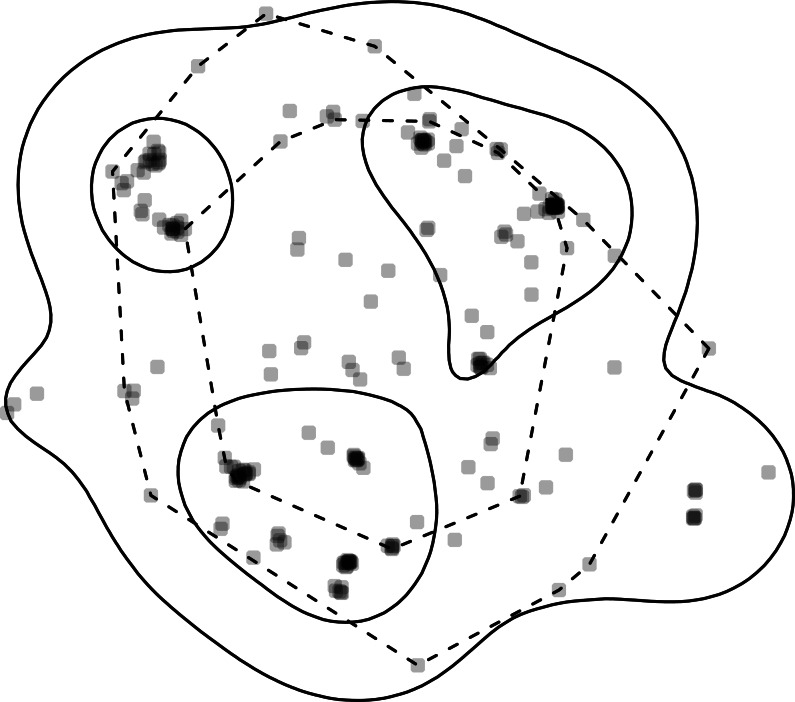
Figure 2. Home-range estimates from one fisher.
Points where a fisher was tracked (gray points) overlaid with kernel density (solid lines) and minimum convex polygon (dashed lines) home ranges at two levels (50% and 95%). Note, that whereas home ranges delineated using the 95% level are relatively similar, the home ranges at the 50% level are very different.

