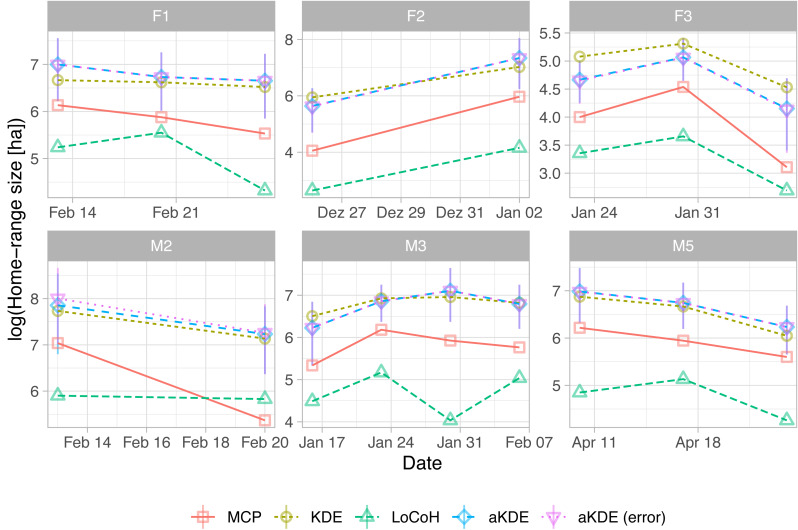
Figure 5. Natural log of home-range size for different fisher estimated using five different estimators (line type and symbols).
For autocorrelated kernel density estimates (aKDE) with and without error model, 95% confidence intervals are shown (vertical black lines). Each panel is for one fisher (the first letter of the ID gives its sex). Individuals were followed for different time periods.

