

Abstract
Charge accumulation in photoactive molecules and materials holds great promise in solar energy conversion as it allows for decoupling solar‐driven charging from (dark) redox reactions. In this contribution, light‐driven charge accumulation was investigated for a recently reported novel water‐soluble carbon nitride [K,Na‐poly(heptazine imide); K,Na‐PHI] photocatalyst, which exhibits excellent activity and stability in highly selective photocatalytic oxidation of alcohols and concurrent reduction of dioxygen to H2O2 under quasi‐homogeneous conditions. An excellent charge storage ability of the K,Na‐PHI material was demonstrated, showing an optimal density of accumulated electrons (32.2 μmol of electrons per gram) in the presence of 10 vol % MeOH as a sacrificial electron donor. The long‐lived electrons accumulated under anaerobic conditions as K,Na‐PHI.− radical ions were utilized in interfacial electron transfer to O2 or methyl viologen in a subsequent dark reaction. Ultrafast time‐resolved spectroscopy was employed to reveal the kinetics of charge‐carrier recombination and methanol oxidation. Geminate recombination of electrons and holes within approximately 100 ps was followed by trap‐assisted recombination. The presence of methanol as a sacrificial electron donor accelerated the decay of the transient absorption signal when a static sample was used. This behavior was ascribed to the faster charge recombination in the presence of the radical anions generated after hole extraction. The work suggests that photodriven electron storage in the water‐soluble carbon nitride is enabled by localized trap states, and highlights the importance of the effective electron donor for creating long‐lived photo‐generated carbon nitride radicals.
Keywords: carbon nitride, charge trapping, energy conversion, photochemistry, ultrafast transient absorption spectroscopy
Taking a (very) quick look: A water‐soluble carbon nitride reveals excellent storage capacity for photogenerated charges. The photoinduced dynamics in this high‐performance water‐soluble carbon nitride photocatalyst are investigated by ultrafast time‐resolved spectroscopy.

Introduction
Solar energy conversion constitutes an integral part of any strategy towards a sustainable human society. Semiconductor‐based photocatalysis, due to its potential for large‐scale applications, has attracted significant attention. [1] Among a multitude of metal‐free photocatalysts, polymeric carbon nitride (CNx), a heptazine‐based polymeric semiconductor also referred to as graphitic carbon nitride, has drawn increasing attention. Since it was first reported in 2009 by Wang et al., [2] its potential for photocatalytic applications in photocatalytic hydrogen production, oxygen reduction and selective oxidation reactions, has been studied. [3] The popularity of CNx originates not only in a wide range of applications but also in a facile synthesis, easy functionalization and high physicochemical stability. Conventional CNx is fabricated by thermal polymerization from low‐cost, nitrogen‐rich precursors, such as melamine, cyanamide, dicyandiamide, urea or thiourea. [4] Based on the heptazine network, the photoactivity of CNx can be improved via structural engineering, [5] shape control, [6] doping with heteroatoms [7] and coupling of inorganic cocatalysts or enzymes to the material. [8] Despite many efforts dedicated to improving the photocatalytic performance of CNx, the current understanding of their photophysical properties still lacks details, particularly with respect to the interplay between charge trapping and charge recombination dynamics [9] as well as the impact of sacrificial electron donors on the charge dynamics. [10]
Herein, we report a spectroscopic investigation of a novel type of carbon nitride prepared by alkali hydroxide‐assisted (KOH,NaOH) co‐thermal condensation with melamine, yielding approximately 10 nm small nanoparticles of heptazine‐based K,Na‐poly(heptazine imide) (K,Na‐PHI) with surface functionalized with C≡N and C−O− moieties that render the nanoparticles fully soluble in water, resulting in homogeneous and transparent solutions. [11] The water‐soluble carbon nitride exhibits excellent performance in highly selective photocatalytic oxidation of various alcohols and simultaneous reduction of dioxygen to H2O2 under quasi‐homogeneous conditions, allowing for easy operation, product separation, and recyclability. [11] Importantly, such water‐soluble carbon nitrides hold great promise for mechanistic studies due to the ease of their spectroscopic accessibility compared to conventional (non‐soluble) carbon nitrides, in which large particle sizes might cause strong scattering. [9a]
Notably, during initial photocatalytic alcohol oxidation studies color changes of the water‐soluble carbon nitride has been observed. [11] This is likely associated with charge accumulation in the carbon nitride and the generation of long‐lived radical species in the presence of sacrificial electron donors. [12] Such long‐lived radical species are key to charge storage materials in which an initial photoreaction can be separated from a slower dark reaction. [13] Herein, we combine steady‐state and time‐lapse UV/Vis absorption spectra to study the K,Na‐PHI optical properties and charge carrier dynamics upon irradiation. Furthermore, intermolecular charge transfer between the photoexcited K,Na‐PHI material and molecular electron acceptors and/or donors is studied by femtosecond (fs‐ns) and nanosecond (μs‐ms) transient absorption spectroscopy. Thereby, we gain detailed insights into charge storage properties and the charge transport phenomena in the novel water‐soluble carbon nitride material, and discuss the significance of our results for further development of soft matter‐based photocatalytic systems.
Results and Discussion
The K,Na‐PHI photocatalyst was synthesized by thermal condensation of melamine in a KOH/NaOH melt as reported previously. [11] Solutions for optical spectroscopy were prepared by dispersing K,Na‐PHI in water with the addition of methanol as an electron donor. The resultant solutions were degassed by freeze‐pump‐thawand kept under nitrogen atmosphere during the measurements unless noted otherwise.
Steady‐state spectroscopy
Time‐lapse steady‐state UV/Vis absorption spectroscopy is performed to characterize the water‐soluble K,Na‐PHI. We monitor the absorption of the photocatalyst under LED‐illumination at 365 nm in the presence of MeOH (10 vol %). Upon 2 h of irradiation in deaerated solutions, the absorption spectrum exhibits a broad tail from 370–700 nm (Figure 1a, red solid line), which is absent for the native sample (Figure 1a, black solid line). These spectral changes are highlighted in the absorption difference spectrum (Figure 1a, inset), which consists of a broad tail band between 500 and 800 nm and an absorption at around 400 nm. Correspondingly, upon irradiation the sample changes color from lemon yellow to Peru brown (Figure 1b), which we attribute to the formation of the K,Na‐PHI radical anion (K,Na‐PHI.−) by reductive quenching of the excited state (K,Na‐PHI*) in the presence of MeOH as a hole quencher. In the absence of a hole scavenger only minor, that is, an order of magnitude less pronounced, spectral changes are observed upon same illumination conditions (Figure S1a inset, Figure S2b). This indicates that sacrificial electron donors indeed facilitate K,Na‐PHI.− radical generation by reducing electron–hole recombination. Using 4‐methoxybenzyl alcohol (4‐MBA) or ascorbic acid (AsAc) as electron donors revealed similar absorption changes as observed with MeOH (Figure S2c).
Figure 1.
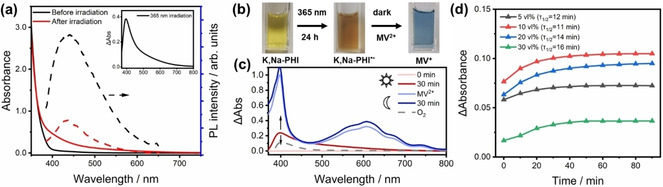
Optical properties of the K,Na‐PHI photocatalyst in a H2O/MeOH mixture (1 g L−1, 9 : 1 vol %). (a) UV/Vis absorption (solid lines) and steady‐state emission spectra (dashed lines) before and after 2 h of 365 nm irradiation. Inset: the corresponding absorption difference spectrum. (b) The color changes after 24 h upon 365 nm illumination and afterwards turns into blue with the addition of MV2+. (c) Differential absorption changes of the pre‐illuminated sample upon addition of excess of MV2+ (1000 μmol) or applying oxygen in dark. (d) Time‐lapse absorption experiments. Differential absorbance at 606 nm of the pre‐illuminated K,Na‐PHI in H2O/MeOH mixtures (365 nm, 2 h, ≈0.47 mW mm−2) upon addition of 0.1 mL 0.5 m aqueous MV2+ monitored in dark. Sample details: 0.5 mL 1 g L−1 K,Na‐PHI in H2O, 0.1–0.6 mL MeOH (5–30 vol %), and additional H2O to keep the total volume of the solution at 2 mL. The absorbance of the sample was probed every 10 min.
The Peru‐colored solution persists for at least four weeks in an air‐tight cuvette under otherwise ambient conditions. However, when the sealed cuvette is opened allowing oxygen to interact with the reduced carbon nitride, the absorbance of photocharged K,Na‐PHI gradually decays, resulting in the disappearance of the photoinduced absorption band from 500–800 nm (see Figure 1c, Figure S3). Moreover, the oxygenated sample is unable to reduced methyl viologen (MV2+), whereas the photogenerated K,Na‐PHI.− radical anions are capable of reducing MV2+ in‐situ to MV+.. Upon adding an excess of MV2+ to the pre‐illuminated solution in the absence of oxygen, its color immediately changes from Peru brown to blue (Figure 2b). The intense blue color stems from the characteristic absorption of MV+. in H2O (Figure 2c, blue lines). [14] This directly reveals the reactivity of the electrons trapped in the carbon nitride material as reducing agents both towards MV2+ and oxygen. We want to understand the reaction kinetics of photoinduced charges in K,Na‐PHI and the subsequent MV2+ reduction. Therefore, the sample's absorbance at 606 nm, which is proportional to the concentration of reduced MV.+, is followed in the dark (Figure 1d). A colour change to light blue was observed when MV2+ was added to the sample previously illuminated at 365 nm. This instantaneous colour change contributes to the signal at 0 min and is followed by a continuous increase of the absorption at 606 nm, which reaches a stable value on the time scale of tens of minutes. The rate of the colour change (the initial slope of the absorbance kinetics) is affected by the MeOH concentration.
Figure 2.
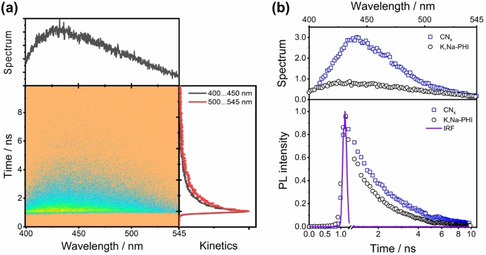
(a) Spectrally‐resolved streak camera image of the PL from the drop‐casted K,Na‐PHI upon 385 nm excitation and its integrated PL spectrum and PL decay curves extracted from the streak‐camera image are shown in the upper and the right panel respectively. The PL spectrum is obtained by integrating the signal over the time window, while the PL‐kinetics stem from integration along the wavelength axis in the indicated spectral ranges. (b) tr‐PL spectra and kinetics of drop‐casted K,Na‐PHI integrated with the measurement windows in comparison with the melamine‐derived conventional CNx. The instrumental response function is given as a violet line.
Furthermore, the steady‐state concentration of MV.+ (observed at 90 min and estimated by the optical density at 606 nm) depends on the presence of MeOH. Upon increasing the MeOH volume fraction from 10 to 30 vol % the half reaction time increases slightly from approximately 11 to 16 min and the optimal final optical density at 606 nm is observed in the mixture of 10 % MeOH volume fraction. Taking into account the extinction coefficient of MV.+ in water (13700 m −1cm−1 at 606 nm) and MeOH (13800 m −1cm−1), [15] the amount of accumulated electrons in the water‐soluble K,Na‐PHI is estimated. Assuming complete transfer of electrons previously stored in K,Na‐PHI to MV2+, we estimate that K,Na‐PHI in a H2O/MeOH mixture (9 : 1, v/v; ϵ=13710 m −1cm−1) can store 32.2 μmol of electrons per gram material. When kept in the dark (blank experiment), the water‐soluble carbon nitrides did not reduce MV2+ under otherwise identical conditions. Additionally, we used K,Na‐PHI as a photocatalyst to drive MV2+ reduction under 365 nm illumination, which resulted in much higher differential absorbance of photogenerated MV.+ at 606 nm (Figure S4). The differential absorbance at 606 nm increased proportionally with the increasing methanol content. We took the advantage of very low scattering of the K,Na‐PHI solution and determined the quantum yield for formation of MV.+ at 365 nm as 10.1±0.7 % (95 % confidence interval; 7 : 3 v/v of H2O/MeOH; see Supporting Information for details). This value is similar to the quantum yield of 10 % for formation of 4‐methoxybenzyl aldehyde from 4‐methoxybenzyl alcohol at K,Na‐PHI that we reported earlier. [11]
Furthermore, the steady‐state photoluminescence (PL) intensity of K,Na‐PHI in a MeOH/H2O mixture was also investigated. The steady‐state emission shows significantly lower intensity after irradiation (Figure 1a, dashed lines), suggesting that methanol as a hole scavenger decreases the number of holes available for radiative decay of electron‐hole pairs.
Time‐resolved photoluminescence
Time‐resolved photoluminescence (tr‐PL) was recorded from drop‐casted films, as solutions of K,Na‐PHI did not reveal appreciable emission to be detected with the streak camera. Time‐resolved PL spectra upon excitation at 385 nm (Figure 2a upper panel) show a broad band at 400–540 nm comparable to the steady‐state emission (Figure 1a). Integral PL kinetics in the range of 400–450 nm and 500–545 nm (Figure 2a right panel), decay on a nanosecond timescale. The longer wavelength kinetics decays with a characteristic half‐time of 0.38 ns compared to 0.27 ns observed for the shorter‐wavelength kinetics. This indicates a reduced mobility of the defect‐bound excitons as compared to higher‐energy free excitons, which are responsible for shorter wavelength emission. [16] The presence of various trapped excitons near the bandgap is also inferred from steady‐state PL spectra (Figure S5a): shifting the excitation wavelengths from the near‐UV to 420 nm yields a drop in emission intensity, resulting from the decreased excitation probability as reflected in the absorption spectra of the material. However, shifting the excitation wavelength from 420 to 580 nm, a shift of the PL maximum from 480 to 600 nm is apparent. However, such feature is not observed in conventional carbon nitride synthesized through thermal polycondensation of melamine (Figure S5b). [17] Conventional carbon nitride exhibits a comparably narrow emission (Figure S6a) and an enhanced PL (Figure 2b) compared to K,Na‐PHI, regardless of the higher absorbance of K,Na‐PHI at the excitation wavelength (see Figure S6b). This indicates that the inclusion of alkali metals and/or new surface functional groups (C≡N and C−O−) during the synthesis may increase the number of trapped states in the materials, which in turn broaden the energetic spread of the excitonic states and hence the emission spectrum. Thus, we conclude that different sub‐populations of trapped electrons are present upon varying the PL‐excitation wavelength near the band edge of the water‐soluble K,Na‐PHI. Figure 2b compares the PL kinetics integrated over the entire emission band (i. e., 400 to 540 nm) for both conventional CNx and water‐soluble K,Na‐PHI. The PL of K,Na‐PHI decays slightly faster (half lifetime of 0.3 ns) than for the conventional CNx (half lifetime of 0.5 ns). This faster excitonic emission decay indicates an enhanced exciton dissociation in K,Na‐PHI compared to conventional CNx.
Transient absorption spectroscopy
Transient absorption spectroscopy studies the non‐emissive excited states in aqueous K,Na‐PHI colloidal solutions. Figure 3a displays the transient absorption spectra of K,Na‐PHI in water in the absence of hole scavengers. The broad absorption feature centered at around 640 nm contains contributions from trapped electrons as revealed from steady‐state absorption studies, likely as well as trapped holes and free electrons. These species cannot be spectrally easily disentangled, as they have been shown to exhibit broad and rather overlapped spectral features in inorganic semiconductor materials. [18] To separate the different signal contributions, we attempted transient absorption experiments in the presence of either hole (MeOH) or electron scavengers (Ag+ ions). However, addition of either of the scavengers does not drastically alter the photoinduced absorption feature in the visible range (Figure S7). Nonetheless, the transient absorption signals decay faster upon addition of MeOH, while AgNO3 on the other hand does not significantly impact the kinetics of the transient absorption decay on the fs‐ns timescale. Due to the spectral congestion of the individual signal contributions in the water‐soluble carbon nitride, we consider the overall charge‐carrier trapping kinetics as reflected in the transient absorption kinetics in the visible region.[ 9a , 10c , 18 ] Figure 3b summarizes the femtosecond‐transient absorption kinetics (fs‐TA) recorded at 450, 550, 650 and 750 nm within 10 ns after photoexcitation. The overall transient absorption decay shows a probe‐wavelength independent behavior on this timescale (inset of Figure 3b). The absence of spectral shifts may indicate that electron‐hole recombination takes place without significant contribution of trapped states. This apparently different conclusion as compared to that derived from transient PL measurements described above can be possibly rationalized by immobilization (drop‐casted films) of the sample for the time‐resolved emission experiment, while the transient absorption measurements were carried out with a K,Na‐PHI solution. An alternative explanation that cannot be ruled out based on the available experimental data is an extremely rapidly (within the experimental time resolution) established thermal equilibrium between free charges and charges in shallow traps, which remains unaltered on the ns timescale of the experiment. Nanosecond‐time‐resolved transient absorption spectroscopy (ns‐TA) investigates the subsequent photoinduced processes in the microsecond range. A broad absorption peak in the visible range is observed initially, comparable to the overall differential absorption observed on the sub‐10 ns timescale (Figure 3c, gray line). During the first 10 μs the ns‐TA kinetics recorded at 650 nm decay faster than the respective kinetics recorded at shorter probe wavelengths. For longer delay times (i. e., >10 μs; Figure 3d, inset) no major spectral changes are observed. There is still residual signal left beyond the time range accessible in our experiment (Figure S8), which indicates the survival population of long‐lived deep trapped charges. Thus, the ns decay kinetics reflected in the relaxation of charge carriers from initially shallow traps into deep trapped states occurs in a μs range.
Figure 3.

(a) fs‐transient absorption spectra of K,Na‐PHI measured at selected time delays after excitation at 330 nm, ≈72 μJ cm−2 per pulse: the spectra were smoothed by adjacent‐averaging method to reduce high‐frequency noise from scattering (the original data are shown in the Figure S9a). The fs‐transient absorption data were recorded at increased concentration (5 g L−1) compared to the ns‐TA data to improve the S/N of the data. (b) Decay kinetics at selected wavelengths and the insert shows their corresponding normalized decay curves (c) ns‐transient absorption spectra of K,Na‐PHI recorded at selected time upon 355 nm excitation and (d) its decay kinetics at selected wavelengths, inset: their corresponding normalized decay curves.
Pump‐intensity‐dependent transient absorption spectroscopy
We next focus on an analysis of the globally integrated (i. e., probe‐wavelength‐independent) transient absorption kinetics (spectrally integrated between 450 and 750 nm, see Figure S9b). Within the 1 ps the signal initially rises, likely reflecting ultrafast relaxation from initially hot states prior to charge trapping. [19] The subsequent decay of the transient absorption signal can be fitted monoexponentially during the first 100 ps; at later times, the fs‐TA kinetics are best represented by a power law decay [Eq. 1]:
| (1) |
where I represents the TA signal at a specified probe wavelength, β is the power‐law exponent with β ps‐ns=0.28±0.02. We assign this monoexponential decay at early times, which accounts for about 43 % of the over signal amplitude loss, to geminate recombination of excitons. The power‐law decay appears not only in the late fs‐TA data but also in the ns/μs‐TA data (Figure S9b, blue line, and Figure 3d). It reflects trap‐assisted recombination, that is, the electron relaxes into a trapped state before recombining with a hole. A corresponding analysis of the ns‐TA kinetics using a power law yields an exponent β μs‐ms in the range of 0.12 to 0.19 (Figure 3d dashed lines). This power‐law transient absorption decay behavior demonstrates that trap‐assisted recombination can take place at relatively long delay times. This observation is in line with reports on the phenomenon also for solid‐state semiconductors, such as TiO2 or ZnO. [20] The different values for β μs‐ms and β ps‐ns indicate that trap‐assisted recombination on short timescales (sub‐ns) may involve a different set of traps than the corresponding relaxation processes at later times (μs) in terms of trap depth and density. The distinct sets of traps involved in relaxation on the different timescales is also reflected in the slight differences in the differential absorption spectra recorded on a sub‐ns scale (Figure 3a) and on some tens of μs timescale (Figure 3c). To understand the impact of the density of initially excited excitons on the charge carrier dynamics, pump‐intensity‐dependent transient absorption kinetics are recorded. The linear relation between pump intensity and initial transient signal (see Figure S9c) indicates the absence of nonlinear absorption or nonlinear relaxation during the pulse duration. The pump‐intensity‐independent sub‐ns transient absorption kinetics (Figure 4a) show a half‐lifetime of about 90 ps. The ns‐TA decay profiles (see Figure 4b) are also almost identical irrespective of the pump intensity with a power‐law fitting yielding β=0.16±0.01. The pump‐intensity independent kinetics both in the ps‐ns and μs‐ms ranges indicate either (i) that a single electron‐hole pair is generated within a particle and undergoes geminate recombination, or (ii) the presence of free carriers, with trap‐assisted recombination of a mobile charge with a trapped carrier dominating the signal. Such process would be first‐order when the recombination rate for one carrier is much faster than the recombination rate of the second charge species. [21]
Figure 4.
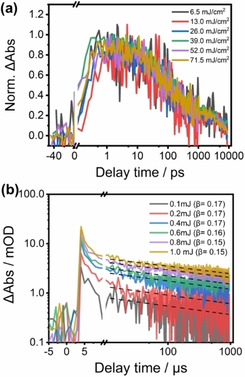
(a) Normalized fs‐transient absorption of K,Na‐PHI recorded at 650 nm at various pump intensities upon 330 nm excitation. (b) ns‐TA data probed at 700 nm recoded upon excitation at 355 nm.
Photophysical studies of K,Na‐PHI in the presence of MeOH as electron donor
Ultimately, different amounts of MeOH (i. e., up to 30 vol %) were added, while the concentration of K,Na‐PHI was kept at 1 g L−1. Addition of MeOH did not cause spectral changes of the transient absorption band with its broad maximum near 650 nm, indicating the same photogenerated species being observed irrespective of the addition of MeOH. However, a probe wavelength dependence is apparent when comparing the transient absorption decay between 450 and 750 nm and between 750 and 790 nm (Figure 5a). This demonstrates that the presence of a hole scavenger causes two distinguishable signal contributions to be visible, the relaxation dynamics of which become separated. Nonetheless, increasing the concentration of the electron donor leads to overall changes in the transient absorption kinetics, which are qualitatively identical for the probe range from 450–750 nm and 750–790 nm (Figure 5b and Figure S10). Figure 5b,c shows the respective kinetics in the range of 450–750 nm at different timescales: adding MeOH from 1 to 30 vol % accelerates the decay within approximately 100 ps, while no obvious changes are observed at longer timescale.
Figure 5.
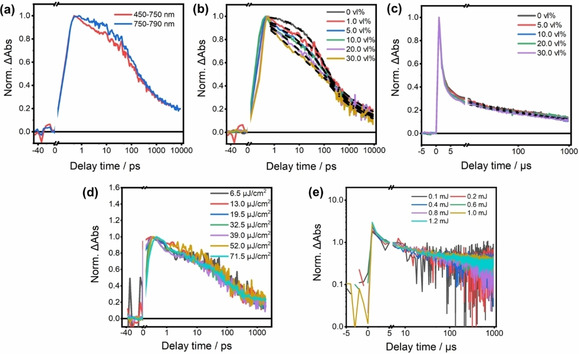
(a) fs‐transient decay kinetics of K,Na‐PHI in water at different wavelength ranges. (b) Charge recombination kinetics probed from 450–750 nm with variation of MeOH volume fraction in the aqueous K,Na‐PHI (1 g L−1). The dashed lines represent the fitting from stretched exponential and power law functions. (c) Normalized decay kinetics of K,Na‐PHI during ns‐TA measurement upon various volume ratios of MeOH under 355 nm excitation. (d) Fluence‐independent decays kinetics of K,Na‐PHI in a H2O/MeOH (9 : 1 vol %) mixture monitored from 450 to 750 nm with variation of pump fluence for fs‐TA (the kinetics have been normalized to the signal amplitude at roughly 0.4 fs) and (e) for ns‐TA probed at 650 nm, which are normalized to one at 5 μs.
Effect of stirring the sample
Following reports by Durrant and co‐workers, [10c] we investigated the effect of stirring the sample on the transient absorption kinetics. To this end, K,Na‐PHI is dissolved either in water or a 90 : 10 vol % water/methanol mixture and studied by transient absorption spectroscopy under stirring (Figure S9d). Under such experimental conditions the fs‐ns transient absorption kinetics do not show any acceleration caused by the addition of methanol. This indicates that the accelerated decay observed for the static sample results from the interaction of the photoexcited carbon nitride with accumulated electrons rather than direct hole scavenging in the presence of methanol. When the stirring is stopped, the accelerated decay in the presence of MeOH reappears, while no significant changes of the transient absorption kinetics are observed in the absence of MeOH. The faster decay in the presence of MeOH is ascribed to the reaction of the radical anions generated by fast hole scavenging and accumulating with increasing the number of laser shots interacting with the sample after excitonic excitations. If the sample is stirred, methanol has no detectable effect on the transient absorption signal decay as no reduced species accumulate in the carbon nitride material. In the following, we analyze the transient absorption kinetics from the static samples recorded between 1 and 200 ps quantitatively. While in the absence of MeOH the initial kinetics were monoexponential (see above), the kinetics in the presence of MeOH are best approximated by a stretched‐exponential [Eq. 2]:
| (2) |
where ΔOD(t) represents the TA signal at probed wavelengths, τ and α are the decay time constants and the stretching exponent parameter (>0 and <1), respectively with α in the range from 0.14 (30 vol % MeOH) to 0.46 (1 vol % MeOH, Figure S11). Such stretched‐exponential behavior is typical for dispersive transport in disordered materials. [22] In the presence of MeOH, the concentration of radical anions may dominate and consequently the recombination becomes rate limited by dispersive hole transport in the energetically disordered material. Furthermore, the kinetics at longer timescale (i. e., >200 ps) display no changes upon increasing the MeOH concentration (Figure 5b,c). The respective kinetics reflect a power‐law decay with β μs‐ms=0.16±0.02 (considering the ns‐transient absorption data shown in Figure 5c) and β ps‐ns=0.24–0.31 (as derived from the sub‐10 ns transient absorption data, Figure 5b). The negligible effect on slow decay components by the presence of a sacrificial donor might indicate that holes in shallow traps are more prone to quenching by MeOH, while holes which have relaxed to deeper traps, are unaffected by the scavenger. Alternatively, a scenario in which, at early delay time, holes and electrons contribute to the differential absorption signal, while at long delay times only electrons contribute (due to rapid quenching of all available holes), cannot be excluded.
Effect of excitation intensity
Finally, we consider the excitation fluence dependence of the kinetics in the visible region (450–750 nm) in the presence of 10 vol % MeOH. While the maximum signal amplitude, measured at short delay times, scales linearly with excitation intensity, the decay kinetics in the presence of 10 vol % MeOH do barely reveal any fluence dependence. Over the entire range of pump intensities explored, a signal decay half‐time of approximately 80 ps is determined from fs‐TA (Figure 5d). Also, the corresponding pump‐intensity‐dependent ns‐TA measurements are pump‐fluence independent (Figure 5e). This can be explained by the already high density of hole scavengers in the vicinity of the K,Na‐PHI. If the scavenger concentration exceeds the concentration of trapped holes, photoexcitation leads to a large excess of electrons in the carbon nitride. Thus, the recombination of the photo‐generated electrons/radical anions with the (fewer available) holes becomes quasi‐first order and as such independent on the pump‐intensity.
Conclusion
Here, we report spectroscopic‐mechanistic investigation of a novel water‐soluble carbon nitride, K,Na‐PHI, to elucidate UV‐driven photo‐charging process in the material. K,Na‐PHI can store 32.2 μmol of electrons per gram in a H2O/MeOH mixture under a concentration of 0.25 g L−1. The charge storage capacity of the water‐soluble carbon nitride investigated here is thus in the same order of magnitude as that of K‐PHI materials reported by Savateev et al. [13a] We show that the electrons stored in K,Na‐PHI can be also used on demand to reduce, for example, dioxygen or MV2+. Given the negligible scattering of K,Na‐PHI solutions, we were able to determine the quantum yield for light‐driven formation of MV.+ that was 10.1±0.7 % at 365 nm. Different from conventional carbon nitrides, [17] the water‐soluble K,Na‐PHI displays spectrally broad photoinduced absorption features in the visible region, which might indicate altered excited‐state relaxation pathways. These changes in excited‐state topology might correlate with the higher number of surface functional groups in the material. By applying time‐resolved absorption and emission spectroscopy, we can show that charge trapping results from the interplay of geminate recombination of photogenerated electrons and holes and subsequent charge trapping (Figure 6). The comparably short‐lived photoluminescence and the absence of stimulated emission contributions in the transient absorption signals already indicates efficient exciton dissociation, which might support the excellent charge storage capacity. The addition of MeOH as hole scavenger accelerates the decay of the transient absorption signal on a sub‐ns timescale, while it does not impact the μs‐ms decay kinetics. The latter kinetic component may reflect the decay of deeply trapped electrons. In an attempt to also selectively extract electrons from the photoexcited material, we added Ag+ ions as electron scavengers. However, this did not yield a change in the photoinduced relaxation kinetics at ps timescale, pointing to differences in the reactivity of electrons and holes towards sacrificial agents.
Figure 6.
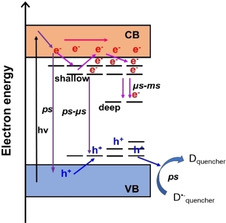
Schematic of the proposed charge transport model in the water‐soluble carbon nitride; D.− quencher: K,Na‐PHI.− anion radicals; CB: conduction band; VB: valence band.
Overall, the results emphasize the importance of the synthetic challenge to modulate trap density and depth in carbon nitride materials to tune the reactivity of long‐lived trapped charges. Our current understanding of the material suggests that water‐soluble PCN surface functional groups (e. g., cyamelurate, melonate or primary amine moieties) may constitute the deep traps, which lead to unreactive deep trapped electrons. [9a] Furthermore, improvements of catalytic activity can be expected upon introducing cocatalysts for reductive transformations. Thus, this contribution advances our current understanding of carbon nitride systems and their capacity to act both a charge‐storing materials and photocatalysts.
Experimental Section
Materials
Aqueous water‐soluble carbon nitride simples (5 g L−1) are prepared as reported and diluted to the proper concentrations. [11] Methyl viologen dichloride hydrate (98 %), Methanol (for HPLC, ≥99.9%) and 4‐Methoxybenzyl alcohol (98%) was obtained from Sigma‐Aldrich and used without further purification. Oxygen‐free solutions were realized by at least three freeze‐pump‐thaw cycles and kept in an airtight cuvette for the spectroscopic investigation. Samples for time‐resolved emission measurement were obtained by simply drop‐casting their suspensions in ethanol on a microscope slide and allowed to dry at room temperature.
Steady‐state UV/Vis and emission spectroscopy
The steady‐state absorption spectra were measured in 1 cm quartz cuvettes using a Jasco V780 UV/Vis/NIR spectrophotometer. For in‐situ UV/Vis measurements, the water‐soluble carbon nitride samples were irradiated using a 365 nm LED (Thorlabs, M365LP1) with the irradiance of 71 mW mm−2 within the UV/Vis spectrometer. The UV/Vis spectra under illumination were collected immediately after 10 min irradiation followed by each 2 min in dark for 4 times as a cycle. The K,Na‐PHI radical anion quenching experiment with methyl viologen was performed under LED irradiation (λ=365 nm, ≈47 mW cm−2). The sealed cuvette with the reaction mixtures was pre‐illuminated for 2 h followed by adding MV2+ in the glovebox before transferring into the spectrometer for UV/Vis analysis each 10 min. Number of electrons (μmol) trapped in K,Na‐PHI was calculated according to Equation 3:
| (3) |
where ΔAbs is the absorbance of MV+ solution at 606 nm, V total is the total volume of the reaction mixture, ϵ is the extinction coefficient of MV+ in water/methanol mixture, and L is the optical path of the quartz cuvette. The K,Na‐PHI photocatalytic experiment was performed under LED irradiation (λ=365 nm). The sealed cuvette with the reaction mixtures (K,Na‐PHI, MeOH, MV2+) was illuminated for 5 min before its absorption spectrum was recorded (see Supporting Information for details). The photoreaction apparent quantum yield of MV2+ reduction was calculated according to Equation 4:
| (4) |
where ΔAbs is the absorbance of MV+ solution at 606 nm, V total is the total volume of the reaction mixture, ϵ is the extinction coefficient of MV+ in water/methanol mixture (13730 m −1 cm−1 at 30 vol % of MeOH), ΔW is the illumination power change upon addition of K,Na‐PHI, t is the illumination time (5 min), λ is the illumination wavelength; h is the Planck constant, c is the light speed, and N A is the Avogadro constant.
Steady‐state emission spectra (λ ex=380 nm) were recorded using an FLS980 photoluminescence spectrometer (Edinburgh Instruments Ltd, the United Kingdom) equipped with an ozone‐free Xenon arc lamp as the light source in a 1 cm quartz cell.
Time‐resolved emission spectroscopy
Spectrally resolved emission decay profiles were measured using a Hamamatsu streak scope C4334 (Hamamatsu Photonics, Japan) in photon counting mode with a time window of 10 ns. The sample was excited with a frequency‐doubled output of a Ta‐sapphire laser (Tsunami, Newport Spectra‐Physics GmbH, the USA) at around 380 nm at a pulse repetition rate of 400 kHz after passing a pulse selector (model 3980, Newport Corporation, the USA). The emissions from the sample were collected by a Chromex 250IS 3 imaging spectrograph. The HPDTA software was used to analyze the two‐dimensional (time and wavelength) emission decay profiles via integrating the two‐dimensional (time and wavelength) emission decay profiles.
Time‐resolved transient absorption spectroscopy
Femtosecond (fs) transient absorption was performed in a quartz cuvette with 1 mm path length at room temperature. A custom‐built setup was employed to acquire fs‐TA data. The setup is described in detail elsewhere. [23] A white‐light supercontinuum probe pulse at 1 kHz repetition rate was generated by focusing a minor part of the output of the Ti:Sapphire amplifier into a CaF2 plate mounted on a rotating stage. It is split into probe and reference using a beamsplitter. The probe pulse is focused onto the sample using a concave mirror with 500 nm focal length. The spectra of probe and reference are detected by a Czerny‐Turner spectrograph of 150 mm focal length (SP2150, Princeton Instruments) equipped with a diode array detector (Pascher Instruments AB, Sweden). The pump pulses around 330 nm wavelength with a pulse duration of approximately 100 fs generated by a TOPAS amplifier have been used. The repetition rate of the pump pules has been reduced to 0.5 kHz by a mechanical chopper, and the polarization is adjusted to the magic angle by a Berek compensator and a polariser. The photoinduced dynamics were obtained by delaying the probe pulses in time with regard to the pump pulses by using a motorized short/long optical delay line. For data analysis, first the data was preprocessed to correct for the chirp, and in the following, a sum of exponential functions has been fitted to the data using customized data analysis software (Pascher Instruments AB, Lund, Sweden). The pulse overlap region of ±150 fs has been excluded from the data evaluation due to coherent artefacts in this temporal region. [24]
Nanosecond (ns) transient absorption spectra were used to study the lifetime of the long‐lived species. The pump pulses centered at 355 nm were produced by a continuum surelite Nd:YAG laser system (pulse duration 5 ns, repetition rate 10 Hz). The probe light is provided by a 75 W xenon arc lamp. Spherical concave mirrors are used to focus the probe beam into the samples and then to send the beam to the monochromator (Acton, Princeton Instruments). The spectrally selected probe light is detected by a Hamamatsu R928 photomultiplier. TA spectra were recorded by using a 355 nm notch filter before the detector to eliminate the pump scattering and a short pass filter (520 nm) was used to get rid of the red component in the excitation pump. The signal is amplified and processed by a commercially available detection system (Pascher Instruments AB). Each sample was freshly prepared and its optical density was kept at about 0.3 at the excitation wavelength. All measurements were performed in 1 cm path length inert cuvettes.
Conflict of interest
The authors declare no conflict of interest.
Supporting information
As a service to our authors and readers, this journal provides supporting information supplied by the authors. Such materials are peer reviewed and may be re‐organized for online delivery, but are not copy‐edited or typeset. Technical support issues arising from supporting information (other than missing files) should be addressed to the authors.
Supplementary
Acknowledgements
This work was funded by the Deutsche Forschungsgemeinschaft via the TRR 234 catalight (DFG, German Research Foundation) – Projektnummer 364549901 – TRR 234 [B6]. I. K. acknowledges the support of the Alexander von Humboldt Foundation through the Humboldt Research Fellowship. Open access funding enabled and organized by Projekt DEAL.
C. Li, E. Hofmeister, I. Krivtsov, D. Mitoraj, C. Adler, R. Beranek, B. Dietzek, ChemSusChem 2021, 14, 1728.
Contributor Information
Prof. Radim Beranek, Email: radim.beranek@uni-ulm.de.
Prof. Benjamin Dietzek, Email: benjamin.dietzek@leibniz-ipht.de.
References
- 1.
- 1a. Advances in Photoelectrochemical Water Splitting: Theory, Experiment and Systems Analysis (Eds.: S. D. Tilley, S. Lany, R. van de Krol), Royal Society of Chemistry, London, 2018;
- 1b. Photoelectrochemical solar fuel production (Eds.: S. Giménez, J. Bisquert), Springer International Publishing, Switzerland, 2016;
- 1c. Solar to Chemical Energy Conversion: Theory and Application (Eds.: M. Sugiyama, K. Fujii, S. Nakamura), Springer International Publishing, Switzerland, 2016.
- 2. Wang X., Maeda K., Thomas A., Takanabe K., Xin G., Carlsson J. M., Domen K., Antonietti M., Nat. Mater. 2009, 8, 76–80. [DOI] [PubMed] [Google Scholar]
- 3.
- 3a. Wang L., Mitoraj D., Turner S., Khavryuchenko O. V., Jacob T., Hocking R. K., Beranek R., ACS Catal. 2017, 7, 4759–4767; [Google Scholar]
- 3b. Savateev A., Ghosh I., König B., Antonietti M., Angew. Chem. Int. Ed. 2018, 57, 15936–15947; [DOI] [PubMed] [Google Scholar]; Angew. Chem. 2018, 130, 16164–16176; [Google Scholar]
- 3c. Zheng Y., Liu J., Liang J., Jaroniec M., Qiao S. Z., Energy Environ. Sci. 2012, 5, 6717–6731; [Google Scholar]
- 3d. Kessler F. K., Zheng Y., Schwarz D., Merschjann C., Schnick W., Wang X., Bojdys M. J., Nat. Rev. Mater. 2017, 2, 17030. [Google Scholar]
- 4.
- 4a. Dong F., Wu L., Sun Y., Fu M., Wu Z., Lee S., J. Mater. Chem. 2011, 21, 15171–15174; [Google Scholar]
- 4b. Zhang Y., Liu J., Wu G., Chen W., Nanoscale 2012, 4, 5300–5303; [DOI] [PubMed] [Google Scholar]
- 4c. Hwang S., Lee S., Yu J.-S., Appl. Surf. Sci. 2007, 253, 5656–5659. [Google Scholar]
- 5. Lau V. W.-H., Moudrakovski I., Botari T., Weinberger S., Mesch M. B., Duppel V., Senker J., Blum V., Lotsch B. V., Nat. Commun. 2016, 7, 12165. [DOI] [PMC free article] [PubMed] [Google Scholar]
- 6. Xu J., Wang H., Zhang C., Yang X., Cao S., Yu J., Shalom M., Angew. Chem. Int. Ed. 2017, 56, 8426–8430; [DOI] [PubMed] [Google Scholar]; Angew. Chem. 2017, 129, 8546–8550. [Google Scholar]
- 7. Zhang Y., Mori T., Ye J., Antonietti M., J. Am. Chem. Soc. 2010, 132, 6294–6295. [DOI] [PubMed] [Google Scholar]
- 8.
- 8a. Wang L., Bledowski M., Ramakrishnan A., Könnig D., Ludwig A., Beranek R., J. Electrochem. Soc. 2012, 159, H616–H622; [Google Scholar]
- 8b. Bledowski M., Wang L., Ramakrishnan A., Bétard A., Khavryuchenko O. V., Beranek R., ChemPhysChem 2012, 13, 3018–3024; [DOI] [PubMed] [Google Scholar]
- 8c. Bledowski M., Wang L., Neubert S., Mitoraj D., Beranek R., J. Phys. Chem. C 2014, 118, 18951–18961; [Google Scholar]
- 8d. Khavryuchenko O. V., Wang L., Mitoraj D., Peslherbe G. H., Beranek R., J. Coord. Chem. 2015, 68, 3317–3327; [Google Scholar]
- 8e. Longchin P., Mitoraj D., Mendoza Reyes O., Adler C., Wetchakun N., Beranek R., J. Phys. Energy 2020, 2, 044001; [Google Scholar]
- 8f. Caputo C. A., Wang L., Beranek R., Reisner E., Chem. Sci. 2015, 6, 5690–5694. [DOI] [PMC free article] [PubMed] [Google Scholar]
- 9.
- 9a. Godin R., Wang Y., Zwijnenburg M. A., Tang J., Durrant J. R., J. Am. Chem. Soc. 2017, 139, 5216–5224; [DOI] [PubMed] [Google Scholar]
- 9b. Corp K. L., Schlenker C. W., J. Am. Chem. Soc. 2017, 139, 7904–7912; [DOI] [PubMed] [Google Scholar]
- 9c. Merschjann C., Tschierlei S., Tyborski T., Kailasam K., Orthmann S., Hollmann D., Schedel-Niedrig T., Thomas A., Lochbrunner S., Adv. Mater. 2015, 27, 7993–7999. [DOI] [PubMed] [Google Scholar]
- 10.
- 10a. Chen Z., Zhang Q., Luo Y., Angew. Chem. Int. Ed. 2018, 57, 5320–5324; [DOI] [PubMed] [Google Scholar]; Angew. Chem. 2018, 130, 5418–5422; [Google Scholar]
- 10b. Kasap H., Caputo C. A., Martindale B. C., Godin R., Lau V. W.-h., Lotsch B. V., Durrant J. R., Reisner E., J. Am. Chem. Soc. 2016, 138, 9183–9192; [DOI] [PMC free article] [PubMed] [Google Scholar]
- 10c. Yang W., Godin R., Kasap H., Moss B., Dong Y., Hillman S. A., Steier L., Reisner E., Durrant J. R., J. Am. Chem. Soc. 2019, 141, 11219–11229. [DOI] [PubMed] [Google Scholar]
- 11. Krivtsov I., Mitoraj D., Adler C., Ilkaeva M., Sardo M., Mafra L., Neumann C., Turchanin A., Li C., Dietzek B., Leiter R., Biskupek J., Kaiser U., Im C., Kirchhoff B., Jacob T., Beranek R., Angew. Chem. Int. Ed. 2020, 59, 487–495; [DOI] [PMC free article] [PubMed] [Google Scholar]; Angew. Chem. 2020, 132, 495–503. [Google Scholar]
- 12. Savateev A., Antonietti M., ChemCatChem 2019, 11, 6166–6176. [Google Scholar]
- 13.
- 13a. Savateev A., Kurpil B., Mishchenko A., Zhang G., Antonietti M., Chem. Sci. 2018, 9, 3584–3591; [DOI] [PMC free article] [PubMed] [Google Scholar]
- 13b. Podjaski F., Kröger J., Lotsch B. V., Adv. Mater. 2018, 30, 1705477; [DOI] [PubMed] [Google Scholar]
- 13c. Lefebvre J.-F., Schindler J., Traber P., Zhang Y., Kupfer S., Gräfe S., Baussanne I., Demeunynck M., Mouesca J.-M., Gambarelli S., Artero V., Dietzek B., Chavarot-Kerlidou M., Chem. Sci. 2018, 9, 4152–4159; [DOI] [PMC free article] [PubMed] [Google Scholar]
- 13d. Schulz M., Hagmeyer N., Wehmeyer F., Lowe G., Rosenkranz M., Seidler B., Popov A., Streb C., Vos J. G., Dietzek B., J. Am. Chem. Soc. 2020, 142, 15722–15728; [DOI] [PubMed] [Google Scholar]
- 13e. Sakar M., Nguyen C. C., Vu M. H., Do T. O. J. C., ChemSusChem 2018, 11, 809–820; [DOI] [PubMed] [Google Scholar]
- 13f. Podjaski F., Lotsch B. V., Adv. Energy Mater. 2020, 2003049. [Google Scholar]
- 14. Kongkanand A., Kamat P. V., J. Phys. Chem. C 2007, 111, 9012–9015. [Google Scholar]
- 15. Watanabe T., Honda K., J. Phys. Chem. 1982, 86, 2617–2619. [Google Scholar]
- 16. Choudhury B., Paul K. K., Sanyal D., Hazarika A., Giri P. K., J. Phys. Chem. 2018, 122, 9209–9219. [Google Scholar]
- 17. Rajagopal A., Akbarzadeh E., Li C., Mitoraj D., Krivtsov I., Adler C., Diemant T., Biskupek J., Kaiser U., Im C., Heiland M., Jacob T., Streb C., Dietzek B., Beranek R., Sustain. Energy Fuels 2020, 4, 6085–6095. [Google Scholar]
- 18. Yoshihara T., Katoh R., Furube A., Tamaki Y., Murai M., Hara K., Murata S., Arakawa H., Tachiya M., J. Phys. Chem. B 2004, 108, 3817–3823. [Google Scholar]
- 19.
- 19a. Jing L., Zhu R., Phillips D. L., Yu J. C., Adv. Funct. Mater. 2017, 27, 1703484; [Google Scholar]
- 19b. Ruan Q., Miao T., Wang H., Tang J., J. Am. Chem. Soc. 2020, 142, 2795–2802. [DOI] [PMC free article] [PubMed] [Google Scholar]
- 20.
- 20a. Cohn A. W., Janßen N., Mayer J. M., Gamelin D. R., J. Phys. Chem. C 2012, 116, 20633–20642; [Google Scholar]
- 20b. Hirakawa T., Kamat P. V., J. Am. Chem. Soc. 2005, 127, 3928–3934. [DOI] [PubMed] [Google Scholar]
- 21.
- 21a. Howard I. A., Mauer R., Meister M., Laquai F., J. Am. Chem. Soc. 2010, 132, 14866–14876; [DOI] [PubMed] [Google Scholar]
- 21b. Rawalekar S., Kaniyankandy S., Verma S., Ghosh H. N., J. Phys. Chem. C 2010, 114, 1460–1466. [Google Scholar]
- 22.
- 22a. Phillips J. C., Rep. Prog. Phys. 1996, 59, 1133–1207; [Google Scholar]
- 22b. Nelson J., Chandler R. E., Coord. Chem. Rev. 2004, 248, 1181–1194; [Google Scholar]
- 22c. Sturman B., Podivilov E., Gorkunov M., Phys. Rev. Lett. 2003, 91, 176602. [DOI] [PubMed] [Google Scholar]
- 23. Siebert R., Akimov D., Schmitt M., Winter A., Schubert U. S., Dietzek B., Popp J., ChemPhysChem 2009, 10, 910–919. [DOI] [PubMed] [Google Scholar]
- 24.
- 24a. Dietzek B., Pascher T., Sundström V., Yartsev A., Laser Phys. Lett. 2007, 4, 38–43; [Google Scholar]
- 24b. Kovalenko S., Ernsting N. P., Ruthmann J., Chem. Phys. Lett. 1996, 258, 445–454. [Google Scholar]
Associated Data
This section collects any data citations, data availability statements, or supplementary materials included in this article.
Supplementary Materials
As a service to our authors and readers, this journal provides supporting information supplied by the authors. Such materials are peer reviewed and may be re‐organized for online delivery, but are not copy‐edited or typeset. Technical support issues arising from supporting information (other than missing files) should be addressed to the authors.
Supplementary