

Summary
Microbial communities are essential for a healthy soil ecosystem. Metals and radionuclides can exert a persistent pressure on the soil microbial community. However, little is known on the effect of long‐term co‐contamination of metals and radionuclides on the microbial community structure and functionality. We investigated the impact of historical discharges of the phosphate and nuclear industry on the microbial community in the Grote Nete river basin in Belgium. Eight locations were sampled along a transect to the river edge and one location further in the field. Chemical analysis demonstrated a metal and radionuclide contamination gradient and revealed a distinct clustering of the locations based on all metadata. Moreover, a relation between the chemical parameters and the bacterial community structure was demonstrated. Although no difference in biomass was observed between locations, cultivation‐dependent experiments showed that communities from contaminated locations survived better on singular metals than communities from control locations. Furthermore, nitrification, a key soil ecosystem process seemed affected in contaminated locations when combining metadata with microbial profiling. These results indicate that long‐term metal and radionuclide pollution impacts the microbial community structure and functionality and provides important fundamental insights into microbial community dynamics in co‐metal‐radionuclide contaminated sites.
Introduction
Microorganisms are essential for a healthy soil ecosystem. They have primary functions in biogeochemical cycles (Chen et al., 2003; Hayat et al., 2010; Madsen, 2011), organic matter turnover (Six et al., 2004; Kindler et al., 2009; Miltner et al., 2012), formation and maintenance of soil structure and fertility (Bronick and Lal, 2005; Schulz et al., 2013). For example, nitrogen fixation and nitrification are necessary to supply soluble nitrogenous compounds for plant growth (Kowalchuk and Stephen, 2001; Chen et al., 2003; Xia et al., 2011). Consequently, changes in the microbial community structure or inhibition of its functions can alter the soil ecosystem.
Anthropogenic activities such as mining and metallurgical processes, phosphate industry, agriculture, and industry in general contribute to a widespread pollution of soils with metals and radionuclides (UNSCEAR, 1993; IAEA, 2003; Loska et al., 2004; Prăvălie, 2014). In situ bioremediation has several advantages compared to standard physicochemical and mechanical techniques with respect to eco‐friendliness or cost. However, it necessitates the presence of metal‐resistant microbial communities (Groudev et al., 2001; Prakash et al., 2013; Khalid et al., 2017).
Metals and radionuclides can exert a persistent pressure on the microbial community (Frostegard et al., 1993; Simonoff et al., 2007; Wang et al., 2007). Indeed, numerous studies using a culture‐dependent or ‐independent approach demonstrated diverse effects of metal or radionuclide contamination on microbial communities (Sandaa et al., 2001; Ellis et al., 2003; Oliveira and Pampulha, 2006; Gołebiewski et al., 2014; Azarbad et al., 2015; Sitte et al., 2015; Guo et al., 2017; Li et al., 2017; Beattie et al., 2018). However, it is difficult to generalize the response of the residing microbial community to the metal or radionuclide contamination. For instance, some studies report a reduction of soil microbial biomass (Oliveira and Pampulha, 2006; Zhang et al., 2016; Song et al., 2018), while in other studies, no clear association between contamination and microbial biomass was observed (Gillan et al., 2005; Rousk and Rousk, 2018). Although the bacterial diversity frequently remained similar to non‐contaminated soils, changes in microbial community structure or physiological status have been demonstrated (Sandaa et al., 2001; Ellis et al., 2003; Azarbad et al., 2015; Sitte et al., 2015; Guo et al., 2017; Li et al., 2017; Theodorakopoulos et al., 2017; Beattie et al., 2018). On the other hand, microbes can influence metal/radionuclide mobility, toxicity and distribution, hence play an important role in the cycling of metals and radionuclides (Simonoff et al., 2007). Key processes are reduction, uptake and accumulation by cells, biosorption and complexation with proteins, polysaccharides and microbial biomolecules, and biomineralization with phosphates and carbonates (Groudev et al., 2001; Lloyd and Lovley, 2001; Lloyd, 2003; Ruggiero et al., 2005). Besides, resistance mechanisms can be transferred throughout the community (Aminov, 2011). Consequently, long‐term exposure enables microbial communities to adapt to metal or radionuclide contamination (Shi et al., 2002; Martinez et al., 2006). Therefore, detailed knowledge of the species and functional diversity, and physiology of the indigenous microbial population is of paramount importance. Although several studies have shown the effect of metals and/or uranium on the microbial community (Sandaa et al., 1999, 2001; Azarbad et al., 2015; Sitte et al., 2015; Boteva et al., 2016; Guo et al., 2017; Li et al., 2017; Sutcliffe et al., 2017; Beattie et al., 2018; Jacquiod et al., 2018), studies where the combination of metals and several radionuclides is investigated remain scarce.
We hypothesize that long‐term co‐contamination of metals, natural and artificial radionuclides affects the microbial community structure and functionality. To address this hypothesis, we studied the soil microbiome at various locations in a contaminated meadow of the Grote Nete river basin near Lier, a historically contaminated site due to discharges from the phosphate industry and the nuclear industry. We focused on the following questions: (i) is there a difference in the microbial community structure among locations with varying contamination levels? (ii) Can we link the observed differences to the contamination profile? (iii) Are there functional changes in the microbial community from the contaminated locations? Results provide important fundamental insights into microbial community dynamics in co‐metal‐radionuclide contaminated sites.
Results
Experimental site description
A contaminated meadow of the Grote Nete basin near Lier was sampled in eight locations (L1–L8) as well as one adjacent unpolluted location (L9). The meadow is located in the Campine region of Belgium, approximately 47 and 37 km downstream the outflow of the Molse Nete and the Grote Laak respectively (Fig. S1). The Molse Nete is contaminated with artificial radionuclides (e.g. 137Cs, 241Am, 60Co) due to cumulative historical discharges between 1960 and 1980 from the nuclear industries located in Mol and Dessel, although daily discharge limits were never exceeded. In addition, the former phosphate industry located in Tessenderlo is responsible for the contamination in the Grote Laak. Discharges until the early 1990s resulted in high concentrations of 226Ra and several metals (e.g. Cd, Zn, As) in the water bottom and river banks.
A contamination gradient was observed among the different sample locations
General soil characteristics and the total and dissolved concentration of several major ions were determined for each sampling point (Fig. S2). The pH was slightly acidic and ranged from 5.08 ± 0.23 to 5.49 ± 0.25, but did not differ significantly across locations. Moisture content gradually increased from L1 (17.21% ± 0.19% wt/wt) to L5 (53.8% ± 0.08% wt/wt). Location L6 showed a slightly lower moisture content than L5 (40.18% ± 1.19% wt/wt) and levels further decreased in L7–L9 (11.82% ± 0.3% wt/wt, 16.8% ± 0.24% wt/wt and 7.19% ± 0.01% wt/wt, respectively). Locations L7–L9 also contained the least amount of total organic carbon (TOC) with an average of 3.6% ± 0.4%. Location L1 contained the highest TOC (17.1% ± 0.3% wt/wt), while values of L2–L6 ranged from 9.0% ± 0.3% (wt/wt) to 13% ± 0.3% (wt/wt). These high TOC levels could be explained by flooding of the river banks and the consequent deposition of river sediments. Total inorganic carbon (TIC) was not detected in the samples.
Total concentrations of nine radionuclides (137Cs, 210Pb, 226Ra, 228Ra, 60Co, 241Am, 238U, 228Th, and 232Th) and nine metals (Co, Ni, Cu, Zn, As, Cd, Hg, Pb and Cr) were measured with gamma spectroscopy and EDXRF, respectively (Fig. 1). The levels of the natural radionuclide 232Th and its daughter products 228Ra and 228Th ranged within natural levels for Belgian subsoil (5–50 Bq/kg (FANC, 2020)) in all samples. The natural radionuclide 238U was also within the expected range (5–50 Bq/kg (FANC, 2020)) in most locations, however, a two‐ to five‐fold increase was measured at L4, L5 and L6. The 226Ra level in L9 was as expected between 10 and 30 Bq/kg (Paridaens and Vanmarcke, 2001; Licour et al., 2017), while a two‐ and four‐fold increase were measured in L8 and L7, respectively. The 226Ra levels in all other samples were 30 to 120 times higher compared to background levels. Similarly, L1–L6 contained up to nine times higher levels of the natural isotope 210Pb compared to the expected level in soil (19–111 Bq/kg (Ibrahim and Whicker, 1987)).
Fig. 1.
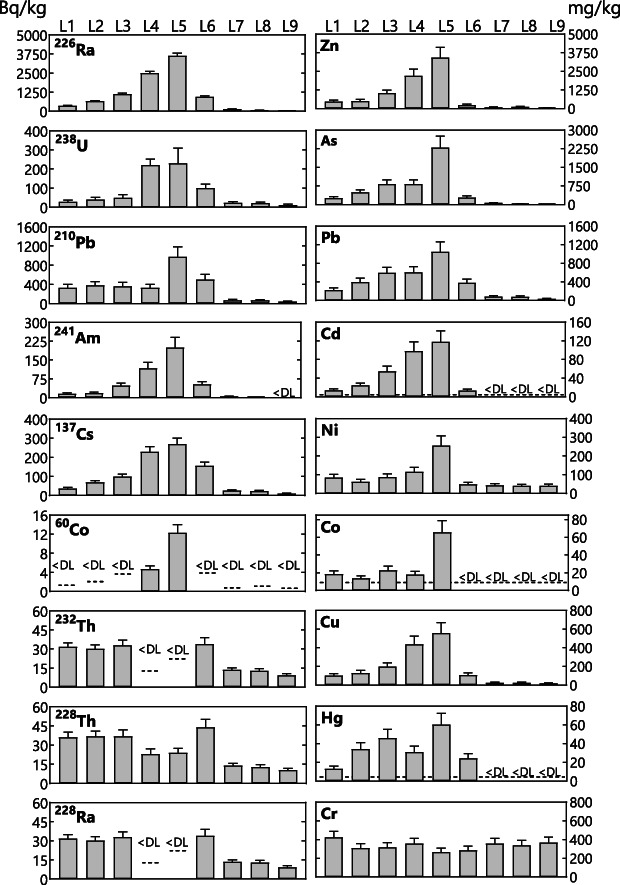
Overview of the total levels of radionuclides and metals at the different locations (L1–L9). Radionuclide lelvels are presented in Bq/kg soil and metal levels are shown as mg/kg soil. Error bars represent the measurement uncertainty. Values under the detection limit are shown as <DL, which is indicated with dotted line.
Next to natural radionuclides, artificial radionuclides (60Co, 137Cs and 241Am) were measured. Although 60Co levels were below the detection limit in seven locations, levels of 241Am and 137Cs increased from L1 to L5. Levels decreased from L6 onwards and L9 can be seen as non‐contaminated. Most metals showed a similar trend as the radionuclides, that is, levels gradually increased from L1 to L5 and decreased again up to the non‐contaminated L9. The highest levels were found for As and Zn, ranging from 9.6 mg/kg to 2300 mg/kg and from 49.9 mg/kg to 3430 mg/kg, respectively (Fig. 1).
A Pearson correlation‐based clustering of the measured compounds was performed with parameters that were significantly different among the locations and above the detection limit in most locations (Fig. 2). Seven distinct clusters were identified, with the largest cluster (cluster C) containing most metals and radionuclides, moisture, nitrate, total calcium, phosphate and total chloride (Fig. 2). The three radionuclides originating from the 232Th decay series, Al, and Ti clustered together (cluster E). Most dissolved ions comprised one cluster (cluster B), except potassium that correlated with S and TOC (cluster G) and ammonium that did not cluster with any other compound (cluster F). Another cluster was formed by Si and Cr (cluster A). Finally, total potassium did not cluster with any other compound (cluster D) (Fig. 2).
Fig. 2.

Clustered heatmap of the measured compounds using Pearson's correlation coefficients showing seven distinct clusters. The heatmap is coloured according to the correlation coefficients: red means positively correlated (ρ > 0), while blue means negatively correlated (ρ < 0). The representative of each cluster is indicated with a green asterisk. Dissolved ions are written in full, whereas abbreviations are used to indicate total element concentrations. [Color figure can be viewed at wileyonlinelibrary.com]
A principal component analysis (PCA) was performed to reveal possible similarities among the locations. The first three axes of the PCA could explain 90.3% of the observed variation. Moreover, it showed that L1, L2 and L3 were similar in chemical composition (Fig. 3). Location L6 appeared to be closely related to L1–L3 based on the first and second principal component, but it was different on the third principal component (Fig. 3B). The higher ammonium level in L6 compared to all other locations possibly explains this difference. Although L4 was most comparable to L5, the latter differed from all other locations. Despite a slight contamination, L7 and L8 grouped with the non‐contaminated L9.
Fig. 3.
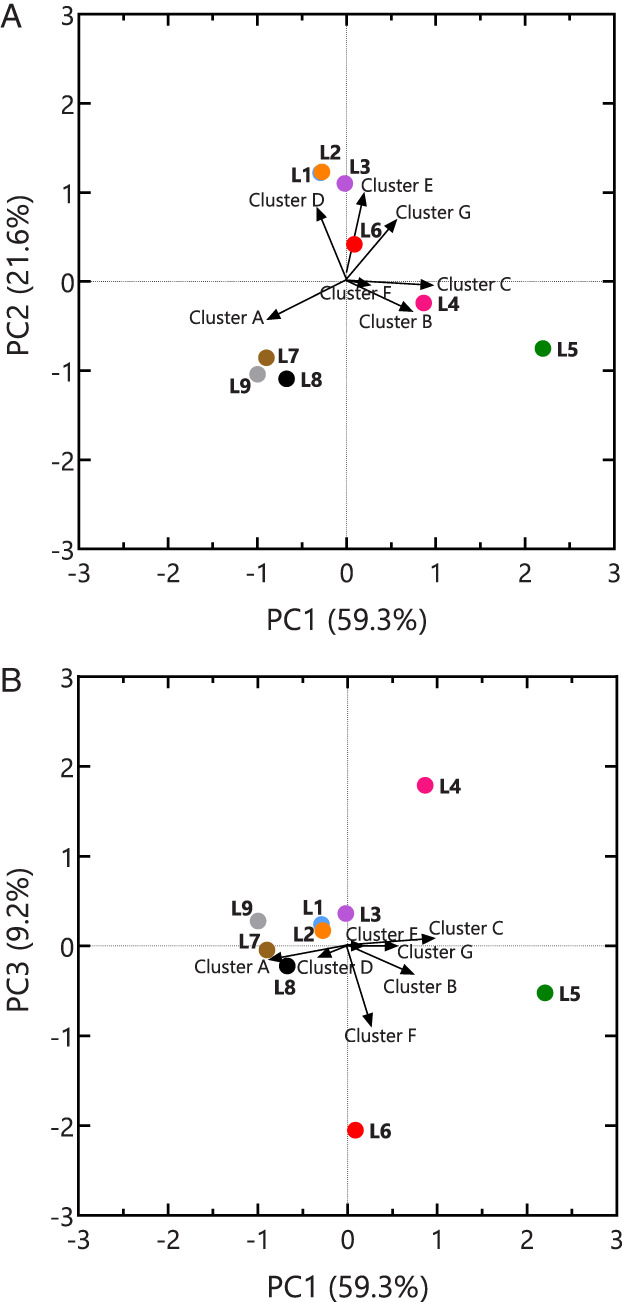
Biplot showing the (A) PC1 and PC2 axes, and (B) PC1 and PC3 axes of a principal component analysis of all measured compounds demonstrating the different groups among the locations (L1–L9) based on the contamination. One representative compound from Fig. 2 was chosen to represent the cluster's orientation. Values of the contamination cluster are multiplied with the standard deviation of the respective principal component. [Color figure can be viewed at wileyonlinelibrary.com]
Relationship between the microbial community and the chemical compounds
We identified the indigenous microbial community with 16S rRNA gene amplicon sequencing, which resulted in an average of 1099 OTUs per location, totalling to 6765 OTUs (Table S1 and Table S2). Alpha diversities (within sample diversity) were significantly lower in the contaminated locations compared to the control locations (Table S1). The five most relative abundant phyla were Proteobacteria, Acidobacteria, Bacteroidetes, Actinobacteria and Verrucomicrobia and ranged from 23.8% to 43.0%, 14.6% to 34.5%, 2.6% to 17.8%, 2.6% to 27.2%, and 2.4% to 10.2%, respectively (Fig. S3). 2.9% to 18.3% of the reads could not be classified at the phylum level. In general, no clear correlation between Proteobacteria classes and the measured compounds was observed (Fig. S4). L6 and L5 contained the most Betaproteobacteria followed by L8 and L9 (Fig. S5). The 20 Acidobacteria subgroups showed different correlation profiles (Fig. S4). The relative abundance of Gp18 positively correlated with all compounds from cluster B and all compounds from cluster C, except Ca and nitrate. Subgroups Gp4 and Gp17 positively correlated with several compounds from cluster C, while the abundance of Gp5 negatively correlated with compounds from cluster B (all except chloride) and cluster C. Verrucomicrobia correlated negatively with compounds from cluster C, mainly due to the Spartobacteria class. Similarly, Sphingobacteria within the Bacteroidetes also correlated negatively with compounds from clusters B and C (Fig. S4). Notably, unclassified bacteria positively correlated with all compounds from Cluster C, except nitrate and 210Pb (Fig. S4).
To reveal possible differences within the bacterial community structure, an unconstrained RC(M) analysis on the OTU level was performed (Hawinkel et al, 2019). This indicated clear differences in the bacterial community structure (Fig. 4A). Samples from a single location clustered closely together, indicating only little variation within each sample location. More variation was observed between the different sample locations. A gradual change was seen from locations L1 to L4, while L5 was more secluded. The bacterial community of location L6 resembled the closest to the control locations L7, L8 and L9.
Fig. 4.

A. The unconstrained RC(M) biplot shows differences in the microbial community. The eight OTUs are more abundant than average in the locations to which the arrow points, and less abundant in the opposite direction. The importance parameters ψ (1.1 for the x‐axis and 0.6 for the y‐axis) reflect the relative importance of the dimensions. B. The constrained RC(M) triplot shows the relation between the microbial communities and the locations (L1–L9), and the relation between the chemical parameters and the identified microorganisms (cluster A–F). The abundance of the OTUs increases in the direction of the arrow and decreases in the opposite direction. The importance parameters ψ (23.2 for the x‐axis and 11.1 for the y‐axis) reflect the relative importance of the dimensions. OTU25: Thiobacillus; OTU33: Bacteria_unclassified; OTU54: Betaproteobacteria_unclassified; OTU55: Pedobacter; OTU62: Burkholderiales_unclassified; OTU66: Gp2_unclassified; OTU72: Betaproteobacteria_unclassified; OTU118: Bacteria_unclassified; OTU128: Betaproteobacteria_unclassified; OTU135: Gp4_unclassified; OTU216: Myxococcales_unclassified. [Color figure can be viewed at wileyonlinelibrary.com]
Constrained RC(M) illustrated that the observed differences in the microbial community could be explained by the metadata (Fig. 4B). Overall, a similar distribution can be seen as in the PCA of the metadata (Fig. 3) and the unconstrained RCM (Fig. 4A). Locations L1–L3 as well as L7–L9 were similar in both bacterial communities and soil characteristics. Although the contamination profile of L6 was more similar to that of L1–L3, its microbial community seemed to resemble that of the control locations (Fig. 4A). Location L5 appeared to be more unique when taking both OTUs and metadata into account, with L4 being the most closely related.
OTU55, OTU66, OTU128, OTU216 and OTU268 explain most of the variance within the dataset (Fig. 4B). OTU268 and OTU216 were exclusively present in L5 and L6 for all three replicates (Table S2). OTU268, an unclassified bacterial OTU, correlated negatively with cluster A and positively with cluster B, cluster C and cluster F (Fig. S6). OTU216, member of the Myxococcales order, correlated with cluster B, cluster C (only 210Pb, moisture and phosphate) and cluster F. OTU55, belonging to the genus Pedobacter, correlated exclusively with cluster A and OTU66 (Acidobacteria subgroup Gp2) correlated with cluster D and Ti from cluster E. Lastly, OTU128, an unclassified Betaproteobacterium, was mainly present in L7, but did not correlate with any compound (Fig. S6).
Overall, the top 50 most explanatory OTUs belong to the five most abundant phyla (Proteobacteria, Acidobacteria, Bacteroidetes, Actinobacteria and Verrucomicrobia), Gemmatimonadetes, Chloroflexi and unclassified bacteria reads. OTU139 (unclassified Deltaproteobacteria), OTU129 (unclassified Betaproteobacteria), OTU135 (Acidobacteria Gp4) and OTU118 (unclassified bacteria) correlated with all compounds from Cluster B and with all compounds from cluster C, except Ca and nitrate. OTU136 (Acidobacteria Gp4), OTU18 (Acidobacteria Gp1), OTU71 (Sinobacteriaceae) and OTU33 (unclassified bacteria) positively correlated with several compounds from cluster C. Contrary, OTU131 (Chitinophagaceae), correlated negatively with several compounds of cluster C and with cluster G, except for potassium. A negative correlation with cluster G was also observed for OTU6 (Acidobacteria Gp2), OTU87 (unclassified Betaproteobacteria) and OTU102 (Roseiarcus) (Fig. S6). Furthermore, 12 OTUs correlated exclusively with ammonium (Fig. S6). Lastly, OTU25 (Thiobacillus) and OTU101 (Candidatus Koribacter) correlated exclusively with ammonium and sulphate (Fig. S6).
Functional changes within the microbial community
Total cell counts by flow cytometry and targeted Cd, Ni and Zn toxicity experiments were performed in an attempt to correlate differences in microbial biomass and the contamination level. No difference in total cell counts was observed between contaminated locations (L1–L6) and the control locations (L7–L9), ranging from 2.18 × 10⁶ to 5.27 × 10⁷ cells/g soil. Likewise, total viable count on R2A agar and a mineral salts medium (RM) supplemented with gluconate as sole carbon source were similar for both contaminated and control locations (Fig. S7). The latter was selected as it is highly suitable for screening metal resistance (Mergeay et al., 1985).
Three metals were selected to identify whether the microbial community has adapted to their chemically perturbed environment. Half of the maximum measured total concentration of Zn, Cd and Ni was supplemented to RM mineral salts agar medium. The results indicated that a larger fraction of the microbial communities from the contaminated locations was able to grow on 0.3 mM Cd2+ and 1 mM Ni2+, but not on 10 mM Zn2+ (Fig. 5).
Fig. 5.

Survival of the microbial community from the control (L7‐L9) (white) and contaminated (L1–L6) (grey) locations on RM agar supplemented with 0.3 mM Cd2+, 1 mM Ni2+ or 10 mM Zn2+ visualized in boxplots. The box has lines at the lower quartile, median and upper quartile values. The whiskers are lines extending from each end of the box with a maximum length of 1.5 times the interquartile range. Outliers are data with values beyond the end of the whiskers and plotted with a black circle. Values represent percent log10 survival compared to RM agar. Significant differences obtained with unequal variances T‐test between control and contaminated locations are shown with ** if p < 0.01 and *** if p < 0.001.
To investigate the effect of the contamination on nitrification, we first looked at correlations between nitrifying bacteria and the metal and radionuclide concentration profile. Interestingly, the abundance of known autotrophic nitrifying bacteria (predominantly Nitrosospira and Nitrospira, with only 3 reads of Nitrosomonas present in 1 out of 27 samples) resembled the contamination profile (Fig. 6B). A significant positive correlation with 20 out of the 21 compounds (except 210Pb) of cluster C was observed, with Cd showing the highest correlation (Table S3). In addition, the OTU composition of the nitrifying bacteria changed among the locations (Fig. 6B). To explicate the relationship between nitrification and metal contamination across our sample locations, we assessed the correlations between the relative abundances of nitrifying bacteria with ammonia, nitrite and nitrate levels (Fig. 6A and B). A clear relationship between the relative abundance of nitrifying bacteria and the differences in ammonium, nitrite and nitrate levels was only found for the control locations L7‐L9. Ammonium was below the detection limit in L8, while L7 and L9 contained 8.5 ± 1.2 and 2.5 ± 0.6 mg dissolved NH4 +/kg dry soil, respectively. Moreover, a low level of nitrite could only be measured in L7 and L9, and the nitrate level was higher in L8 compared to L7 and L9 (Fig. 6A). Consequently, ammonium could be oxidized faster to nitrate in L8 compared to L7 and L9. Indeed, these findings coincide with a higher abundance of Nitrosospira, a known genus involved in ammonium oxidation, and Nitrospira, a genus known to be involved in autotrophic nitrite oxidation, in L8 (1.16% ± 0.15% and 2.12 ± 0.49%) compared to L7 (0.11% ± 0.05% and 0.58% ± 0.04%) and L9 (0.08% ± 0.09% and 0.51% ± 0.08%) (Table S2).
Fig. 6.

A. Overview of the dissolved NH4 +, NO2 − and NO3 −levels in all locations. Values represent the average and standard deviation of 4–6 technical replicates. B. Relative abundance of the sum of all reads belonging to the dominant OTUs representing Nitrosospira and Nitrospira in all locations. Nitrosospira (OTU19) is shown as dotted bar, and Nitrospira is presented as full bar (OTU15) and blocked bar (OTU103). Data represent the average and standard deviation of three biological triplicates.
The relationship between N compounds and nitrifying microorganisms was less clear for the contaminated samples. Ammonium was only detected in L5 and L6. Nitrite was not detected in the contaminated locations, except in L2. Nitrate levels were the highest in L4 and L5, and those of L1, L2, L3 and L6 were similar to each other (Fig. 6A). The build‐up of ammonium in L6 could be explained by the low abundance of Nitrosospira (0.27% ± 0.19%), similar to that observed for L7 and L9. However, the abundance of Nitrosospira is the highest in L5 (3.48% ± 0.71%), where the ammonium level is similar to that of the control site L7 (Fig. 6).
Discussion
Relationship between the microbial community and the chemical compounds
Areas of the Grote Nete river basin (Belgium) are contaminated by historical discharges from nuclear industries and from the phosphate industry. This resulted in a unique contamination complexity of natural and artificial radionuclides (238U, 232Th, 228Th, 210Pb, 226Ra, 228Ra, 60Co, 137Cs and 241Am), metals (Co, Ni, Cu, Zn, As, Cd, Hg, Pb and Cr) and other ions (e.g. NO3, NO2 −, NH4 +, PO4 3−, SO4 2−, Ca2+, Cl−) in areas prone to flooding (because of acute flooding and tidal movement) (Paridaens and Vanmarcke, 2001; FANC, 2019). We sampled eight locations (L1–L8) with varying contamination levels and one adjacent unpolluted location (L9) to investigate the impact of this long‐term contamination on the residing microbial community. Locations L1–L6 were clearly contaminated, L5 was a contamination hot spot, while L7, L8 and L9 can be seen as control locations (Figs 1 and 3).
Taxonomic profiling indicated a high number of OTUs in each sample as can be expected for soil bacterial communities (Torsvik et al., 1996). Moreover, the five most relative abundant phyla of this study (Proteobacteria, Acidobacteria, Bacteroidetes, Actinobacteria and Verrucomicrobia) are typically observed in soil (Janssen, 2006; Gołebiewski et al., 2014; Li et al., 2017). The significant co‐contamination of metals and radionuclides could have a synergistic toxic impact on the indigenous microbial community affecting diversity and richness. This could explain the lower alpha diversity in the contaminated locations (L1–L6) compared to the control locations (L7–L9) (Table S1), contrary to several studies where metal contamination did not affect bacterial diversity and evenness (Azarbad et al., 2015; Sitte et al., 2015; Li et al., 2017; Beattie et al., 2018).
The community structure varied among the locations and was defined by the chemical parameters (Fig. 4b). Locations L5 and L4 contain the first and second highest levels of most metals and radionuclides, respectively, and were the most unique when taken into account both OTUs and metadata. This could indicate that the microbial community was affected by the contamination level. The ammonium level was the highest in L6 and 12 out of the 50 most explanatory OTUs correlated exclusively with ammonium (cluster F) (Fig. 1 and Fig. S6), suggesting an important influence of ammonium on the microbial community. However, if the ammonium level was solely responsible for the observed differences, L5 should cluster with L7 as levels were similar in both locations (Fig. S2). Metal and radionuclide levels in L6 were at least in the range of L1–L3, except for Co and Zn (Fig. 1), suggesting that Zn and Co could be important drivers in shaping the microbial community. Nonetheless, it remains difficult to find a causal effect due to a single compound since a lot of co‐correlation was observed among the chemical parameters. The synergistic effects of metals on the bacterial community can be more pronounced than those of the single metals (Song et al., 2018). Moreover, the bioavailability of the different compounds could differ among the sample locations. In general, the bioavailability of different metals and radionuclides depends strongly on their speciation, the local geochemistry, soil solution and the soil microbiome. A complex interplay between abiotic and biotic reactions, affected by the physico‐chemical parameters in the soil (pH, Eh, organic matter type and content) and the soil microbiome control the soil‐solution equilibrium and bioavailability of each metal and radionuclide (Tack, 2010). Microorganisms can directly and/or in concertation with the physico‐chemical soil parameters influence metal and radionuclide mobility, toxicity and distribution. Key processes are reduction, uptake and accumulation by cells, biosorption, complexation with proteins, polysaccharides and microbial biomolecules, and biomineralization with phosphates and carbonates (Groudev et al., 2001; Lloyd and Lovley, 2001; Lloyd, 2003; Ruggiero et al., 2005).
Unclassified bacteria were highly present and positively correlated with all compounds from cluster C, except for nitrate and 210Pb (Fig. S4). This could be due to the fact that these mixed polluted environments are not well characterized. From the classified reads, several of the most explanatory OTUs positively correlated with the contaminants. OTU129, an unclassified Betaproteobacteria positively correlated with cluster B and 14 out of 21 compounds from cluster C. However, in general, no clear correlation of the Betaproteobacteria class was found (Fig. S4) although this class has been reported to be more abundant under metal contamination (Jacquiod et al., 2018). This could be explained by the presence of 195 OTUs that correspond to unclassified Betaproteobacteria and exhibit different abundance profiles (Fig. S3).
Acidobacteria, suggested to be metabolically diverse like Proteobacteria (Kielak et al., 2016), are often associated with a slightly acidic pH (Kielak et al., 2016), which could explain their high abundance in this meadow. Of the most explanatory OTUs, OTU135 and OTU136 (subgroup Gp4) were positively correlated with compounds from cluster C. In general, the relative abundance of Gp17 correlated positively with 12 compounds from cluster C. Gp18 correlated positively with cluster B and cluster C (except Ca and nitrate), while Gp5 correlated negatively with the cluster B (except chloride) and 6 compounds from cluster C (Fig. S4). Gp17 was also more abundant in soils with higher multi‐metal contamination as compared to lower (Hg, As, Co, Cd, Cr, Ni, Pb, Cu, Mn and Zn), indicating a possible general trend for this subgroup to be metal resistant (Yin et al., 2015). Metal resistance genes have been found in this phylum (Thomas et al., 2020), but further studies are necessary to identify their role in metal interactions. Nevertheless, these results indicate that this phylum is clearly diverse in their response to environmental factors.
The higher abundance of several OTUs in the most contaminated locations could indicate that resistance mechanisms are more prevalent in these locations. Furthermore, possible indirect mechanisms could also be at play. OTU216, member of the Myxococcales order, was exclusively present in L5 and L6 (Table S2) and showed the strongest correlation with sulphate (cluster B). This order has been reported as potentially sulphate‐reducing bacteria (Reese et al., 2014), resulting in the production of HS−. On its turn, HS− can result in the formation of insoluble metal‐sulphide complexes of dissolved metals such as Cd2+, U6+, Ni2+ and Co2+ (Yin et al., 2019). On the other hand, OTU25, a sulphur‐oxidizing betaproteobacterium Thiobacillus is also mainly present in L5 and L6. Sulphur oxidation can result in leaching of metal‐sulphide complexes (Schippers and Sand, 1999). Interplay between these two sulphur‐based mechanisms and the physico‐chemical parameters could lead to different equilibria in the different locations.
Besides an enrichment of several groups of bacteria in the most contaminated locations, several OTUs are absent in these locations. OTU131, an unclassified Chitinophagaceae, correlated negatively with compounds from cluster C and is absent in L4 and L5 (Fig. S6, Table S2). Members of the Chitinophagaceae family have previously been suggested as indicators of environmental perturbations (Hermans et al., 2017). The Sphingobacteria class was negatively correlated with compounds from clusters B and C and has been shown to be less abundant in more contaminated soils (Yin et al., 2015). Furthermore, OTU102 (Roseiarcus) was exclusively present in L6–L9 (Table S2) and correlated negatively with potassium, S and TOC (Fig. S6). The role of this genus is still largely unknown and only one strain has been characterized (Kulichevskaya et al., 2014). Putatively, OTU102 is highly sensitive to Co and Zn, explaining its absence in L1–L5. Similarly, OTU213 of the Verrucomicrobia class Spartobacteria was solely found in L6–L9 and significantly correlated with ammonium (Fig. S6). Overall, Spartobacteria correlated negatively with compounds from cluster C (Fig. S2) and have recently been found sensitive to toxic elements in antimony mining sites (Deng et al., 2020). This could explain the negative correlation and complete absence of some of the OTUs in the contaminated locations.
Functional changes within the microbial community
A reduction in microbial biomass has been observed in metal‐contaminated environments (Oliveira and Pampulha, 2006; Zhang et al., 2016; Song et al., 2018), however, the correlation between microbial biomass and metal contamination is not always straightforward (Gillan et al., 2005; Rousk and Rousk, 2018). In this study, no difference in total and viable cell counts were observed between contaminated locations (L1–L6) and the control locations (L7–L9).
Three metals, Zn2+, Cd2+ and Ni2+, were selected to identify whether the microbial community has adapted to their chemically perturbed environment. Zn2+ was chosen as concentrations were the highest of all metals and radionuclides and it was identified as one of the possible drivers explaining the observed differences in the microbial community. Cd2+ was selected as it has been well‐documented to be highly toxic for living organisms (Zhang and Reynolds, 2019) and Ni2+ was chosen as no difference in Ni levels were observed between contaminated locations L2 and L6 and control locations L7–L9 (Fig. 1). The survival of microbial communities from the contaminated locations on 0.3 mM Cd2+ and 1mM Ni2+ was higher compared to that of the control locations but no difference was observed on 10 mM Zn2+ (Fig. 5). Although only a few singular compounds were selected, these results suggest that the microbial community from the contaminated locations is adapted to the in situ conditions, which other studies also showed in similar experiments (Turpeinen et al., 2004; Margesin et al., 2011).
These metals were discharged by phosphate industry, which could explain why soluble phosphate and total phosphor correlated together with the metal and radionuclide contaminants (Fig. 2). Furthermore, the presence of phosphate in the soil groundwater could shift bacterial resistance mechanisms more towards intra‐ and/or extracellular phosphate mediated complexation resulting in the precipitation and immobilization of metals and radionuclides. Although phosphate mediated complexation has been shown for Cd2+, Zn2+ and several other metals and radionuclides (Basnakova et al., 1998; Andrade et al., 2004; Renninger et al., 2004; Zeng et al., 2020), the best known Ni2+ resistance mechanism is efflux‐mediated resistance (López‐Maury et al., 2002; Nies, 2003; Mergeay and Van Houdt, 2015). Nevertheless, our experimental setup did not allow to interpret the individual effect of total phosphor or phosphate on the microbial community and thus no clear impact was observed.
To further explore the previous observations involving microbial community structure, functionality and metal/radionuclide toxicity, we focused on nitrification, a key soil ecosystem process that is widely reported to be susceptible to metal toxicity (Rother et al., 1982). Overall, although we observed a correlation between the relative abundance of nitrifying bacteria and metal contamination, no significant correlations could be made between nitrifying bacteria and the levels of ammonium, nitrate and nitrite in the contaminated locations, in contrast to the control locations. The composition of nitrifying bacteria changed across locations, therefore an adaptation in activity could have followed. This was shown previously by Mertens et al. (2009), who demonstrated that a change in OTU composition of nitrifying bacteria was responsible for restoration of nitrification after Zn contamination. This suggests that nitrification was affected by the contamination, however, it is difficult to elucidate the detailed ongoing mechanism. More experimental data are necessary to corroborate the results and to confirm or refute hypotheses.
Conclusion
Soil contamination with metals and radionuclides is an important problem and urges efficient remediation techniques. Bioremediation is a promising cost and ecofriendly strategy to be used in situ but requires the presence of metal‐resistant microbial communities. Understanding how metal and radionuclide toxicity influences ecosystem health necessitates studies on the microbial ecology of such contaminated sites. This study indicates that long‐term metal and radionuclide contamination affects the microbial community structure and functionality and provides important fundamental insights into microbial community dynamics in co‐metal‐radionuclide contaminated sites. The strong correlation between some OTUs and specific soil parameters could imply their use as bioindicators for changing conditions. Furthermore, our approach could facilitate identifying sites for targeted isolations of adapted strains towards bioremediation applications.
Experimental procedures
Sample collection
We organized one sampling campaign on June 7, 2018. We targeted to have samples with a contamination gradient, hence we sampled eight locations (L1–L8) along a transect to the Grote Nete river with L1 and L8 being the closest and furthest, respectively. In addition, one uncontaminated location (L9) was sampled approximately at the same distance from the river as L8 but located in a large uncontaminated area within the same field (based on aerial surveys of gamma radiation (Paridaens et al., 2016)) (Fig. S1B). We measured the external gamma radiation with a dose rate meter (Automess Scintillator Probe 6150AD‐b) (mainly originating from the radionuclide 226Ra) in the field during sampling to have a first indication of the contamination level and to assure that we sampled various contaminated and uncontaminated locations.
For microbiological analysis, three samples were taken within a 40 × 40 cm square at each location (Fig. S1C). To this end, the upper 10 cm of the soil was taken after removal of the root mat. To avoid external contamination, all sampling equipment was sterilized by autoclaving. In addition, cross‐contamination between samples was prevented by using different samplers at each location. All samples were sealed and stored in the dark at 4 °C.
For all chemical analyses, one additional sample was taken at each location (in the same 40 × 40 cm square), including the soil around and in between the three samples. These samples were air‐dried in a greenhouse and 2 mm sieved before analyses.
Analyses of the soil chemistry
General soil characteristics such as pH, moisture content and the total organic and total inorganic carbon were determined for each sampling point. Furthermore, we analysed the total and dissolved concentration of several major ions and the total concentrations of multiple radionuclides and metals. Detailed protocols of the different analyses can be found in Supporting Information. In brief, the concentrations of the radionuclides 137Cs, 210Pb, 226Ra, 228Ra, 60Co, 241Am, 238U, 228Th, and 232Th were determined at SCK CEN LRM accredited conform to ISO‐17025. Element analysis (Na, Mg, Al, Si, P, K, Ca, Ti, Cr, Mn, Fe As, Cd, Zn, Pb, Co, Ni, Hg, Cu, Cl and S) was carried out by a certified lab of VITO (Mol, Belgium).
Cations (Li+, Na+, NH4 +, K+, Mg2+, and Ca2+) in soil solution were measured with a Dionex ICS2500 ion chromatography system packed with an IonPac CG12A guard column and IonPac CS12A analytical column. Anions (NO3 −, F−, Cl−, NO2 −, SO4 2− and PO4 3−) were analysed with an IonPac AS11‐HS anion exchange column.
To reveal possible correlations between the different chemical parameters, a Pearson‐correlation‐based clustered heatmap of the metadata was created with the R package pheatmap (version 1.0.12) (Kolde, 2019).
To illustrate similarities among the locations, a principal component analysis was performed on normalized metadata (average 0, standard deviation 1) using the prcomp function in R (version 3.6.2) (R Core Team, 2019). Coordinates of the locations were divided by the standard deviation of the respective principal component and extracted for visualization. One representative chemical parameter of each cluster identified based on Pearson correlations was used to visualize the orientation of the clusters. The result of the PCA analysis was used for the detailed identification of contaminated and control locations. The latter were identified as those similar in chemical composition as L9.
Analysis of the soil microbiome
DNA extraction
Five grams of soil were used to extract DNA with the DNeasy PowerMax Soil Kit (Qiagen, The Netherlands) according to the manufacturer's protocol. DNA was extracted within 14 days of storage on 4 °C, which is not expected to influence the results (Lauber et al., 2010). In addition, to further exclude possible storage effects, DNA of the different replicates was extracted on various days. A negative control (i.e. an empty tube) was included to identify possible contaminations originating from the extraction kit or other downstream applications. All samples were subjected to RNase A treatment (1 U/100 μl) (Qiagen, The Netherlands) and extensively purified as soil samples are known to contain several PCR inhibitors and thus could interfere with 16S rRNA gene sequencing (Schrader et al., 2012). Details regarding the purification steps are given in Supporting Information. Finally, the concentration and integrity of the DNA was analysed with the Quantifluor dsDNA sample kit (Promega, the Netherlands) and gel electrophoresis, respectively.
16S rRNA gene sequencing
The verified DNA was sent to Baseclear (Leiden, the Netherlands) for high‐throughput amplicon sequencing of the V3‐V4 hypervariable region of the 16S rRNA gene with the Illumina MiSeq platform according to the manufacturer's guidelines. Data were processed using the OCToPUS pipeline (Mysara et al., 2017), which consists of the following steps: quality filtering using HMMER, merging reads using the make.contigs command from mothur, alignment and filtering of the merged reads following the Standard Operating Protocol (SOP) procedure (v.1.39.0) as described by the authors of mothur, error correction using IPED (Mysara et al., 2016), chimera identification using CATCh (Mysara et al., 2015), and OTU clustering using UPARSE (Edgar, 2013). The negative control (i.e. DNA extraction from the empty tube) only had 847 reads and contained eight OTUs. However, none of these were present in all nine locations, indicating that a significant contamination originating from the DNA extraction kit was absent (Fig. S8). Samples were subsampled to a depth of 10,198 reads (resembling smallest sample's depth), which adequately represented the bacterial diversity in the samples (Fig. S9). The datasets generated and analysed during this study are available in the NCBI Sequence Read Archive (SRA) repository (PRJNA630593).
Alpha diversity indices (sobs, Chao1, and Shannon) were calculated using the mothur summary.single command index.
The relations between the microbial communities, the sample locations and the chemical parameters were analysed with both the unconstrained and the constrained RC(M) method, using the RCM R package (version 1.1.0.) (Hawinkel et al., 2019). Both methods are exploratory ordination methods, which in contrast to other ordination methods use OTU counts instead of OTU frequencies. The unconstrained RC(M) method quantifies the deviation of a given OTU in a sample from all samples, while ignoring all other sources of information, such as the level of all measured compounds. The constrained RC(M) method allows to visualize the variability of the OTU counts that can be explained by the changes in the chemical parameters at every location. To this end, one representative chemical parameter of each cluster based on Pearson correlations (section “Functional changes within the microbial community”) was chosen. The RC(M) placed the three biological replicates on each other since only one measurement was performed to obtain the metadata. Both methods used 330 of the most variable OTUs (variance larger than 75).
Laboratory experiments
Two grams of soil sample were dissolved in 18 ml 10 mM MgSO4, vertically rotated for 2 h on 4 °C followed by 1 h on 4 °C standing upright for phase separation. The upper phase was then taken by gentle pipetting to achieve a representative subsample of the actual soil microbial community.
First, we compared the biomass of these subsamples between contaminated and control locations by estimating the total number of bacteria with flow cytometry (Supporting Information) (Props et al., 2016).
Afterwards, we compared the viable count between control and contaminated locations by plating serial tenfold dilutions on R2A medium (Reasoner and Geldreich, 1985) and a mineral salts RM Noble Agar (1.5%, Sigma Aldrich, Belgium) medium supplemented with 0.2% (w/v) gluconate as sole carbon source (Mergeay et al., 1985). Finally, metal resistance was compared between communities originating from contaminated and those from control locations by plating serial tenfold dilutions on RM agar supplemented with one of three key contaminants: 10 mM ZnSO4, 1 mM NiCl2 or 0.3 mM CdCl2. Plates were incubated aerobically at 30°C in dark conditions and colony forming units were counted after 7 days. The log10 of the viable count on RM agar supplemented with metals divided by the log10 of the viable count on RM agar medium was used to calculate survival on the specific metals.
Statistical analysis
Unequal variances T‐test was used to test statistical differences between contaminated and control locations. The Mann–Whitney U test was used if normality could not be assumed based on the Shapiro–Wilk test. Pearson correlations between biological data and the metadata were calculated with R package Hmisc (version 4.3‐0) (Harrell Jr et al., 2019). A significance level of 0.05 was used throughout the analyses. All analyses were performed with R (version 3.6.2) (R Core Team, 2019).
Supporting information
Appendix S1: Supporting Information.
Figure S1 A. Visualization of the origin of contamination from two distinct industries. Nuclear industry discharged in the Molse Nete (red line) and phosphate industry discharged in the Grote Laak (green line). Both rivers flow downstream in the Grote Nete river (blue line) and contaminated river banks in the black circle. The map originated from Geopunt Vlaanderen and was adapted based on information from the Federal Agency for Nuclear Control (FANC). B. Schematic representation of the sample locations. Locations L1–L6 were located in the meadow, L7 was on the border of this meadow with a mown field where L8 and L9 were situated. The map was adapted from Google Maps. C. Illustration of the sample method in the sterile manner.
Fig. S2: Overview of the general soil characteristics, major ions and total element concentrations measured on the different locations (L1–L9). Moisture, TOC and most total element concentrations are displayed in % (w/w). All ions and total S are presented in mg/kg. Error bars for pH, Moisture and all ions represent variation on technical replicates. Error bars of total element concentrations represent measurement uncertainty. Values below detection limit are indicated with <DL. The detection limit is shown as a dotted line.
Fig. S3: Overview of the relative abundance of the top 10 most abundant phyla after subsampling for all 27 samples. Data are presented in relative abundance (%). A legend is provided for the different phyla.
Fig. S4: Pearson correlation matrix between the relative abundance of the five most abundant phyla and their classes and unclassified Bacteria. Phyla and classes are listed according to decreasing relative abundance. Significant Pearson correlations (p < 0.05) are coloured from red (positive) to blue (negative). Non‐significant Pearson correlations are shown in grey.
Fig. S5: Overview of the relative abundance of the top 15 most abundant classes after subsampling for all 27 samples. Data are presented in relative abundance (%). A legend is provided for the different classes.
Fig. S6: Pearson correlation matrix between the relative abundance of the 50 most explanatory OTUs and the metadata. Significant Pearson correlations (p < 0.05) are coloured from red (positive) to blue (negative). Non‐significant Pearson correlations are shown in grey.
Fig. S7: Boxplot showing the total cell count in control samples (L7–9) (white) compared to contaminated soil samples (L1–6) (grey) determined with Flow Cytometry (left panel), viable count on mineral salts RM agar medium (middle panel) and on R2A agar (right panel). The box has lines at the lower quartile, median and upper quartile values. The whiskers are lines extending from each end of the box to show the extent of the rest of the data, with a maximum length of 1.5 times the interquartile range. Values represent the log10 of cells/g soil.
Fig. S8: Comparison of the OTUs found in the negative (empty tube) control (NC) across all samples (L1.1–L9.3). The total amount of reads was 847 for the NC while all other samples contained >10,000 reads. The number of reads is presented on a 2‐segment linear scale ranging from 0 to 1000 and 8000 to 22,000 reads.
Fig. S9: Rarefaction curves of all samples showing the number of OTUs in function of the number of reads, subsampling was performed on 10,198 reads (dotted line).
Table S1 Overview of the 16S read processing in number of raw and high quality reads, subsampling depth and alpha diversities.
Table S2: Taxonomy of all OTUs and their number of high quality reads for all 27 samples after subsampling.
Table S3: Overview of the significant (p < 0.05) Pearson correlations between the sum of the relative abundance of all nitrification OTUs and the metadata. The values shown are the Pearson correlation coefficients (r).
Acknowledgements
The gamma spectrometry was performed within the budget for radiological surveillance of the Federal Agency for Nuclear Control (FANC). The authors want to thank Peter Thomas for performing TIC/TOC analyses. This project was funded by SCK CEN through the PhD project of Tom Rogiers.
References
- Aminov, R.I. (2011) Horizontal gene exchange in environmental microbiota. Front Microbiol 2: 1–19. [DOI] [PMC free article] [PubMed] [Google Scholar]
- Andrade, L. , Keim, C.N. , Farina, M. , and Pfeiffer, W.C. (2004) Zinc detoxification by a cyanobacterium from a metal contaminated bay in Brazil. Brazilian Arch Biol Technol 47: 147–152. [Google Scholar]
- Azarbad, H. , Niklinska, M. , Laskowski, R. , van Straalen, N.M. , van Gestel, C.A.M. , Zhou, J. , et al. (2015) Microbial community composition and functions are resilient to metal pollution along two forest soil. FEMS Microbiol Ecol 91: 1–11. [DOI] [PubMed] [Google Scholar]
- Basnakova, G. , Stephens, E.R. , Thaller, M.C. , Rossolini, G.M. , and Macaskie, L.E. (1998) The use of Escherichia coli bearing a phoN gene for the removal of uranium and nickel from aqueous flows. Appl Microbiol Biotechnol 50: 266–272. [DOI] [PubMed] [Google Scholar]
- Beattie, R.E. , Henke, W. , Campa, M.F. , Hazen, T.C. , McAliley, L.R. , and Campbell, J.H. (2018) Variation in microbial community structure correlates with heavy‐metal contamination in soils decades after mining ceased. Soil Biol Biochem 126: 57–63. [Google Scholar]
- Boteva, S. , Radeva, G. , Traykov, I. , and Kenarova, A. (2016) Effects of long‐term radionuclide and heavy metal contamination on the activity of microbial communities, inhabiting uranium mining impacted soils. Environ Sci Pollut Res 23: 5644–5653. [DOI] [PubMed] [Google Scholar]
- Bronick, C.J. , and Lal, R. (2005) Soil structure and management: a review. Geoderma 124: 3–22. [Google Scholar]
- Chen, G. , Zhu, H. , and Zhang, Y. (2003) Soil microbial activities and carbon and nitrogen fixation. Res Microbiol 154: 393–398. [DOI] [PubMed] [Google Scholar]
- Deng, R. , Tang, Z. , Hou, B. , Ren, B. , Wang, Z. , Zhu, C. , et al. (2020) Microbial diversity in soils from antimony mining sites: geochemical control promotes species enrichment. Environ Chem Lett 18: 911–922. [Google Scholar]
- Edgar, R.C. (2013) UPARSE: highly accurate OTU sequences from microbial amplicon reads. Nat Methods 10: 996–998. [DOI] [PubMed] [Google Scholar]
- Ellis, R.J. , Morgan, P. , Weightman, A.J. , and Fry, J.C. (2003) Cultivation‐dependent and ‐independent approaches for determining bacterial diversity in heavy‐metal‐contaminated soil. Appl Environ Microbiol 69: 3223–3230. [DOI] [PMC free article] [PubMed] [Google Scholar]
- FANC (2020) NORM‐industries. https://fanc.fgov.be/nl/professionelen/natuurlijke-radioactiviteit/norm-industrieen.
- FANC (2019) Radioactieve verontreiniging in het Netebekken. https://fanc.fgov.be/nl/informatiedossiers/radioactiviteit‐het‐leefmilieu/verontreinigde‐sites/radioactieve‐verontreiniging.
- Frostegard, A. , Tunlid, A. , and Baath, E. (1993) Phospholipid fatty acid composition, biomass, and activity of microbial communities from two soil types experimentally exposed to different heavy metals. Appl Environ Microbiol 59: 3605–3617. [DOI] [PMC free article] [PubMed] [Google Scholar]
- Gillan, D.C. , Danis, B. , Pernet, P. , Joly, G. , and Dubois, P. (2005) Structure of sediment‐associated microbial communities along a heavy‐metal contamination gradient in the marine environment. Appl Environ Microbiol 71: 679–690. [DOI] [PMC free article] [PubMed] [Google Scholar]
- Gołebiewski, M. , Deja‐Sikora, E. , Cichosz, M. , Tretyn, A. , and Wróbel, B. (2014) 16S rDNA pyrosequencing analysis of bacterial community in heavy metals polluted soils. Microb Ecol 67: 635–647. [DOI] [PMC free article] [PubMed] [Google Scholar]
- Groudev, S.N. , Spasova, I.I. , and Georgiev, P.S. (2001) In situ bioremediation of soils contaminated with radioactive elements and toxic heavy metals. Int J Miner Process 62: 301–308. [Google Scholar]
- Guo, H. , Nasir, M. , Lv, J. , Dai, Y. , and Gao, J. (2017) Understanding the variation of microbial community in heavy metals contaminated soil using high throughput sequencing. Ecotoxicol Environ Saf 144: 300–306. [DOI] [PubMed] [Google Scholar]
- Harrell Jr, F.E. , Dupont, C. , and Many, O. (2019) Hmisc: Harrell Miscellaneous. R package version 4.3‐0. https://CRAN.R-project.org/package=Hmisc.
- Hawinkel, S. , Kerckhof, F.M. , Bijnens, L. , and Thas, O. (2019) RCM: a unified framework for unconstrained and constrained ordination of microbiome read count data. PLoS One 14: 1–20. [DOI] [PMC free article] [PubMed] [Google Scholar]
- Hayat, R. , Ali, S. , Amara, U. , Rabia, K. , and Iftikhar, A. (2010) Soil beneficial bacteria and their role in plant growth promotion: a review. Ann Microbiol 60: 579–598. [Google Scholar]
- Hermans, S.M. , Buckley, H.L. , Case, B.S. , Curran‐cournane, F. , Taylor, M. , and Lear, G. (2017) Bacteria as emerging indicators of soil condition. Appl Environ Microbiol 83: 1–13. [DOI] [PMC free article] [PubMed] [Google Scholar]
- IAEA (2003) Extent of environmental contamination by NORM and technological options for mitigation.
- Ibrahim, S.A. , and Whicker, F.W. (1987) Plant accumulation and plant/soil concentration ratios of 210Pb and 210Po at various sites within a uranium mining and miling operation. Environ Exp Bot 27: 203–2013. [Google Scholar]
- Jacquiod, S. , Cyriaque, V. , Riber, L. , Al‐soud, W.A. , Gillan, D.C. , Wattiez, R. , and Sørensen, S.J. (2018) Long‐term industrial metal contamination unexpectedly shaped diversity and activity response of sediment microbiome. J Hazard Mater 344: 299–307. [DOI] [PubMed] [Google Scholar]
- Janssen, P.H. (2006) Identifying the dominant soil bacterial taxa in libraries of 16S rRNA and 16S rRNA genes. Appl Environ Microbiol 72: 1719–1728. [DOI] [PMC free article] [PubMed] [Google Scholar]
- Khalid, S. , Shahid, M. , Niazi, N.K. , Murtaza, B. , Bibi, I. , and Dumat, C. (2017) A comparison of technologies for remediation of heavy metal contaminated soils. J Geochemical Explor 182: 247–268. [Google Scholar]
- Kielak, A.M. , Barreto, C.C. , Kowalchuk, G.A. , van Veen, J.A. , and Kuramae, E.E. (2016) The ecology of Acidobacteria: moving beyond genes and genomes. Front Microbiol 7: 1–16. [DOI] [PMC free article] [PubMed] [Google Scholar]
- Kindler, R. , Miltner, A. , Thullner, M. , Richnow, H.H. , and Kästner, M. (2009) Fate of bacterial biomass derived fatty acids in soil and their contribution to soil organic matter. Org Geochem 40: 29–37. [Google Scholar]
- Kolde, R. (2019) Pheatmap: pretty Heatmaps. R package version 1.0.12. 1–8.
- Kowalchuk, G.A. , and Stephen, J.R. (2001) Ammonia‐Oxidizing Bacteria: A Model for Molecular Microbial Ecology. Annu Rev Microbiol 55: 485–529. [DOI] [PubMed] [Google Scholar]
- Kulichevskaya, I.S. , Danilova, O.V. , Tereshina, V.M. , Kevbrin, V.V. , and Dedysh, S.N. (2014) Descriptions of Roseiarcus fermentans gen. nov., sp. nov., a bacteriochlorophyll a‐containing fermentative bacterium related phylogenetically to alphaproteobacterial methanotrophs, and of the family Roseiarcaceae fam. nov. Int J Syst Evol Microbiol 64: 2558–2565. [DOI] [PubMed] [Google Scholar]
- Lauber, C.L. , Zhou, N. , Gordon, J.I. , Knight, R. , and Fierer, N. (2010) Effect of storage conditions on the assessment of bacterial community structure in soil and human‐associated samples. FEMS Microbiol Lett 307: 80–86. [DOI] [PMC free article] [PubMed] [Google Scholar]
- Li, X. , Meng, D. , Li, J. , Yin, H. , Liu, H. , Liu, X. , et al. (2017) Response of soil microbial communities and microbial interactions to long‐term heavy metal contamination. Environ Pollut 231: 908–917. [DOI] [PubMed] [Google Scholar]
- Licour, C. , Tondeur, F. , Gerardy, I. , Alaoui, N.M. , Dubois, N. , Perreaux, R. , et al. (2017) 226Ra, 222Rn and permeability of Belgian soils in relation with indoor radon risk. Radiat Prot Dosimetry 177: 168–172. [DOI] [PubMed] [Google Scholar]
- Lloyd, J.R. (2003) Microbial reduction of metals and radionuclides. FEMS Microbiol Rev 27: 411–425. [DOI] [PubMed] [Google Scholar]
- Lloyd, J.R. , and Lovley, D.R. (2001) Microbial detoxification of metals and radionuclides. Curr Opin Biotechnol 12: 248–253. [DOI] [PubMed] [Google Scholar]
- López‐Maury, L. , García‐Domínguez, M. , Florencio, F.J. , and Reyes, J.C. (2002) A two‐component signal transduction system involved in nickel sensing in the cyanobacterium Synechocystis sp. PCC 6803. Mol Microbiol 43: 247–256. [DOI] [PubMed] [Google Scholar]
- Loska, K. , Wiechulła, D. , and Korus, I. (2004) Metal contamination of farming soils affected by industry. Environ Int 30: 159–165. [DOI] [PubMed] [Google Scholar]
- Madsen, E.L. (2011) Microorganisms and their roles in fundamental biogeochemical cycles. Curr Opin Biotechnol 22: 456–464. [DOI] [PubMed] [Google Scholar]
- Margesin, R. , Płaza, G.A. , and Kasenbacher, S. (2011) Characterization of bacterial communities at heavy‐metal‐contaminated sites. Chemosphere 82: 1583–1588. [DOI] [PubMed] [Google Scholar]
- Martinez, R.J. , Wang, Y. , Raimondo, M.A. , Coombs, J.M. , Barkay, T. , and Sobecky, P.A. (2006) Horizontal gene transfer of PIB‐type ATPases among bacteria isolated from subsurface soils. Appl Environ Microbiol 72: 3111–3118. [DOI] [PMC free article] [PubMed] [Google Scholar]
- Mergeay, M. and Van Houdt, R. (2015) Metal response in cupriavidus metallidurans. Volume I, From habitats to genes and proteins. 10.1007/978-3-319-20594-6 [DOI]
- Mergeay, M. , Nies, D.H. , Schlegel, H.G. , Gerits, J. , Charles, P. , and Van Gijsegem, F. (1985) Alcaligenes eutrophus CH34 is a facultative chemolithotroph with plasmid‐bound resistance to heavy metals. J Bacteriol 162: 328–334. [DOI] [PMC free article] [PubMed] [Google Scholar]
- Mertens, J. , Broos, K. , Wakelin, S.A. , Kowalchuk, G.A. , Springael, D. , and Smolders, E. (2009) Bacteria, not archaea, restore nitrification in a zinc‐contaminated soil. ISME J 3: 916–923. [DOI] [PubMed] [Google Scholar]
- Miltner, A. , Bombach, P. , Schmidt‐Brücken, B. , and Kästner, M. (2012) SOM genesis: microbial biomass as a significant source. Biogeochemistry 111: 41–55. [Google Scholar]
- Mysara, M. , Leys, N. , Raes, J. , and Monsieurs, P. (2016) IPED: a highly efficient denoising tool for Illumina MiSeq paired‐end 16S rRNA gene amplicon sequencing data. BMC Bioinformatics 17: 1–11. [DOI] [PMC free article] [PubMed] [Google Scholar]
- Mysara, M. , Njima, M. , Leys, N. , Raes, J. , and Monsieurs, P. (2017) From reads to operational taxonomic units: an ensemble processing pipeline for MiSeq amplicon sequencing data. Gigascience 6: 1–10. [DOI] [PMC free article] [PubMed] [Google Scholar]
- Mysara, M. , Saeys, Y. , Leys, N. , Raes, J. , and Monsieurs, P. (2015) CATCh, an ensemble classifier for chimera detection in 16s rRNA sequencing studies. Appl Environ Microbiol 81: 1573–1584. [DOI] [PMC free article] [PubMed] [Google Scholar]
- Nies, D.H. (2003) Efflux‐mediated heavy metal resistance in prokaryotes. FEMS Microbiol Rev 27: 313–339. [DOI] [PubMed] [Google Scholar]
- Oliveira, A. , and Pampulha, M.E. (2006) Effects of long‐term heavy metal contamination on soil microbial characteristics. J Biosci Bioeng 102: 157–161. [DOI] [PubMed] [Google Scholar]
- Paridaens, J. , Olyslaegers, G. , and Gueibe, C. (2016) Results of the Belgian Aerial Gamma Survay (AGS) Campaign Organized During the Spring of 2016.
- Paridaens, J. and Vanmarcke, H. (2001) Inventarisatie en karakterisatie van verhoogde concentraties aan natuurlijke radionucliden van industriële oorsprong in Vlaanderen.
- Prakash, D. , Gabani, P. , Chandel, A.K. , Ronen, Z. , and Singh, O.V. (2013) Bioremediation: a genuine technology to remediate radionuclides from the environment. J Microbial Biotechnol 6: 349–360. [DOI] [PMC free article] [PubMed] [Google Scholar]
- Prăvălie, R. (2014) Nuclear weapons tests and environmental consequences: a global perspective. Ambio 43: 729–744. [DOI] [PMC free article] [PubMed] [Google Scholar]
- Props, R. , Monsieurs, P. , Mysara, M. , Clement, L. , and Boon, N. (2016) Measuring the biodiversity of microbial communities by flow cytometry. Methods Ecol Evol 7: 1376–1385. [Google Scholar]
- R Core Team . (2019) R: A Language and Environment for Statistical Computing. Austria: R Found Stat Comput Vienna. https://www.r-project.org/. [Google Scholar]
- Reasoner, D.J. , and Geldreich, E.E. (1985) A new medium for the enumeration and subculture of bacteria from potable water. Appl Environ Microbiol 49: 1–7. [DOI] [PMC free article] [PubMed] [Google Scholar]
- Reese, B.K. , Witmer, A.D. , Moller, S. , Morse, J.W. , and Mills, H.J. (2014) Molecular assays advance understanding of sulfate reduction despite cryptic cycles. Biogeochemistry 118: 307–319. [Google Scholar]
- Renninger, N. , Knopp, R. , Nitsche, H. , Clark, D.S. , and Keasling, J.D. (2004) Uranyl precipitation by Pseudomonas aeruginosa via controlled polyphosphate metabolism. Appl Environ Microbiol 70: 7404–7412. [DOI] [PMC free article] [PubMed] [Google Scholar]
- Rother, J.A. , Millbank, J.W. , and Thornton, I. (1982) Effects of heavy‐metal additions on ammonification and nitrification in soils contaminated with cadmium, lead and zinc. Plant and Soil 69: 239–258. [Google Scholar]
- Rousk, J. , and Rousk, K. (2018) Responses of microbial tolerance to heavy metals along a century‐old metal ore pollution gradient in a subarctic birch forest. Environ Pollut 240: 297–305. [DOI] [PubMed] [Google Scholar]
- Ruggiero, C.E. , Boukhalfa, H. , Forsythe, J.H. , Lack, J.G. , Hersman, L.E. , and Neu, M.P. (2005) Actinide and metal toxicity to prospective bioremediation bacteria. Environ Microbiol 7: 88–97. [DOI] [PubMed] [Google Scholar]
- Sandaa, R.‐A. , Torsvik, V. , and Enger, Ø. (2001) Influence of long‐term heavy‐metal contamination on microbial communities in soil. Soil Biol Biochem 33: 287–295. [Google Scholar]
- Sandaa, R.‐A. , Torsvik, V. , Enger, Ø. , Daae, F.L. , Castberg, T. , and Hahn, D. (1999) Analysis of bacterial communities in heavy metal‐contaminated soils at different levels of resolution. FEMS Microbiol Ecol 30: 237–251. [DOI] [PubMed] [Google Scholar]
- Schippers, A. , and Sand, W. (1999) Bacterial leaching of metal sulfides proceeds by two indirect mechanisms via thiosulfate or via polysulfides and sulfur. Appl Environ Microbiol 65: 319–321. [DOI] [PMC free article] [PubMed] [Google Scholar]
- Schrader, C. , Schielke, A. , Ellerbroek, L. , and Johne, R. (2012) PCR inhibitors ‐ occurrence, properties and removal. J Appl Microbiol 113: 1014–1026. [DOI] [PubMed] [Google Scholar]
- Schulz, S. , Brankatschk, R. , Dümig, A. , Kögel‐Knabner, I. , Schloter, M. , and Zeyer, J. (2013) The role of microorganisms at different stages of ecosystem development for soil formation. Biogeosciences 10: 3983–3996. [Google Scholar]
- Shi, W. , Becker, J. , Bischoff, M. , Turco, R.F. , and Konopka, A.E. (2002) Association of microbial community composition and activity with lead, chromium, and hydrocarbon contamination. Appl Environ Microbiol 68: 3859–3866. [DOI] [PMC free article] [PubMed] [Google Scholar]
- Simonoff, M. , Sergeant, C. , Poulain, S. , and Pravikoff, M.S. (2007) Microorganisms and migration of radionuclides in environment. Comptes Rendus Chim 10: 1092–1107. [Google Scholar]
- Sitte, J. , Löffler, S. , Burkhardt, E.M. , Goldfarb, K.C. , Büchel, G. , Hazen, T.C. , and Küsel, K. (2015) Metals other than uranium affected microbial community composition in a historical uranium‐mining site. Environ Sci Pollut Res 22: 19326–19341. [DOI] [PubMed] [Google Scholar]
- Six, J. , Bossuyt, H. , Degryze, S. , and Denef, K. (2004) A history of research on the link between (micro)aggregates, soil biota, and soil organic matter dynamics. Soil Tillage Res 79: 7–31. [Google Scholar]
- Song, J. , Shen, Q. , Wang, L. , Qiu, G. , Shi, J. , Xu, J. , et al. (2018) Effects of cd, cu, Zn and their combined action on microbial biomass and bacterial community structure. Environ Pollut 243: 510–518. [DOI] [PubMed] [Google Scholar]
- Sutcliffe, B. , Chariton, A.A. , Harford, A.J. , Hose, G.C. , Greenfield, P. , Elbourne, L.D.H. , et al. (2017) Effects of uranium concentration on microbial community structure and functional potential. Environ Microbiol 19: 3323–3341. [DOI] [PubMed] [Google Scholar]
- Tack, F.M.G. (2010) Trace elements: general soil chemistry, principles and processes. Hooda P.S, Ed. In Trace Elements in Soils. Oxford: Blackwell Publishing Ltd, pp. 9–37. 10.1002/9781444319477.ch2. [DOI] [Google Scholar]
- Theodorakopoulos, N. , Février, L. , Barakat, M. , Ortet, P. , Christen, R. , Piette, L. , et al. (2017) Soil prokaryotic communities in Chernobyl waste disposal trench T22 are modulated by organic matter and radionuclide contamination. FEMS Microbiol Ecol 93: 1–12. [DOI] [PubMed] [Google Scholar]
- Thomas, J.C. , Oladeinde, A. , Kieran, T.J. , Finger, J.W. , Bayona‐Vásquez, N.J. , Cartee, J.C. , et al. (2020) Co‐occurrence of antibiotic, biocide, and heavy metal resistance genes in bacteria from metal and radionuclide contaminated soils at the Savannah River Site. J Microbial Biotechnol 13: 1179–1200. [DOI] [PMC free article] [PubMed] [Google Scholar]
- Torsvik, V. , Sørheim, R. , and Goksøyr, J. (1996) Total bacterial diversity in soil and sediment communities – a review. J Ind Microbiol Biotechnol 17: 170–178. [Google Scholar]
- Turpeinen, R. , Kairesalo, T. , and Häggblom, M.M. (2004) Microbial community structure and activity in arsenic‐, chromium‐ and copper‐contaminated soils. FEMS Microbiol Ecol 47: 39–50. [DOI] [PubMed] [Google Scholar]
- UNSCEAR (1993) Report to the general assembly (Annex B—Exposures from man‐made sources of radiation).
- Wang, Y.P. , Shi, J.Y. , Wang, H. , Lin, Q. , Chen, X.C. , and Chen, Y.X. (2007) The influence of soil heavy metals pollution on soil microbial biomass, enzyme activity, and community composition near a copper smelter. Ecotoxicol Environ Saf 67: 75–81. [DOI] [PubMed] [Google Scholar]
- Xia, W. , Zhang, C. , Zeng, X. , Feng, Y. , Weng, J. , and Lin, X. (2011) Autotrophic growth of nitrifying community in an agricultural soil. ISME J 5: 1226–1236. [DOI] [PMC free article] [PubMed] [Google Scholar]
- Yin, H. , Niu, J. , Ren, Y. , Cong, J. , Zhang, X.X. , Fan, F. , et al. (2015) An integrated insight into the response of sedimentary microbial communities to heavy metal contamination. Sci Rep 5: 1–12. [DOI] [PMC free article] [PubMed] [Google Scholar]
- Yin, K. , Wang, Q. , Lv, M. , and Chen, L. (2019) Microorganism remediation strategies towards heavy metals. Chem Eng J 360: 1553–1563. [Google Scholar]
- Zeng, X. , Xu, H. , Lu, J. , Chen, Q. , Li, W. , Wu, L. , et al. (2020) The immobilization of soil cadmium by the combined amendment of bacteria and hydroxyapatite. Sci Rep 10: 1–8. [DOI] [PMC free article] [PubMed] [Google Scholar]
- Zhang, C. , Nie, S. , Liang, J. , Zeng, G. , Wu, H. , Hua, S. , et al. (2016) Effects of heavy metals and soil physicochemical properties on wetland soil microbial biomass and bacterial community structure. Sci Total Environ 557–558: 785–790. [DOI] [PubMed] [Google Scholar]
- Zhang, H. , and Reynolds, M. (2019) Cadmium exposure in living organisms: a short review. Sci Total Environ 678: 761–767. [DOI] [PubMed] [Google Scholar]
Associated Data
This section collects any data citations, data availability statements, or supplementary materials included in this article.
Supplementary Materials
Appendix S1: Supporting Information.
Figure S1 A. Visualization of the origin of contamination from two distinct industries. Nuclear industry discharged in the Molse Nete (red line) and phosphate industry discharged in the Grote Laak (green line). Both rivers flow downstream in the Grote Nete river (blue line) and contaminated river banks in the black circle. The map originated from Geopunt Vlaanderen and was adapted based on information from the Federal Agency for Nuclear Control (FANC). B. Schematic representation of the sample locations. Locations L1–L6 were located in the meadow, L7 was on the border of this meadow with a mown field where L8 and L9 were situated. The map was adapted from Google Maps. C. Illustration of the sample method in the sterile manner.
Fig. S2: Overview of the general soil characteristics, major ions and total element concentrations measured on the different locations (L1–L9). Moisture, TOC and most total element concentrations are displayed in % (w/w). All ions and total S are presented in mg/kg. Error bars for pH, Moisture and all ions represent variation on technical replicates. Error bars of total element concentrations represent measurement uncertainty. Values below detection limit are indicated with <DL. The detection limit is shown as a dotted line.
Fig. S3: Overview of the relative abundance of the top 10 most abundant phyla after subsampling for all 27 samples. Data are presented in relative abundance (%). A legend is provided for the different phyla.
Fig. S4: Pearson correlation matrix between the relative abundance of the five most abundant phyla and their classes and unclassified Bacteria. Phyla and classes are listed according to decreasing relative abundance. Significant Pearson correlations (p < 0.05) are coloured from red (positive) to blue (negative). Non‐significant Pearson correlations are shown in grey.
Fig. S5: Overview of the relative abundance of the top 15 most abundant classes after subsampling for all 27 samples. Data are presented in relative abundance (%). A legend is provided for the different classes.
Fig. S6: Pearson correlation matrix between the relative abundance of the 50 most explanatory OTUs and the metadata. Significant Pearson correlations (p < 0.05) are coloured from red (positive) to blue (negative). Non‐significant Pearson correlations are shown in grey.
Fig. S7: Boxplot showing the total cell count in control samples (L7–9) (white) compared to contaminated soil samples (L1–6) (grey) determined with Flow Cytometry (left panel), viable count on mineral salts RM agar medium (middle panel) and on R2A agar (right panel). The box has lines at the lower quartile, median and upper quartile values. The whiskers are lines extending from each end of the box to show the extent of the rest of the data, with a maximum length of 1.5 times the interquartile range. Values represent the log10 of cells/g soil.
Fig. S8: Comparison of the OTUs found in the negative (empty tube) control (NC) across all samples (L1.1–L9.3). The total amount of reads was 847 for the NC while all other samples contained >10,000 reads. The number of reads is presented on a 2‐segment linear scale ranging from 0 to 1000 and 8000 to 22,000 reads.
Fig. S9: Rarefaction curves of all samples showing the number of OTUs in function of the number of reads, subsampling was performed on 10,198 reads (dotted line).
Table S1 Overview of the 16S read processing in number of raw and high quality reads, subsampling depth and alpha diversities.
Table S2: Taxonomy of all OTUs and their number of high quality reads for all 27 samples after subsampling.
Table S3: Overview of the significant (p < 0.05) Pearson correlations between the sum of the relative abundance of all nitrification OTUs and the metadata. The values shown are the Pearson correlation coefficients (r).