Abstract
Objectives
Lung cancer has the highest mortality rate among the various types of cancer. Panax ginseng (C. A. Mey). is a popular anti‐cancer herbal supplement. The quality control of ginseng is crucial to ensure its clinical efficacy. This study aimed to establish new quality control methods for ginseng and to identify its main active components responsible for lung cancer treatment.
Methods
Ultra‐high‐performance liquid chromatography (UPLC) was used to establish fingerprints of 18 batches of ginseng. CCK‐8 test was performed to evaluate the inhibitory activity of ginseng on Lewis lung cancer (LLC) cells. The spectrum‐effect relationship analysis of ginseng was assessed by canonical correlation analysis (CCA) and bioactivity validation.
Key findings
Six common peaks were identified and the variation coefficients were determined. The 18 batches of ginseng inhibited the proliferation of LLC cells to different degrees, showing different half maximal inhibitory concentration (IC50) values. Spectrum‐effect relationship analysis showed that ginsenoside Ro is the main anti‐proliferative constituent of LLC cell.
Conclusions
Spectrum‐effect relationship is suitable for quality control of ginseng used for lung cancer. It is also effective in discovering the active ingredients related to the clinical efficacy of traditional Chinese medicine.
Keywords: ginsenoside Ro, Lewis lung cancer cells, Panax ginseng, spectrum‐effect relationships, traditional Chinese medicine
Short abstract
Panax ginseng is a popular herbal supplement in lung cancer patients. We used cells viability assay and chromatographic fingerprint to establish the spectrum‐effect relationship method to evaluate the effect of 18 ginseng samples on Lewis lung cancer (LLC) cells. We found ginsenoside Ro is the main active constituents. And our work indicates that spectrum‐effect relationships is a reliable method for controlling quality and discovering the material basis related to the clinical efficacy of traditional Chinese medicine.
Highlights.
Chemical fingerprints revealed variations in the contents of six main peaks contained in 18 batches of Panax ginseng.
Ginsenosides Ro might be the active constituents of anti‐proliferative effect of Panax ginseng on Lewis lung cancer cells.
Using cells viability assay and chromatographic fingerprint to establish the spectrum‐effect relationship method to improve the quality control method of Panax ginseng in the treatment of lung cancer.
1. INTRODUCTION
Lung cancer is the most common type of malignancy worldwide, with nearly two million new cases diagnosed each year. 1 Surgery, chemotherapy and targeted therapy are currently the main treatment methods. However, toxic effects and drug resistance have been a bottleneck. Traditional Chinese medicine (TCM), as a complementary therapy, has survival and quality of life benefits for cancer patients, and has attracted great research interest. 2 , 3 The detection of one or several index components has been used as the main method in the quality of TCM. 4 However, the multiple chemical components and targets of TCM pose a challenge in establishing quality control methods especially in targeting ingredients associated with clinical efficacy. 5 , 6 The fingerprint method provides a comprehensive characterisation of the TCM components and has been approved for assessing the quality of herbal medicines by the World Health Organisation (WHO). 7 Moreover, ultra‐high‐performance liquid chromatography (UPLC), a highly efficient and accurate technique, can be used to obtain chemical fingerprints, evaluate quality, and identify the authenticity of TCM. 8 The spectrum‐effect relationship is a new method that can integrate the chemical fingerprints with pharmacological effects, to ensure the quality and find functional constituents in TCM. 9
The dry root and rhizome of Panax ginseng, have been widely used in TCM and have multiple pharmacological activities, including: antioxidant, anti‐inflammatory, anti‐ageing, and immunity boost properties. 10 , 11 Extensive preclinical and clinical evidence shows that ginseng has beneficial effects against lung cancer; 12 , 13 , 14 , 15 the main active ingredient is ginsenoside Rg3. 15 , 16 , 17 , 18 However, its quantity is too low to be determined by general detection methods. Therefore, it is important to explore other compounds that are active against lung cancer.
Inhibition of tumour cell proliferation is regarded as one of the main mechanisms of antitumour agents. 19 , 20 In this study, UPLC was performed to generate fingerprints of ginseng samples from various sources. The half maximal inhibitory concentration (IC50) of ginseng was determined on Lewis lung cancer (LLC) cells to evaluate its anti‐lung cancer effect. The spectrum‐effect relationship of ginseng was constructed using correlation analysis statistical method by correlating UPLC data with anti‐lung cancer activity. This work provides a new perspective on the active components and clinical efficacy oriented quality control of TCM in the treatment of lung cancer.
2. MATERIAL AND METHODS
2.1. Materials and reagents
Eighteen batches of ginseng were collected from China Medico Technology Co. Ltd (Tianjin, China) and various Chinese herbal medicine markets in several provinces of China, such as Sichuan, Guangxi, Heilongjiang, Jilin, Hunan and Shenyang. The species were identified by Professor Xiao‐he Xiao, a taxonomist at the China Military Institute of Chinese Medicine. Acetonitrile and phosphoric acid (HPLC grade) were obtained from Fisher Scientific Co. (Fair Lawn, NJ, USA) and Beijing Chemical Works (Beijing, China), respectively. Ultrapure distilled water was prepared using a Millipore water purification system (Millipore, Bedford, MA, USA). The ginsenosides Rg1, Re, Rb1, Rc, Ro, and Rd were acquired from Chengdu Chroma‐Biotechnology Co. Ltd (Chengdu, China). Foetal bovine serum (FBS), DMEM (Dulbecco’s modified Eagle’s medium) high‐sugar medium, penicillin, and streptomycin were purchased from Gibco (Carlsbad, CA, USA). CCK‐8 kit was purchased from Dojindo Laboratories (Kumamoto, Japan).
2.2. Plant sample preparation and reference standard solution
Powdered sample (5 g) of ginseng was added to 100 mL of 70% (v/v) ethyl alcohol and extraction done by ultrasonic wave for an hour at 25°C. The extracted liquid was filtered and concentrated using a rotary evaporator. The lyophilised powder of the extract was dissolved before use.
Accurately weighed amounts of ginsenosides Rg1, Re, Rb1, Rc, Ro and Rd were dissolved in methanol to final concentrations of 78.9 μg/mL (Rg1), 86.8 μg/mL (Re), 95.7 μg/mL (Rb1), 94.1 μg/mL (Rc), 87.2 μg/mL (Ro) and 190.6 μg/mL (Rd).
2.3. UPLC conditions
The dry powder was dissolved in methyl alcohol to a suitable concentration. The prepared samples were injected into a Waters ACQUITYUPLC system (Waters, Milford, MA, USA) with a photodiode array (PDA) detector. The chromatographic separation was performed with a Waters ACQUITYUPLCBEHC18 column (2.1 mm × 100 mm, 1.7 μm) (Waters), operated at 30°C. The mobile phases were water (solvent A) and acetonitrile (solvent B) with gradient elution as follows: 0–10.0 min, 10–19% B; 10.0–16.0 min, 19–21% B; 16.0–21.0 min, 21–32% B; 21.0–26.0 min, 32–41%; 26.0–32.0 min, 41–45%; 32.0–36.0 min, 45–50%. The flow rate was kept constant at 0.25 mL/min and UV measurements were obtained at 203 nm.
2.4. Cell culture
LLC cells were obtained from the Cell Bank of the Chinese Academy of Sciences (Shanghai, China) and cultured in DMEM high‐sugar medium supplemented with 10% FBS, with 1% penicillin–streptomycin added. They were incubated at 37°C under a humidified atmosphere containing 5% carbon dioxide (CO2).
2.5. Cells viability assay
All 18 batches of lyophilised powder of the extract were dissolved in 1 mL DMEM high‐sugar medium and diluted with medium to the appropriate concentrations. The anti‐proliferative effect of these batches was evaluated in vitro on LLC cells, using the CCK‐8 test. LLC cells were incubated in 5% CO2 at 37°C for 24 h, and then seeded in a 96‐well plate at a density of 1 × 10⁴ cells per well in DMEM high‐sugar medium for another 24 h. The supernatant was discarded and the cells were treated with ginseng samples over a wide range of concentrations to establish a 48‐h growth curve. Afterwards, 10 μL of CCK‐8 reagent (100 μL/mL medium) was added to each well and the cells were incubated for 1 h. Absorbance (A) was measured at 450 nm using Synergy HTX Multi‐Mode Reader (BioTek Instruments, Winooski, VT, USA). The proliferative inhibition rate was measured using the formula: Inhibition rate (%) = [(A control − A sample)/(A control − Ablank)] × 100%. The IC50 was calculated by non‐linear regression analysis using Graph‐Pad Prism software (San Diego, CA, USA).
2.6. Hierarchical clustering analysis
Hierarchical clustering analysis (HCA) is a multivariate analysis method that classifies specimens according to their closeness in nature. 4 , 21 The analysis maximises the similarity between the comparable data elements and the differences between different data elements. 22 In this study, HCA of the 18 batches of ginseng was performed using online Metabo Analyst 3.0 (http://www.metaboanalyst.ca/) to estimate the correlation to the UPLC fingerprints.
2.7. Canonical correlation analysis
Canonical correlation analysis (CCA) is a multivariate statistical model used to extract factors with the greatest impact on the outcome variables and to maximise the relationship between the two sets of variables. 23 Taking the Pearson correlation coefficient as an index, the common peaks in the fingerprints of different ginseng samples were regarded as one set of variables, and the reciprocal of IC50 values as the other set. SPSS statistics software (SPSS for Windows 17.0, SPSS Inc., Chicago, IL, USA) was used to analyse the correlation between peaks and the reciprocal of IC50 values.
3. RESULTS
3.1. UPLC fingerprint analysis
The fingerprint of a mixture of reference substances is shown in Figure 1(A). The test sample showed satisfactory segregation between its peaks (Figure 1B). Under the optimal conditions, the UPLC fingerprints of the 18 ginseng samples from different areas were generated (Figure 1C). Six common peaks were observed at 1 to 30 min interval by comparing their retention time and UV spectrum with those of standard compounds. Six common peaks (a, b, c, d, e, and f) were identified as ginsenosides Rg1, Re, Rb1, Rc, Ro, and Rd, respectively. Some differences were noted in the data collected (Table 1) and the percentage relative standard deviation (RSD%) of common peaks in the range 30.53–66.17%, which indicates that there was a difference in the chemical constituents of ginseng obtained from different production areas.
FIGURE 1.
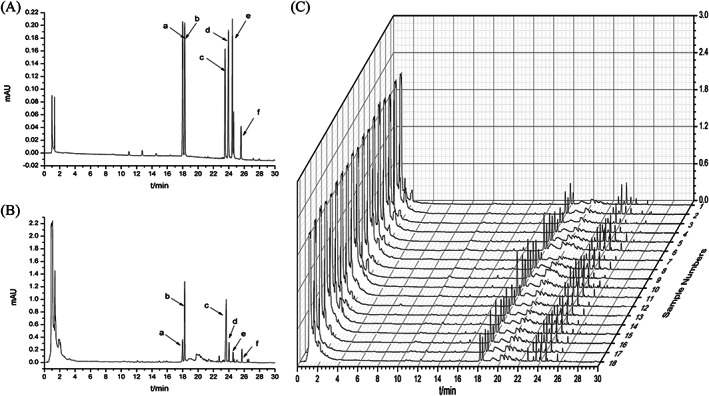
UPLC fingerprints of reference standards (A), test samples (B) and all ginseng samples (C) six peaks were represented as follows: (a) ginsenoside Rg1; (b) ginsenoside Re; (c) ginsenoside Rb1; (d) ginsenoside Rc; (e) ginsenoside Ro; (f) ginsenoside Rd
TABLE 1.
Peak area of six common peaks identified by ultra‐high‐performance liquid chromatography (UPLC)
| Sample | Peak area of each compound | |||||
|---|---|---|---|---|---|---|
| a | b | c | d | e | f | |
| t R (min) | 18.39 | 18.63 | 23.48 | 24.07 | 24.41 | 25.42 |
| S1 | 1563 | 980 | 1112 | 605 | 328 | 464 |
| S2 | 1667 | 1302 | 2053 | 595 | 331 | 587 |
| S3 | 1362 | 985 | 972 | 377 | 265 | 325 |
| S4 | 1497 | 1116 | 1093 | 505 | 293 | 339 |
| S5 | 2644 | 2228 | 1850 | 2023 | 893 | 445 |
| S6 | 3553 | 2351 | 2366 | 1620 | 1311 | 248 |
| S7 | 951 | 660 | 887 | 745 | 263 | 468 |
| S8 | 2487 | 2395 | 2003 | 1381 | 818 | 326 |
| S9 | 3208 | 2890 | 2059 | 1263 | 663 | 298 |
| S10 | 2819 | 2497 | 2165 | 1598 | 709 | 303 |
| S11 | 3758 | 1941 | 2231 | 1302 | 688 | 220 |
| S12 | 1895 | 1323 | 1192 | 911 | 557 | 421 |
| S13 | 2243 | 1706 | 1518 | 1039 | 701 | 357 |
| S14 | 2106 | 1979 | 1445 | 1066 | 669 | 327 |
| S15 | 2928 | 1431 | 1567 | 1116 | 843 | 283 |
| S16 | 2796 | 1367 | 1791 | 1078 | 1137 | 434 |
| S17 | 1891 | 1483 | 1095 | 890 | 598 | 498 |
| S18 | 2531 | 2193 | 1955 | 1128 | 938 | 470 |
| RSD% | 33.41 | 36.37 | 30.53 | 41.87 | 45.93 | 66.17 |
RSD = σ/μ × 100; RSD, relative standard deviation; σ, standard deviation; μ, average value of peak area. (a) Ginsenoside Rg1, (b) ginsenoside Re, (c) ginsenoside Rb1, (d) ginsenoside Rc, (e) ginsenoside Ro, (f) ginsenoside Rd.
3.2. Inhibitory effect of ginseng on LLC cells
Cell viability was tested by CCK‐8 assay. All 18 batches of ginseng inhibited LLC cells in a dose‐dependent manner (Figure 2A). The curve fitting method was used to evaluate the inhibitory activity and to estimate the IC50 value. The samples showed different biological activities on LLC cells, with IC50 values ranging from 0.06 to 13.20 mg/mL. The sample, S6, had the highest inhibition rate as it had the lowest IC50. In contrast, S7 showed the weakest inhibitory effect with a difference of more than 200‐fold (Figure 2B) The biological activity varied greatly amongst batches, indicating that the sample source has a great influence on the quality of ginseng.
FIGURE 2.
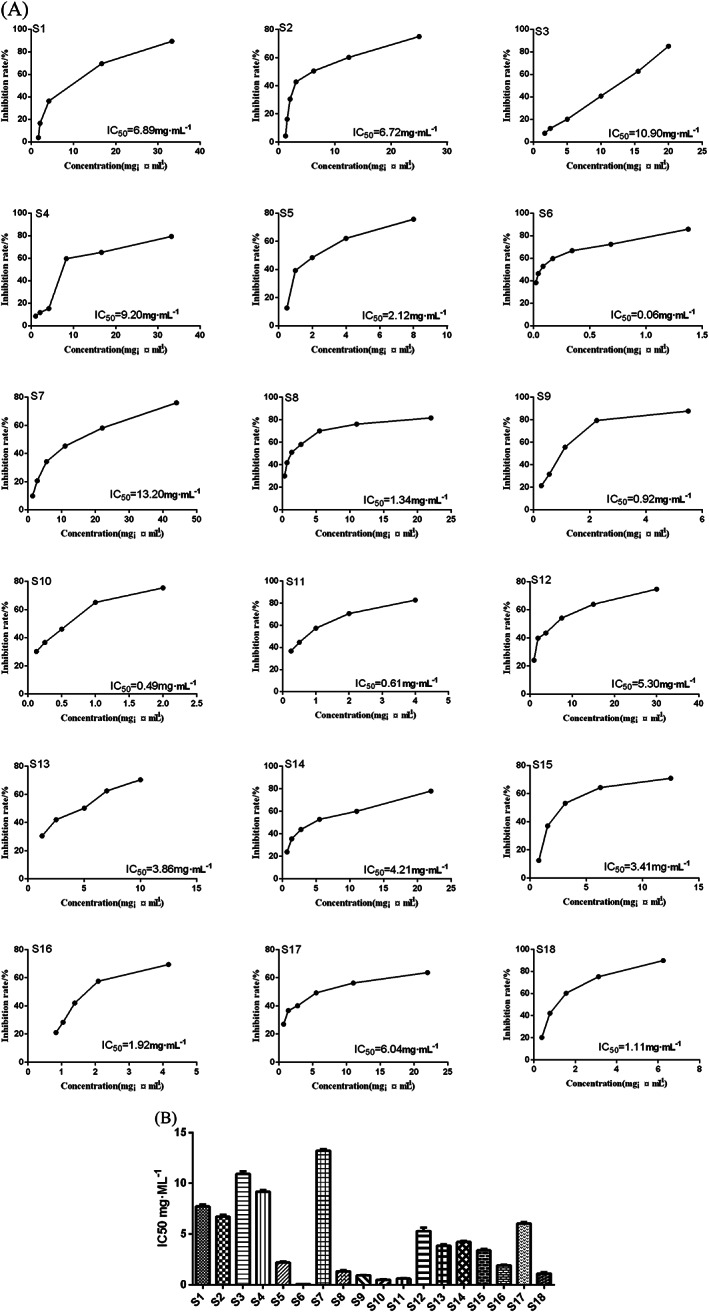
Inhibitory effect of ginseng on LLC cells. (A) Effects of 18 batches of ginseng samples on the viability of LLC cells. (B) IC50 values of ginseng samples on LLC cells
3.3. Hierarchical clustering analysis
HCA was used to distinguish ginseng from different sources by generating different clusters, according to the similarity of fingerprints. The results were visualised using a heat map. Samples were divided into three main clusters based on their inherent differences in their chemical composition (Figure 3). Cluster 1 consisted of S1 to S4 and S7; cluster 2 of S6, S11, S15 and S16; and cluster 3 of S5, S8–10, S12–14 and S17–18. A heat map with annotation and labels can map individual values to colours. 24 The map reveals that there are significant differences in the distribution of the main components among different samples; ginseng from different production regions has different chemical composition. HCA may be useful in preliminarily distinguishing the chemical composition of samples.
FIGURE 3.
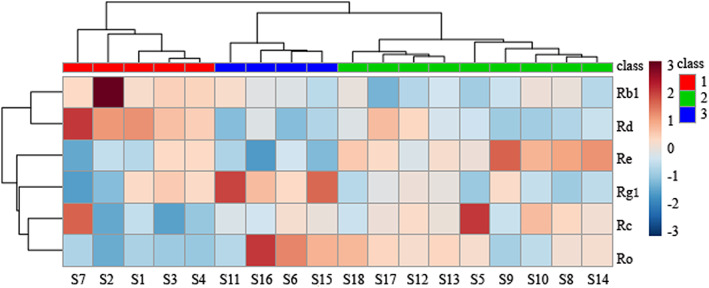
Heat map of 18 batches of ginseng and six chemical compounds (right of the map) [Colour figure can be viewed at wileyonlinelibrary.com]
3.4. Correlation analysis of the spectrum‐effect
Pearson correlation analysis was performed between the reciprocal of IC50 values and peak area values for six common peaks in UPLC data, to find the major active components involved in LLC cell inhibition. The reciprocal of IC50 is positively correlated with the inhibitory activity. We analysed the peaks with positive correlation coefficients using SPSS statistics software. The correlation coefficients of ginsenosides Rg1, Re, Rb1, Rc and Ro, were positive, which shows that they correlate with the anti‐proliferative activity of ginseng (Figure 4A). Online Metabo Analyst 3.0 (http://www.metaboanalyst.ca/) was used to correlate the reciprocal of IC50 values and the area of common peak. Thermographs with annotation labels mapped individual values to colours. The results in Figure 4(B) were consistent with those in Figure 4(A). Pearson correlation analysis showed that ginsenosides Ro, Rg1, and Rb1 were significantly correlated. Ginsenoside Ro had the highest correlation (R = 0.584) to inhibition, followed by Rg1 (R = 0.496), Rb1 (R = 0.487); indicating that the biological activity increased with the increasing content of ginsenoside Ro. Therefore, the earlier results suggest that ginsenoside Ro is the major active constituent that inhibits LLC cells in ginseng.
FIGURE 4.
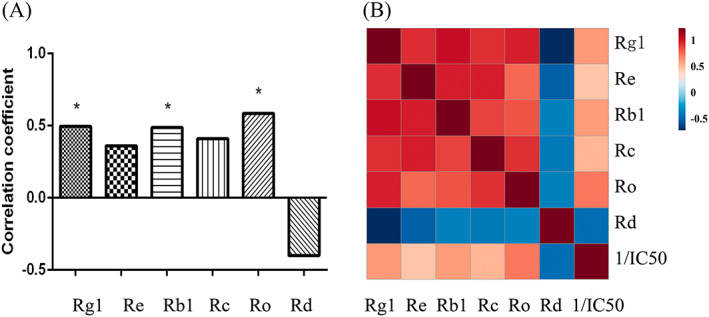
Correlation analysis. (A) Pearson correlation coefficient between the IC50 value and peak area of six common peaks. (B) Thermograph of the correlation analysis of all factors [Colour figure can be viewed at wileyonlinelibrary.com]
3.5. Experimental validation
The CCK‐8 assays were performed to determine their inhibition of ginsenosides Rg1, Rb1, and Ro on LLC cells to verify their anti‐lung cancer activity. Four concentrations of each compound were used. The three compounds were found to possess dose‐dependent anti‐proliferation activity against LLC cells. Ginsenoside Ro had the highest inhibitory effect on LLC cells, which was consistent with the results of spectrum‐effect correlation analysis (Figure 5).
FIGURE 5.
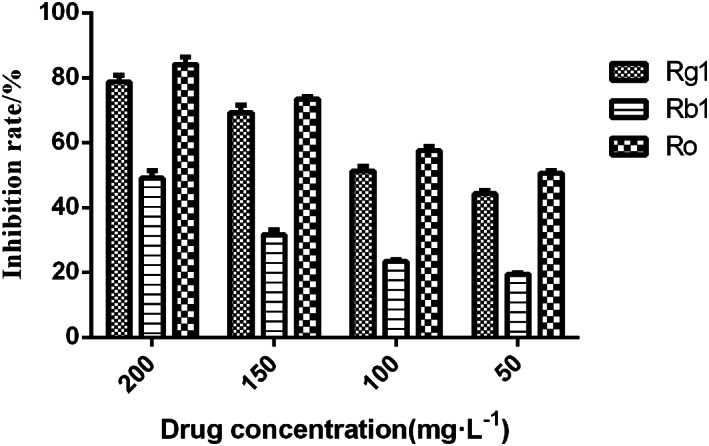
Validation of inhibitory effect of ginsenosides Rg1, Rb1, and Ro on LLC cells
4. DISCUSSION
Quality control of TCM mainly utilises chemical analysis to determine index components. Some of these constituents may not be associated with clinical efficacy; therefore, chemical analysis alone is not adequate for clinical quality control of TCM. For example, ginseng is often used as an adjuvant treatment for lung cancer, but its main active ingredients related to anti‐lung cancer activity is not clear. It is important to identify the quality of ginseng in the market because it is expensive and the quality varies amongst different sources. A quality control method for the evaluation and standardisation of ginseng components is therefore necessary.
Chromatographic fingerprint can reveal the chemical composition of various test samples and has been accepted as a quality control method for TCM by the WHO. 25 According to the People's Republic of China Pharmacopoeia, the determination of ginsenosides Rg1, Re, and Rb1 is used as the quality control standard of ginseng. In this study, fingerprints of 18 batches of ginseng were established using UPLC and six common peaks were obtained. The peaks had relatively high contents of Rg1, Re and Rb1, and these varied significantly among different samples. The effects of these variations on lung cancer cells need to be verified.
Biological detection methods for anti‐lung cancer activity were constructed to supplement the lack of chemical analysis of ginseng. The results showed that the 18 batches of ginseng had different inhibitory effects against LLC cells, and the variation in the anti‐proliferative activity of S6 and S7 was by > 200 times among the batches. This method accurately reflected the difference in anti‐lung cancer activity among ginseng samples, and could be used to evaluate the efficacy. Moreover, this method may provide a paradigm for the quality control of other TCM modalities used in lung cancer.
Spectrum‐effect relationship analysis can combine the chromatographic fingerprint with pharmacological efficacy through multiple statistical analysis methods. This helps to assess the internal quality and find the major active constituents involved in clinical efficacy. 4 , 5 , 26 Spectrum‐effect relationship has been successfully applied to analyse a variety of bioactive constituents in TCM. Li et al. found that trans‐2,3,5,4′‐tetrahydroxy‐stilbene‐2‐O‐β‐d‐glucoside and catechin are the active constituents of Polygonum multiflorum in inhibiting platelet aggregation. 5 Wang et al. found sinomenine, magnoflorine, menisperine and stepharanine as the major anti‐inflammatory compounds in Sinomenii Caulis 27 and Wu et al. found that praeruptorin A, schisanddrin, arctiin and pseudoephedrine were the quality control markers for the Suhuang antitussive capsule in anti‐inflammation. 25 In this study, we found ginsenoside Ro to be the main active ingredient against LLC cells. Our previous research showed that Si Jun Zi Tang (SJZ) can inhibit tumour growth in LLC‐bearing mice. 28 Ginsenosides Ro and Rg1 were the two major active components of SJZ in inhibiting PC9 proliferation by spectrum‐effect relationship analysis. 29 This effect may be attributed to ginseng, the main herb in SJZ. Ginsenoside Ro is also one of the bioactive components of Shenmai injection that is often used as an adjuvant treatment for various cancers. 30 Ginsenoside Ro can suppress the HT29 cell metastasis 31 and markedly inhibits tumour growth in B16F10‐transplanted mice. 32 Oleanolic acid (OA), an aglycone of ginsenoside Ro, has been shown to inhibit the proliferation and induce apoptosis of cancer cells. 33 Some studies suggested that ginsenoside Ro may be a novel autophagy inhibitor, with the potential to be used as an antitumour drug. 34 Thus, ginsenosides Ro could be used as a new quality control marker for ginseng treatment in lung cancer.
In conclusion, the chemical composition content and biological activity of ginseng varies greatly across regions. The bioactive components against lung cancer were revealed using the spectrum‐effect relationship, which is a reliable method for quality control of ginseng. However, ginsenoside Ro is the only quality control indicator of the efficacy of ginseng against lung cancer, which is a limiting factor. Many other antitumour constituents such as ginsenoside Rg3, were not detected using a PDA detector due to low content; 35 there may be other components that promote the activity of Ro (the crude sample). In conclusion, modern analytical technology such as UPLC−mass spectrometry should be used in the future research to analyse the active constituents or metabolites of ginseng with activity against lung cancer and to identify their interaction.
CONFLICT OF INTEREST
The authors declared that they have no conflicts of interest to this work.
ACKNOWLEDGEMENT
This work was supported by CAMS Innovation Fund for Medical Sciences (CIFMS) (Grant no. 2016‐I2M‐1‐001).
Zhou X, Liu H, Zhang M, Li C, Li G. Spectrum‐effect relationship between UPLC fingerprints and anti‐lung cancer effect of Panax ginseng . Phytochemical Analysis. 2021;32:339–346. 10.1002/pca.2980
Contributor Information
Chunyu Li, Email: chunyu_li@126.com.
Guohui Li, Email: tcm_sci@126.com.
REFERENCES
- 1. Wang J, Li X, Chen H. Organoid models in lung regeneration and cancer. Cancer Lett. 2020;475:129–135. [DOI] [PubMed] [Google Scholar]
- 2. Kwon CY, Lee B, Kim KI, Lee BJ. Herbal medicine on cancer‐related fatigue of lung cancer survivors: protocol for a systematic review. Medicine. 2020;99(5):1–5, e18968. [DOI] [PMC free article] [PubMed] [Google Scholar]
- 3. Kuo YT, Chang TT, Muo CH, et al. Use of complementary traditional Chinese medicines by adult cancer patients in Taiwan: a nationwide population‐based study. Integr Cancer Ther. 2018;17(2):531‐541. [DOI] [PMC free article] [PubMed] [Google Scholar]
- 4. Yang L, Jiang H, Wang S, et al. Discovering the major antitussive, expectorant, and anti‐inflammatory bioactive constituents in Tussilago farfara L. based on the spectrum‐effect relationship combined with chemometrics. Molecules. 2020;25(3):620–638. [DOI] [PMC free article] [PubMed] [Google Scholar]
- 5. Li C, Tu C, Che Y, et al. Bioassay based screening for the antiplatelet aggregation quality markers of Polygonum multiflorum with UPLC and chemometrics. J Pharm Biomed Anal. 2019;166:264‐272. [DOI] [PubMed] [Google Scholar]
- 6. Pan X, Zhou J, Chen Y, et al. Classification, hepatotoxic mechanisms, and targets of the risk ingredients in traditional Chinese medicine‐induced liver injury. Toxicol Lett. 2020;323:48‐56. [DOI] [PubMed] [Google Scholar]
- 7. Liu M, Wu Y, Huang S, Liu H, Feng J. Spectrum‐effect relationship between HPLC fingerprints and hypolipidemic effect of Curcuma aromatica . Biomed Chromatogr BMC. 2018;32:1–7, e4220. [DOI] [PubMed] [Google Scholar]
- 8. Nahar L, Onder A, Sarker SD. A review on the recent advances in HPLC, UHPLC and UPLC analyses of naturally occurring cannabinoids (2010–2019). Phytochem Anal PCA. 2019.31(4):413–457. [DOI] [PubMed] [Google Scholar]
- 9. Zhang J, Chen T, Li K, et al. Screening active ingredients of rosemary based on spectrum‐effect relationships between UPLC fingerprint and vasorelaxant activity using three chemometrics. J Chromatogr B Analyt Technol Biomed Life Sci. 2019;1134–1135:1–28, 121854. [DOI] [PubMed] [Google Scholar]
- 10. Mancuso C, Santangelo R. Panax ginseng and Panax quinquefolius: from pharmacology to toxicology. Food Chem Toxicol. 2017;107(Pt A):362‐372. [DOI] [PMC free article] [PubMed] [Google Scholar]
- 11. Wu W, Jiao C, Li H, Ma Y, Jiao L, Liu S. LC‐MS based metabolic and metabonomic studies of Panax ginseng. Phytochem Anal PCA. 2018;29(4):331‐340. [DOI] [PubMed] [Google Scholar]
- 12. Lee DY, Park CW, Lee SJ, et al. Anti‐cancer effects of Panax ginseng berry polysaccharides via activation of immune‐related cells. Front Pharmacol. 2019;10:1411–1421. [DOI] [PMC free article] [PubMed] [Google Scholar]
- 13. Xiao H, Xue Q, Zhang Q, et al. How ginsenosides trigger apoptosis in human lung adenocarcinoma cells. Am J Chin Med. 2019;47(8):1737‐1754. [DOI] [PubMed] [Google Scholar]
- 14. Hu M, Yang J, Qu L, et al. Ginsenoside Rk1 induces apoptosis and downregulates the expression of PD‐L1 by targeting the NF‐kappaB pathway in lung adenocarcinoma. Food Funct. 2020;11(1):456‐471. [DOI] [PubMed] [Google Scholar]
- 15. Liu T, Zuo L, Guo D, et al. Ginsenoside Rg3 regulates DNA damage in non‐small cell lung cancer cells by activating VRK1/P53BP1 pathway. Biomed Pharmacother Biomed Pharmacother. 2019;120:1–8, 109483. [DOI] [PubMed] [Google Scholar]
- 16. Tan Q, Lin S, Zeng Y, et al. Ginsenoside Rg3 attenuates the osimertinib resistance by reducing the stemness of non‐small cell. Lung Canc Cells. 2020;35(6):643‐651. [DOI] [PubMed] [Google Scholar]
- 17. Dai Y, Wang W, Sun Q, Tuohayi J. Ginsenoside Rg3 promotes the antitumor activity of gefitinib in lung cancer cell lines. Exp Ther Med. 2019;17(1):953‐959. [DOI] [PMC free article] [PubMed] [Google Scholar]
- 18. Wang XJ, Zhou RJ, Zhang N, Jing Z. 20(S)‐ginsenoside Rg3 sensitizes human non‐small cell lung cancer cells to icotinib through inhibition of autophagy. Eur J Pharmacol. 2019;850:141‐149. [DOI] [PubMed] [Google Scholar]
- 19. Zhao TT, Xu YQ, Hu HM, Gong HB, Zhu HL. Isoliquiritigenin (ISL) and its formulations: potential antitumor agents. Curr Med Chem. 2019;26(37):6786‐6796. [DOI] [PubMed] [Google Scholar]
- 20. Su T, Zhu J, Sun R, et al. Design, synthesis and biological evaluation of new quinoline derivatives as potential antitumor agents. Eur J Med Chem. 2019;178:154‐167. [DOI] [PubMed] [Google Scholar]
- 21. Han X, Jiang H, Han L, et al. A novel quantified bitterness evaluation model for traditional Chinese herbs based on an animal ethology principle. Acta Pharm Sinica B. 2018;8(2):209‐217. [DOI] [PMC free article] [PubMed] [Google Scholar]
- 22. Lu S, Dong S, Xu D, et al. Spectrum‐effect relationships between fingerprints of Caulophyllum robustum maxim and inhabited pro‐inflammation cytokine effects. Molecules. 2017;22(11):1826–1844. [DOI] [PMC free article] [PubMed] [Google Scholar]
- 23. Zhang DK, Li RS, Han X, et al. Toxic constituents index: a toxicity‐calibrated quantitative evaluation approach for the precise toxicity prediction of the hypertoxic phytomedicine‐aconite. Front Pharmacol. 2016;7:164–176. [DOI] [PMC free article] [PubMed] [Google Scholar]
- 24. Zhang Z, Murtagh F, van Poucke S, Lin S, Lan P. Hierarchical cluster analysis in clinical research with heterogeneous study population: ing its visualization with R. Annal Transl Med. 2017;5(4):75–85. [DOI] [PMC free article] [PubMed] [Google Scholar]
- 25. Wu X, Liu Q, Chen D, et al. Identification of quality control markers in Suhuang antitussive capsule based on HPLC‐PDA fingerprint and anti‐inflammatory screening. Journal of Pharmaceutical and Biomedical Analysis. 2020;180:113053–113065. [DOI] [PubMed] [Google Scholar]
- 26. Chen Y, Pan G, Xu W, et al. Spectrum‐effect relationship study between HPLC fingerprints and antioxidant activity of Sabia parviflora . J Chromatogr B Analyt Technol Biomed Life Sci. 2020;1140:121970. [DOI] [PubMed] [Google Scholar]
- 27. Wang LJ, Jiang ZM, Xiao PT, Sun JB, Bi ZM, Liu EH. Identification of anti‐inflammatory components in Sinomenii caulis based on spectrum‐effect relationship and chemometric methods. J Pharm Biomed Anal. 2019;167:38‐48. [DOI] [PubMed] [Google Scholar]
- 28. Li C, Niu M, Wang R, et al. The modulatory properties of Si Jun Zi Tang enhancing anticancer of gefitinib by an integrating approach. Biomed Pharmacother Biomed Pharmacother. 2019;111:1132‐1140. [DOI] [PubMed] [Google Scholar]
- 29. Zhou X, Li Y, Zhang M, et al. Spectrum‐effect relationship between UPLC fingerprints and antilung cancer effect of Si Jun Zi Tang. Evid Based Complement Alternat Med. 2019;2019:7282681. [DOI] [PMC free article] [PubMed] [Google Scholar]
- 30. Olaleye OE, Niu W, du FF, et al. Multiple circulating saponins from intravenous ShenMai inhibit OATP1Bs in vitro: potential joint precipitants of drug interactions. Acta Pharmacol Sin. 2019;40(6):833‐849. [DOI] [PMC free article] [PubMed] [Google Scholar]
- 31. Jiang Z, Qian J, Dong H, et al. The traditional Chinese medicine Achyranthes bidentata and our de novo conception of its metastatic chemoprevention: from phytochemistry to pharmacology. Sci Rep. 2017;7(1):3888–3900. [DOI] [PMC free article] [PubMed] [Google Scholar]
- 32. Zheng SW, Xiao SY, Wang J, Hou W, Wang YP. Inhibitory effects of ginsenoside Ro on the growth of B16F10 melanoma via its metabolites. Molecules. 2019;24(16).1–13. [DOI] [PMC free article] [PubMed] [Google Scholar]
- 33. Kim GJ, Jo HJ, Lee KJ, Choi JW, An JH. Oleanolic acid induces p53‐dependent apoptosis via the ERK/JNK/AKT pathway in cancer cell lines in prostatic cancer xenografts in mice. Oncotarget. 2018;9(41):26370‐26386. [DOI] [PMC free article] [PubMed] [Google Scholar]
- 34. Zheng K, Li Y, Wang S, et al. Inhibition of autophagosome‐lysosome fusion by ginsenoside Ro via the ESR2‐NCF1‐ROS pathway sensitizes esophageal cancer cells to 5‐fluorouracil‐induced cell death via the CHEK1‐mediated DNA damage checkpoint. Autophagy. 2016;12(9):1593‐1613. [DOI] [PMC free article] [PubMed] [Google Scholar]
- 35. Sun M, Ye Y, Xiao L, Duan X, Zhang Y, Zhang H. Anticancer effects of ginsenoside Rg3 (review). Int J Mol Med. 2017;39(3):507‐518. [DOI] [PubMed] [Google Scholar]


