

Summary
Panobinostat is a pan‐deacetylase inhibitor that modulates the expression of oncogenic and immune‐mediating genes involved in tumour cell growth and survival. We evaluated panobinostat‐induced post‐transplant responses and identified correlative biomarkers in patients with multiple myeloma who had failed to achieve a complete response after autologous transplantation. Patients received panobinostat 45 mg administered three‐times weekly (TIW) on alternate weeks of 28‐day cycles commencing 8–12 weeks post‐transplant. Twelve of 25 patients (48%) improved their depth of response after a median (range) of 4·3 (1·9–9·7) months of panobinostat. In responders, T‐lymphocyte histone acetylation increased after both three cycles (P < 0·05) and six cycles (P < 0·01) of panobinostat when compared to baseline, with no differences in non‐responders. The reduction in the proportion of CD127+CD8+ T cells and CD4:CD8 ratio was significantly greater, after three and six cycles of panobinostat compared to pre‐transplant, in non‐responders when compared to responders. Whole marrow RNA‐seq revealed widespread transcriptional changes only in responders with baseline differences in genes involved in ribosome biogenesis, oxidative phosphorylation and metabolic pathways. This study confirmed the efficacy of panobinostat as a single agent in multiple myeloma and established acetylation of lymphocyte histones, modulation of immune subsets and transcriptional changes as pharmacodynamic biomarkers of clinical benefit.
Introduction
Multiple myeloma (MM) is an incurable malignancy of plasma cells and while autologous stem cell transplantation (ASCT) remains an integral and effective component of first‐line therapy in newly diagnosed (NDMM) transplant eligible MM, 1 patients ultimately relapse. Strategies to delay relapse include post‐ASCT lenalidomide maintenance that improves depth of response, progression‐free survival (PFS) and overall survival (OS). 2 , 3 , 4 , 5
Panobinostat (LBH589) is a pan‐histone deacetylase inhibitor (HDACi) that modulates a diverse range of signalling pathways. 6 HDAC overexpression in MM is associated with inferior clinical outcome 7 and preclinical studies indicate that panobinostat has potent anti‐MM activity in combination with novel therapies. 8 , 9 , 10 , 11 Panobinostat has not been systematically evaluated as a single agent in MM; however, its activity in advanced MM in a Phase II trial by Wolf et al. 12 provided a rationale for further clinical evaluation. In this heavily pretreated cohort, durable partial responses of 19 and 28 months, respectively, were seen in two patients. Panobinostat combined with bortezomib and dexamethasone (Vd) when compared to Vd in relapsed and/or refractory MM (RRMM) was shown to improve PFS by 4 months in the intention‐to‐treat population, but by 8 months in a subset of more biologically adverse heavily treated patients. While the quality of responses with panobinostat‐Vd were superior, with a greater number of patients achieving a near‐complete response (nCR), 13 this did not translate into a statistically significant OS benefit. 14 Similarly, a Phase II single‐arm study of panobinostat plus Vd in V‐refractory patients, demonstrated that the addition of panobinostat led to the recovery of disease responses in 35% of patients. 15
The preclinical and Phase II data provided the rationale for our evaluation of panobinostat in treated MM that had demonstrated a suboptimal response to standard therapy. The study also afforded a unique platform for a range of correlative studies in the context of continuous exposure to panobinostat therapy.
Patients and methods
Study design
A two‐stage, Phase II, open‐label, single‐arm, single‐centre investigator‐initiated study. Newly diagnosed transplant‐eligible patients with MM were registered 4 weeks prior to front‐line ASCT between September 2012 and October 2015. The study was approved by the Alfred Health Human Research and Ethics Committee and conducted in accordance with the Declaration of Helsinki. The trial was registered with the Australian New Zealand Clinical Trials Registry (ANZCTR; ACTRN12613000219785. Further details regarding treatment regimen, assessment of response criteria, efficacy and health‐related quality of life (HRQoL) are outlined in the Supplementary methods (File S1).
T‐cell acetylation, immune profiling, RNA‐sequencing
Detailed description of methodology is described in the Supplementary methods (File S1).
Statistical methods
An initial cohort of 10 patients (Stage 1) was treated. If less than three converted to a very good partial response (VGPR)/CR (improved depth of response) the trial was to be terminated. Originally, if Stage 2 was opened, an additional 25 patients were to be treated and if the observed response rate was ≥20% (i.e. ≥7/35) then this would be considered to be promising evidence for further evaluation of the therapy. Due to slower than expected accrual, the trial was stopped during the second stage after a total of 25 patients had been enrolled, but the cut‐off for the observed rate (≥20%) was maintained. The type I error (false positive) rate was 5% for response rates of 12·4% and 11·0% in the original and executed designs, respectively, and the power was 80% for a response rate of 38·8% in the original design and 38·2% in the executed design. PFS and OS were calculated using the Kaplan–Meier product limit estimator and log‐rank test procedures in Statistical Analysis System (SAS), version 9.4. PFS and OS were measured from commencement of panobinostat and, in the case of PFS, to the date of relapse/progression or death from any cause, whichever occurred first. A total of 83 immune subset measurements were analysed using linear mixed models with random effects for patients and samples within patients, and, fixed effects for responder groups, times and their interaction followed by the F‐test (Supplemental methods, File S1).
Results
Patient characteristics
The median (range) age was 58 (44–69) years, median (range) prior treatment lines was 1 (1–2) and eight patients were International Staging System (ISS) 3. Induction therapy was with bortezomib‐cyclophosphamide‐dexamethasone (68%) or cyclophosphamide‐thalidomide‐dexamethasone (32%), with seven (28%) patients switching to an alternative treatment prior to ASCT because of a suboptimal response to initial therapy. Twenty had cytogenetics/ fluorescence in situ hybridisation (FISH) results available and five had poor risk abnormalities (Table I).
Table I.
Patient characteristics at time of registration prior to autologous stem cell transplantation (ASCT) and post‐ASCT disease response (of the 25 patients who failed to achieve CR and were subsequently treated with panobinostat)
| Patient and disease characteristics (n = 25) | ||
|---|---|---|
| Characteristic | Value | |
| Age, years, median (range) | 58 (44–69) | |
| Gender, M/F, n | 13/12 | |
| International Staging System, % | ||
| 1–2 | 68 | |
| 3 | 32 | |
| Treatment lines pre‐ASCT, n, median (range) | 1 (1–2) | |
| Induction treatment, n | First line | Second line* |
| Cyclophosphamide/thalidomide/dexamethasone | 8 | 3 |
| Bortezomib/cyclophosphamide/dexamethasone | 17 | 1 |
| Bortezomib/thalidomide/dexamethasone | – | 1 |
| Bortezomib/cyclophosphamide/dexamethasone/thalidomide | – | 2 |
| Cytogenetics/FISH, % | ||
| Standard risk | 80 | |
| Poor risk † | 20 | |
| Response post‐ASCT/pre‐panobinostat, % | ||
| SD | 8 | |
| PR | 64 | |
| VGPR | 28 | |
| ASCT to panobinostat, months, median (range) | 2·5 (1·6–4·0) | |
ASCT, autologous stem cell transplantation; CR, complete response; PR, partial response; SD, stable disease; VGPR, very good partial response.
Poor risk was defined as the presence of one or more of t(4;14), t(14;16), del17p, del13q and/or +1q).
Seven patients failed initial induction therapy (<partial response) and received a second line treatment.
Includes any of the following t(4;14), t(14;16), del17p, del13q, +1q.
Panobinostat‐induced deepening of responses
The median (range) time to commencing panobinostat was 2·5 (1·6–4·0) months. Six patients in Stage 1 improved their depth of response, enabling the trial to continue to Stage 2, but was stopped due to slow accrual. Estimated median potential follow‐up, by reverse Kaplan–Meier, was 47·1 months [95% confidence interval (CI) 33·8–56·5]. At last dates of contact, two patients remained on therapy and five patients had died. Reasons for treatment discontinuation were failure to improve depth of response, 8 disease progression, 10 non‐compliance, 2 toxicity 2 or withdrawal of consent. 1
A total of 20 patients completed the planned 6 months of therapy. Twelve patients (48%) improved their depth of response to VGPR or CR, four patients within 3 months of starting panobinostat and eight patients after 3–6 months of panobinostat (seven from PR to VGPR, one from PR to CR and four from VGPR to CR) and then continued on panobinostat maintenance. The median (range) time on panobinostat before achieving an improved response was 4·3 (1·9–9·7) months with the median (range) of 6·8 (4·0–12·0) months post‐ASCT to an improved response. Two patients then had an ongoing reduction in tumour burden with their best responses occurring after 11 and 29 months of panobinostat respectively.
Survival
From commencement of panobinostat the 3‐year PFS was 34·3% (95% CI 16·2–53·3%) and median PFS 23·0 months (95% CI 12·8–42·3, Fig 1A). Estimated 3‐year OS was 91·6% (95% CI 70·4–97·8%), the median OS was not reached (Fig 1B) and the first quartile of OS was 44·9 months [95% CI 14·0–NA (not available, not able to be calculated)]. There was a numerical, but not statistically significantly different (P = 0·120), improvement in PFS between the responders (Fig 2A) (median PFS 34·6 months, 95% CI 12·8–42·3) and non‐responders (15·4 months, 95% CI 4·4–33·0). The OS was not significantly different (P = 0·476) between responder groups (Fig 2B), but the first quartile of OS was 44·9 months (95% CI 39·9–NA) in patients who responded and 37·0 months (95% CI 14·0–NA) in patients who did not respond.
Fig 1.
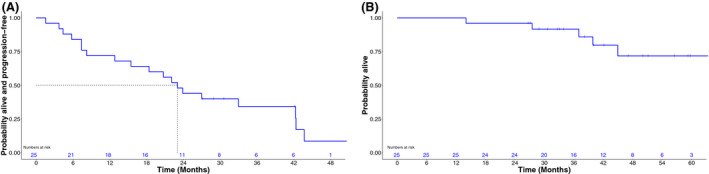
Progression‐free (A) and overall survival (B) as measured from the time of commencement of post‐autologous stem cell transplantation panobinostat.
Fig 2.
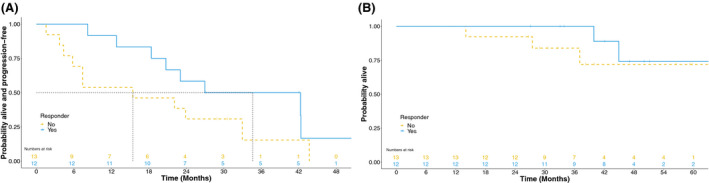
Comparison of progression‐free (A) and overall survival (B) between responders (n = 12) and non‐responders (n = 13) as measured from the time of commencement of post‐autologous stem cell transplantation panobinostat.
Safety
The most common haematological adverse events (AEs) were neutropenia and thrombocytopenia, with 29% and 25% of patients experiencing Grade 3–4 toxicity, respectively, and the non‐haematological AEs were diarrhoea 96%, nausea 86% and fatigue 83% (Table II). AEs leading to discontinuation were supraventricular tachycardia and gastrointestinal (GI) toxicity in one patient each. Four of 24 patients tolerated the initial dose of 45 mg. This included one patient out to cycle 47. In all, 20 of 24 patients required dose reductions, seven patients to 30 mg and 13 patients to 20 mg. The median tolerated dose was 20 mg with a median (range) time on panobinostat of 22·7 (17·2–43·9) months.
Table II.
Haematological toxicity [Common Terminology Criteria for Adverse Events (CTCAE) 4.0]
| Adverse events*, N (%) | All grades | Grade 3 | Grade 4 |
|---|---|---|---|
| Haematological | |||
| Neutropenia | 8 (33) | 6 (24) | 1 (4) |
| Thrombocytopenia | 10 (28) | 3 (12) | 3 (12) |
| Anaemia | 2 (8) | – | – |
| Non‐haematological † | |||
| Diarrhoea | 23 (96) | 4 (17) | – |
| Nausea | 21 (86) | 3 (13) | – |
| Fatigue | 20 (83) | – | – |
| Infection | 17 (71) | 12 (50) | – |
| URTI ‡ | 12 (50) | 2 (8) | – |
| Vomiting | 7 (29) | 2 (8) | – |
| LRTI § | 8 (33) | 3 (13) | – |
| Dysgeusia | 6 (25) | – | – |
LRTI, lower respiratory tract infection; URTI, upper respiratory tract infection.
CTCAE 4.0. Regardless of relatedness to study treatment.
Occurring in >20% of patients.
Upper respiratory tract infection.
Lower respiratory tract infection.
HRQoL
There was no significant variation in global health status across all time‐points. For the five functional scales, improvements were observed in social (P < 0·01) and emotional (P = 0·09) functioning, although the improvement in the latter did not appear to be durable (Table III). There were no sustained improvements in physical, role or cognitive functioning. For the symptom scales, HRQoL was generally improved at cycle three apart from greater nausea/vomiting (P < 0·01) and diarrhoea (P < 0·01) (Table IV).
Table III.
Principal non‐haematological toxicity [Common Terminology Criteria for Adverse Events (CTCAE) 4.0] regardless of relatedness to study treatment
| Health‐related quality of life (QLQ‐C30): functional scales* | ||||||||
|---|---|---|---|---|---|---|---|---|
| Pre‐Tx | Post‐Tx | EOC2 | EOC3 | EOC4 | EOC5 | EOC6 | P | |
| QLQ‐C30 scales, mean (SEM) | ||||||||
| Global Health Status | 60·03 (4·62) | 61·39 (4·62) | 56·19 (4·45) | 64·72 (4·51) | 55·84 (4·64) | 57·70 (4·57) | 58·88 (4·64) | 0·44 |
| Physical Functioning | 74·47 (3·97) | 75·54 (3·97) | 72·79 (3·87) | 80·32 (3·91) | 80·72 (3·98) | 78·13 (3·94) | 77·74 (3·98) | 0·13 |
| Role Functioning | 64·39 (6·84) | 63·51 (6·85) | 58·00 (6·65) | 69·31 (6·72) | 62·07 (6·87) | 63·46 (6·79) | 62·83 (6·87) | 0·64 |
| Emotional Functioning | 75·18 (4·64) | 76·04 (4·64) | 77·43 (4·51) | 84·48 (4·56) | 80·16 (4·65) | 74·18 (4·60) | 81·41 (4·71) | 0·09 |
| Cognitive Functioning | 80·75 (4·69) | 74·79 (4·69) | 79·30 (4·58) | 81·20 (4·62) | 79·09 (4·70) | 80·09 (4·66) | 79·62 (4·71) | 0·71 |
| Social Functioning | 53·58 (6·07) | 54·63 (6·08) | 63·35 (5·89) | 74·55 (5·96) | 63·64 (6·09) | 62·96 (6·02) | 65·41 (6·10) | <0·01 |
EOC, end of cycle; QLQ‐C30, quality of life questionnaire 30‐item core; Tx, treatment.
Mean (standard error of mean).
Table IV.
Health‐related quality of life (QLQ‐C30): symptom scales
| Health‐related quality of life (QLQ‐C30): symptom scales* | ||||||||
|---|---|---|---|---|---|---|---|---|
| Pre‐Tx | Post‐Tx | EOC2 | EOC3 | EOC4 | EOC5 | EOC6 | P | |
| QLQ‐C30 scales, mean (SEM) | ||||||||
| Fatigue | 38·95 (4·86) | 36·03 (4·89) | 41·1 (4·67) | 29·81 (4·75) | 34·01 (4·91) | 39·07 (4·83) | 32·52 (4·91) | 0·29 |
| Nausea and Vomiting | 2·43 (3·99) | 4·35 (3·99) | 15·9 (3·76) | 19·51 (3·84) | 21·65 (4·00) | 20·99 (3·92) | 14·77 (4) | <0·01 |
| Pain | 32·92 (6·34) | 32·52 (6·35) | 31·7 (6·14) | 25·98 (6·22) | 30·2 (6·37) | 34·24 (6·29) | 39·37 (6·37) | 0·42 |
| Dyspnoea | 14·4 (5·33) | 17·54 (5·33) | 25·34 (5·02) | 8·02 (5·13) | 14·64 (5·35) | 19·55 (5·23) | 16·52 (5·35) | 0·20 |
| Insomnia | 32·51 (6·52) | 29·69 (6·53) | 25·88 (6·24) | 18·54 (6·34) | 26·61 (6·55) | 31·97 (6·44) | 26·42 (6·55) | 0·45 |
| Appetite loss | 27·56 (6·0) | 26·43 (6·00) | 35·33 (5·65) | 22·99 (5·76) | 25·17 (6·16) | 23·90 (5·89) | 22·19 (6·02) | 0·59 |
| Constipation | 15·91 (4·61) | 5·93 (4·61) | 18·24 (4·42) | 11·45 (4·55) | 10·59 (4·63) | 11·19 (4·56) | 7·35 (4·63) | 0·13 |
| Diarrhoea | 3·96 (5·65) | 10·89 (5·66) | 18·91 (5·53) | 22·3 (5·44) | 21·49 (5·67) | 31·67 (5·55) | 25·93 (5·67) | <0·01 |
| Financial difficulties | 28·28 (6·65) | 38·37 (6·65) | 25·77 (6·48) | 16·39 (6·54) | 24·58 (6·67) | 27·64 (6·6) | 17·97 (6·67) | <0·01 |
EOC, end of cycle; QLQ‐C30, quality of life questionnaire 30‐item core; Tx, treatment.
Mean (standard error of mean).
Panobinostat‐induced T‐cell acetylation only occurs in responders
Panobinostat‐induced a significantly higher level of acetylation in T lymphocytes at the end of cycle three (EOC3) (H2B K5, H3 K9, H3 K14, H3 K56, H4 K8, H4 K12, H4 K16 (P < 0·01)) and EOC6 (all histones assessed, P < 0·05, Fig 3) in responders but not non‐responders compared to post‐ASCT. The levels of acetylation in alpha‐tubulin were not statistically significant (Fig 3, Tubulin panel).
Fig 3.
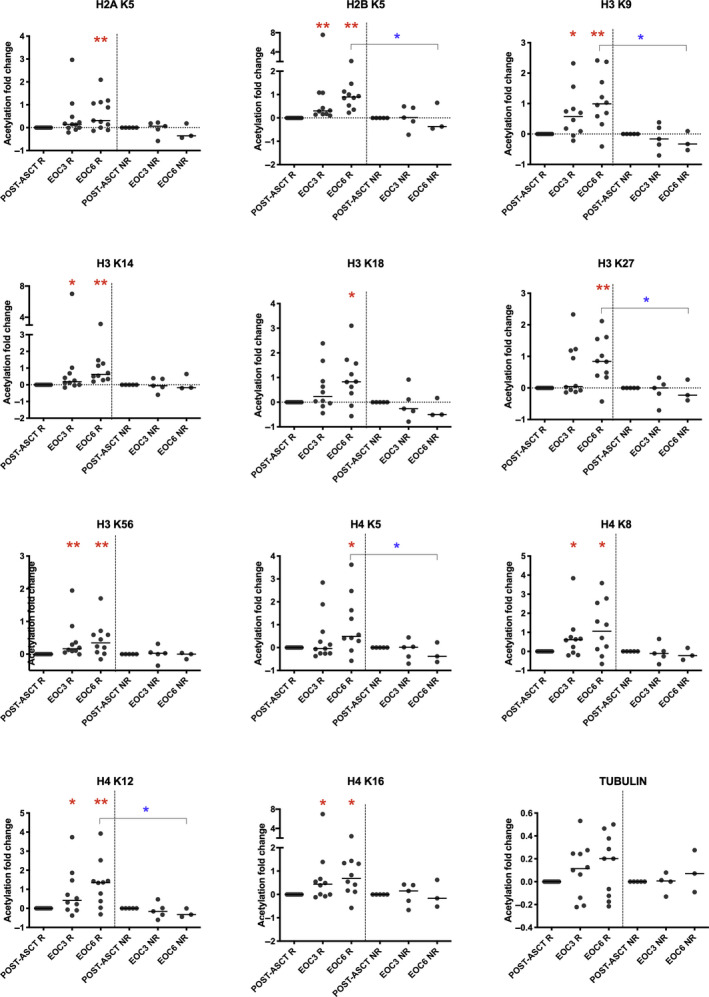
Acetylation is a pharmacodynamic marker of panobinostat. Flow cytometric analyses of peripheral blood CD3+ T lymphocytes were assessed for the presence of acetylation in lysine residues of histone proteins after panobinostat treatment in post‐ASCT, EOC3 and EOC6 in responders and non‐responders. Panobinostat‐induced a significantly higher level of acetylation in T lymphocytes at EOC3 (H2B K5, H3 K9, H3 K14, H3 K56, H4 K8, H4 K12, H4 K16) and EOC6 for all lysine residues assessed in responders compared to post‐ASCT. No significant increase in acetylation of any of the lysine residues in H2A, H2B, H3 or H4 at EOC3 or EOC6 compared to post‐ASCT was detected in non‐responders (red asterisks indicate differences from post‐ASCT within a group, blue asterisks indicate differences between groups). Post‐ASCT, post‐autologous stem cell transplantation; EOC3, end of cycle three; EOC6, end of cycle six; R, Responders; NR, Non‐responders; *P < 0·05; **P < 0·01.
T‐cell subset changes in response to panobinostat
Two of the 83 immune subset measurements had significant responder group by time interactions, namely the proportions of CD8+ T cells (P = 0·006) and the proportions of CD127+CD8+ T cells (P = 0·010). There was an increased proportion of CD8+ T cells at EOC3 and EOC6 when compared to pre‐/post‐ASCT and this increase was significantly greater in the non‐responders compared to responders (pre‐ASCT to EOC3, P = 0·0014, Fig 4A; post‐ASCT to EOC3, P = 0·026, data not shown and pre‐ASCT to EOC6, P = 0·013, Fig 4B). Similarly, the proportions of CD127+CD8+ T cells were reduced after treatment, but significantly less so in responders (pre‐ASCT to EOC3, P = 0·001, Fig 4C; post‐ASCT to EOC3, P = 0·031, data not shown and pre‐ASCT to EOC6, P = 0·036, Fig 4D). However, there were no differences in the absolute numbers of either of CD8+ or CD127+ T cells. We performed a log2 variance‐stabilising transformation of the CD4:CD8 ratio and found a significant two‐way interaction (P = 0·003). The CD4:CD8 ratio reduced in both responders and non‐responders at EOC3 and EOC6 when compared to pre‐/post‐ASCT, with a greater reduction in non‐responders than responders (pre‐ASCT to EOC3, P = 0·0009, Fig 4E; post‐ASCT to EOC3, P = 0·004, data not shown; pre‐ASCT to EOC6, P = 0·020, Fig 4F and post‐ASCT to EOC6, P = 0·052, data not shown).
Fig 4.
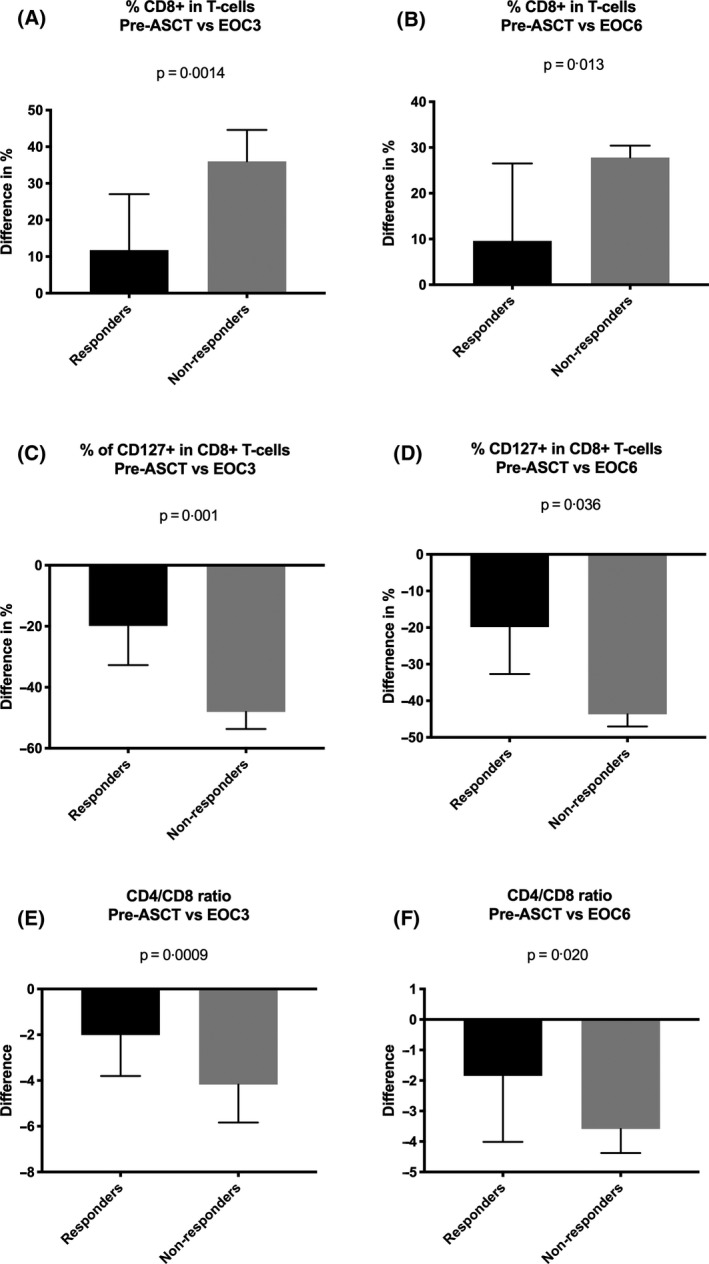
Panobinostat alters T‐cell subsets. Immune subset measurements were analysed using linear mixed models with random effects for patients and samples within patients, and, fixed effects for responder groups, times and their interaction. The F‐test was used to assess the responder group by time two‐way interaction with the level of significance set at 0·05. (A) Bar graph represents an increase in CD8+ T cells at EOC3 when compared to pre‐ASCT and this increase was significantly greater in the non‐responders compared to responders (P = 0·0014). (B) Bar graph represents an increase in CD8+ T cells at EOC6 when compared to pre‐ASCT and this increase was significantly greater in the non‐responders compared to responders (P = 0·013). (C) Bar graph represents difference in proportions of CD127+CD8+ T cells at EOC3 after treatment compared to pre‐ASCT and this reduction was significantly greater in non‐responders (P = 0·001). (D) Bar graph represents difference in proportions of CD127+CD8+ T cells at EOC6 after treatment compared to pre‐ASCT and this reduction was significantly greater in non‐responders (P = 0·036). (E) The CD4/CD8 ratio reduced in both responders and non‐responders at EOC3 compared to pre‐ASCT, with a significantly greater reduction in non‐responders than responders (P = 0·0009). (F) The CD4/CD8 ratio reduced in both responders and non‐responders at EOC6 compared to pre‐ASCT, with a significantly greater reduction in non‐responders than responders (P = 0·020). pre‐ASCT, pre‐autologous stem cell transplantation; EOC3, end of cycle three; EOC6, end of cycle six.
Responders demonstrate a widespread transcriptional response to panobinostat and manifest a different baseline transcriptome to non‐responders
RNA‐sequencing from post‐ASCT, EOC3 and EOC6 versus pre‐ASCT in responders demonstrated 43, 2482 or 2814 differentially regulated genes (DRG), respectively (Fig 5A), with only four, six and 16 DRGs, in non‐responders respectively (Fig 5B). DRGs at EOC3 and EOC6 (compared to pre‐ASCT) for responders revealed downregulation in a number of MM‐related genes, consistent with a reduction in MM tumour burden, including syndecan‐1 (SDC1 or CD138), bone morphogenetic protein 6 (BMP6), G‐protein coupled receptor family C group 5‐member D (GPRC5D), frizzled‐related protein (FRZB) and interferon regulatory factor 4 (IRF4) 16 , 17 , 18 , 19 , 20 , 21 (File S2). Consistent with the T‐cell acetylation, the expression of T‐cell receptor gene segments was also significantly altered at EOC3 versus post‐ASCT [T‐cell receptor alpha variable 9‐2 (TRAV9‐2), TRAV24 and T‐cell receptor gamma variable 8 (TRGV8)], EOC3 versus pre‐ASCT [T‐cell receptor delta variable 1 (TRDV1)] and EOC6 versus pre‐ASCT [T‐cell receptor alpha joining 25 (TRAJ25), TRAJ30, TRAV27, T‐cell receptor beta joining 2‐6 (TRBJ2‐6), T‐cell receptor beta variable 7‐7 (TRBV7‐7) and T‐cell receptor delta constant (TRDC); File S2]. Kyoto Encyclopedia of Genes and Genomes (KEGG) pathway analyses of the top 100 DRGs at EOC3 and EOC6 versus pre‐ASCT identified high‐level changes following treatment. At EOC3, pathways enriched included ‘insulin secretion’, ‘hippo signalling pathway’, ‘ovarian steroidogenesis’, ‘basal cell carcinoma’ and ‘proteoglycans in cancer’. Commonly involved genes included BMP6, Wnt family member 10A (WNT10A), WNT10B and GLI family zinc finger 2 (GLI2) (Figure S1A). At EOC6, pathways enriched included ‘calcium signalling pathway’, ‘cGMP‐PKG signalling pathway’ and’ ovarian steroidogenesis’. BMP6 was the common gene that occurred in more than one pathway at EOC6 (Figure S1B). RNA‐sequencing at baseline (responders vs. non‐responders) revealed a total of 958 DRG (File S2) with KEGG analyses revealing pathways including ‘ribosome’ (39 genes), ‘oxidative phosphorylation’ (21 genes), ‘metabolic pathways’ (95 genes) and ‘protein processing in endoplasmic reticulum’ (21 genes) (Fig 5C).
Fig 5.
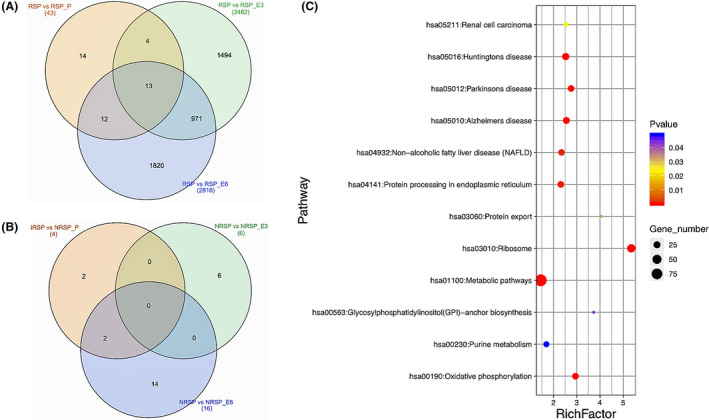
Differences in gene transcription before and after treatment between responders and non‐responders. (A) Venn diagram of the number of differentially expressed genes in post‐ASCT (beige), EOC3 (green) and EOC6 (blue) compared to pre‐ASCT in responders. (B) Venn diagram of the number of differentially expressed genes in post‐ASCT (beige), EOC3 (green) and EOC6 (blue) compared to pre‐ASCT in non‐responders. The total number of genes altered between specific subsets are recorded within brackets. The number of differentially expressed genes within each subset is recorded within the Venn diagram (C) Bubble chart of enriched KEGG pathways statistics between pre‐ASCT of responders and non‐responders. Rich factor is the ratio of the differentially expressed gene numbers to the total gene number in a certain pathway. The colour and size of the dots represent the range of the P value and the number of differentially expressed genes mapped to the indicated pathways respectively. Ribosome was the most significantly altered pathway, while metabolic pathways had the highest number of genes enriched between pre‐ASCT of responders and non‐responders. pre‐ASCT, pre‐autologous stem cell transplantation; post‐ASCT, post‐autologous stem cell transplantation; EOC3, end of cycle three; EOC6, end of cycle six; RSP, responders pre‐ASCT; RSP_P, responders post‐ASCT; RSP_E3, responders EOC3; RSP_E6, responders EOC6; NRSP; non‐responders pre‐ASCT; NRSP_P, non‐responders post‐ASCT; NRSP_E3, non‐responders EOC3; NRSP_E6, non‐responders EOC6.
Discussion
This is the first study to definitively demonstrate activity of single‐agent panobinostat in MM as part of front‐line treatment. Panobinostat consolidation was associated with an improvement in disease response in 48% of an intention‐to‐treat population with a suboptimal response following induction and ASCT. We hypothesise, based on the kinetics of response in the present study and case reports from Spanish investigators describing prolonged disease control with panobinostat maintenance 22 that extended exposure to panobinostat may be required for maximal anti‐MM effect. It is therefore not surprising that when used as a single agent in patients with advanced MM and an associated aggressive disease phenotype the observed anti‐MM impact was modest. 12
A limitation of our present study is the theoretical uncertainty around the possibility of spontaneous continuing response post‐ASCT. In the context of no maintenance, two recent studies have reported diametrically opposing experiences. Both looked at patients who had not achieved a CR, with a study from the Mayo Clinic 23 showing a 39% (167 of 430) continued response rate, but the other only 1% (one of 74). 24 We observed a 48% improvement in response with panobinostat, comparable to the 46% rate of improvement and associated better outcomes seen with ixazomib in the TOURMALINE‐MM3 trial (ClinicalTrials.gov Identifier: NCT02181413). 25 Two factors argue that our observations were secondary to panobinostat and not spontaneous. First, in the Mayo study 85% of those exhibiting a continued response were in VGPR post‐ASCT. The conversion rate from PR was 19% and only 6% in TOURMALINE‐MM3. In our present study, 50% of the PR patients improved their response. And second, and more importantly, responders but not non‐responders, demonstrated enhanced T‐cell acetylation and widespread transcriptional changes while on panobinostat, consistent with its mechanism of action, strongly arguing that the responses were panobinostat‐induced and not spontaneous.
The median PFS of 23 months from the time of commencing panobinostat is modest compared with that seen in a meta‐analysis of lenalidomide maintenance, showing a median PFS of 52·8 months (from diagnosis) 26 ; however, it should be recognised that our present study included only those patients with a suboptimal response to induction and ASCT (<CR) and their outcome, particularly when one considers the lead time prior (~6 months from diagnosis) to commencing panobinostat was comparable to those patients in the CALGB 100104 study (ClinicalTrials.gov number, NCT00114101) 2 with <CR at randomisation, the latter demonstrating a PFS of 37 months. Response to panobinostat in this study was associated with a median 20 months prolongation of PFS, and while the study was not powered to detect a statistically significant prolongation of PFS, this represents a clinically meaningful extension of PFS for those with panobinostat‐responsive disease. Importantly, a recent molecular profiling analysis from the Medical Research Council Myeloma IX 27 and XI 28 trials has demonstrated that the 33% of patients with MM with a high‐risk SKY92 (a 92‐gene prognostic signature, MMprofilerTM, SkylineDx) profile and/or two adverse risk translocations (‘double‐hit’) derive no benefit from lenalidomide maintenance. 29 This substantial proportion of patients represents a group where the excepted standard of care for maintenance is deficient and alternative, orally bioavailable agents, such as panobinostat need to be evaluated.
The dosing schedule selected in the present trial was based on a large Phase I study 30 and the CLBH589E2301 trial of panobinostat post‐ASCT for poor risk Hodgkin lymphoma. 31 In the former study, patients dosed with the every other week (QOW) schedule as opposed to every week (QW), had a lower incidence of Grade 3/4 thrombocytopenia and fewer dose reductions (resulting in higher average duration of exposure/relative dose intensity). Importantly, in patients dosed TIW QOW, acetylation in the peripheral blood mononuclear cells was maintained on the ‘non‐dose’ days. We observed a higher incidence of GI toxicity, although predominantly Grade 1 or 2 severity, that was reflected in the HRQoL symptom scoring, and was more prevalent than in the prior Phase I study 30 or when used in combination with bortezomib/dexamethasone. 13 We hypothesise that this may be related to the preceding high‐dose melphalan induced GI toxicity. And while most patients did not tolerate 45 mg TIW, QOW, the median tolerated dose being 20 mg TIW, responders continued panobinostat for a median (range) of 22·7 (17·2–43·9) months with AEs being manageable with dose reduction and supportive care.
The kinetics of response to panobinostat that we observed suggested, at least in part, an immunomodulatory mechanism of action, consistent with data showing that preserved immune function is a prerequisite for the anti‐cancer effect of histone deacetylase inhibition. 32 Previous clinical studies in MM with panobinostat or other HDACi did not examine acetylation or any correlation between clinical response and acetylation. 13 , 14 , 26 , 33 , 34 Therefore, for the first time, we demonstrate an association between increased acetylation and clinical response in MM, thereby highlighting the potential utility of this non‐invasive strategy as a pharmacodynamic marker of response.
Our correlative analyses demonstrate panobinostat‐induced T‐cell modulation that favours an anti‐tumour effect, consistent with published literature 35 with T‐lymphocyte lysine acetylation confirming a direct effect on the T‐cell repertoire. An increase in the proportion of CD8 T cells has been observed in metastatic melanoma with panobinostat; however, its relationship to clinical response was not reported, 36 whereas we observed a relatively higher proportion of CD8+ T cells in responders as compared to non‐responders. Moreover, we observed a higher proportion of CD127+CD8+ T cells (memory cells) in responders, with previous publications demonstrating a role for HDACi in de‐differentiating effector T cells to the more desirable memory cells that then enhances protective immunity. 37 , 38 , 39 Assessment of the CD4:CD8 T‐cell ratio indicated that this returned to pre‐ASCT levels by EOC6 in responders, but remained significantly low in non‐responders, consistent with a previous study describing a decline in CD4/CD8 ratio in the context of impending relapse. 40 Furthermore, expression of a number of T‐cell receptor gene segments were significantly altered in the responders, in agreement with the acetylation studies, suggesting potential panobinostat‐induced changes in antigen recognition and T‐cell adaptive immune responses. 41 While these results may indicate the potentiation of T‐cell responses against MM cells, it is unclear how the specific gene alterations might contribute mechanistically to an increased response in panobinostat‐responsive MM patients and this requires further investigation.
Analyses of DRG post‐HDACi treatment revealed modulation of WNT and BMP signalling recapitulating observations in other malignancies. 42 , 43 , 44 , 45 , 46 Transcriptomic differences were also clearly evident at baseline between responders and non‐responders; this was evident in the pathways altered. This included, ribosome biogenesis with upregulation of ribosome biogenesis a recognised feature of poor prognosis cancers (reviewed in 47 ) and impaired regulation of ribosomes known to inhibit proliferation through check point blockade, 48 oxidative phosphorylation wherein we have shown that abrogating oxidative phosphorylation via beta‐catenin inhibition can be utilised to overcome resistance to panobinostat 49 and metabolic pathways with recent data suggesting that metabolic adaptation in MM may influence both the natural history and prognosis of the disease. 50 , 51
Based on the clinical impact, acetylation, immunological and transcriptional effects observed in the present study, we propose that the optimal strategy for the utilisation of panobinostat in MM is yet to be determined. However, it would be of value to explore panobinostat for the eradication of persisting minimal residual disease and as a potential maintenance therapy in patients with biologically adverse MM.
Author contributions
Sridurga Mithraprabhu, Anna Kalff, Kate H. Gartlan, Ioanna Savvidou, Tiffany Khong and Malarmathy Ramachandran performed experiments; Sridurga Mithraprabhu, Anna Kalff, Kate H. Gartlan, Ioanna Savvidou, Tiffany Khong, Geoffrey R. Hill, John Reynolds and Andrew Spencer analysed data and prepared figures; Anna Kalff, Rachel E. Cooke, Kathryn Bowen and Andrew Spencer were involved in conduct of the study, Andrew Spencer designed the study; Sridurga Mithraprabhu, Anna Kalff and Andrew Spencer wrote the manuscript. All authors were responsible for approving final version of manuscript.
Conflict of interest
The authors declare no competing financial interests.
Supporting information
Supplementary S1. Detailed description of materials and methods, supplementary tables 1 (antibody panel) and 2 (EORTC‐QLQ‐C30 expanded table) and supplementary figure 1 (KEGG pathway analyses for genes upregulated at end of cycle 3 (1A) and end of cycle 6 (1B) following panobinostat treatment.
Supplementary S2. Excel file containing differentially expressed gene list following RNA‐sequencing between Post‐ASCT vs EOC3, Pre‐ASCT vs EOC3, Post‐ASCT vs EOC6, Pre‐ASCT vs EOC6, Pre‐ASCT (RSP) vs Pre‐ASCT (NRSP) (EOC3 ‐ end of cycle 3, EOC6 ‐ end of cycle 6, ASCT ‐ autologous stem cell transplant, RSP ‐ responders, NRSP ‐ non‐responders.
Acknowledgements
The authors thank staff and patients at the Alfred Hospital Malignant Haematology and Stem Cell Transplantation Unit. [Correction added on 16 January 2021, after the first online publication. The acknowledgements section has been updated in this current version.]
References
- 1. Attal M, Lauwers‐Cances V, Hulin C, Leleu X, Caillot D, Escoffre M, et al. Lenalidomide, bortezomib, and dexamethasone with transplantation for myeloma. N Engl J Med. 2017;376:1311–20. [DOI] [PMC free article] [PubMed] [Google Scholar]
- 2. McCarthy PL, Owzar K, Hofmeister CC, Hurd DD, Hassoun H, Richardson PG, et al. Lenalidomide after stem‐cell transplantation for multiple myeloma. N Engl J Med. 2012;366:1770–81. [DOI] [PMC free article] [PubMed] [Google Scholar]
- 3. Attal M, Lauwers‐Cances V, Marit G, Caillot D, Moreau P, Facon T, et al. Lenalidomide maintenance after stem‐cell transplantation for multiple myeloma. N Engl J Med. 2012;366:1782–91. [DOI] [PubMed] [Google Scholar]
- 4. Palumbo A, Hajek R, Delforge M, Kropff M, Petrucci MT, Catalano J, et al. Continuous lenalidomide treatment for newly diagnosed multiple myeloma. N Engl J Med. 2012;366:1759–69. [DOI] [PubMed] [Google Scholar]
- 5. Jackson G, Davies FE, Pawlyn C, Cairns D, Striha A, Hockaday A, et al. Lenalidomide Maintenance Significantly Improves Outcomes Compared to Observation Irrespective of Cytogenetic Risk: Results of the Myeloma XI Trial. Blood. 2017;130(Suppl 1):436. [Google Scholar]
- 6. Choudhary C, Kumar C, Gnad F, Nielsen ML, Rehman M, Walther TC, et al. Lysine acetylation targets protein complexes and co‐regulates major cellular functions. Science. 2009;325:834–40. [DOI] [PubMed] [Google Scholar]
- 7. Mithraprabhu S, Kalff A, Chow A, Khong T, Spencer A. Dysregulated Class I histone deacetylases are indicators of poor prognosis in multiple myeloma. Epigenetics. 2014;9:1511–20. [DOI] [PMC free article] [PubMed] [Google Scholar]
- 8. Mithraprabhu S, Khong T, Jones SS, Spencer A. Histone deacetylase (HDAC) inhibitors as single agents induce multiple myeloma cell death principally through the inhibition of class I HDAC. Br J Haematol. 2013;162:559–62. [DOI] [PubMed] [Google Scholar]
- 9. Hideshima T, Bradner JE, Wong J, Chauhan D, Richardson P, Schreiber SL, et al. Small‐molecule inhibition of proteasome and aggresome function induces synergistic antitumor activity in multiple myeloma. Proc Natl Acad Sci USA. 2005;102:8567–72. [DOI] [PMC free article] [PubMed] [Google Scholar]
- 10. Hideshima T, Richardson PG, Anderson KC. Mechanism of action of proteasome inhibitors and deacetylase inhibitors and the biological basis of synergy in multiple myeloma. Mol Cancer Ther. 2011;10:2034–42. [DOI] [PMC free article] [PubMed] [Google Scholar]
- 11. Mithraprabhu S, Khong T, Spencer A. Overcoming inherent resistance to histone deacetylase inhibitors in multiple myeloma cells by targeting pathways integral to the actin cytoskeleton. Cell Death Dis. 2014;5:e1134. [DOI] [PMC free article] [PubMed] [Google Scholar]
- 12. Wolf JL, Siegel D, Goldschmidt H, Hazell K, Bourquelot PM, Bengoudifa BR, et al. Phase II trial of the pan‐deacetylase inhibitor panobinostat as a single agent in advanced relapsed/refractory multiple myeloma. Leuk Lymphoma. 2012;53:1820–3. [DOI] [PubMed] [Google Scholar]
- 13. San‐Miguel JF, Hungria VT, Yoon SS, Beksac M, Dimopoulos MA, Elghandour A, et al. Panobinostat plus bortezomib and dexamethasone versus placebo plus bortezomib and dexamethasone in patients with relapsed or relapsed and refractory multiple myeloma: a multicentre, randomised, double‐blind phase 3 trial. Lancet Oncol. 2014;15:1195–206. [DOI] [PubMed] [Google Scholar]
- 14. San‐Miguel JF, Hungria VT, Yoon SS, Beksac M, Dimopoulos MA, Elghandour A, et al. Overall survival of patients with relapsed multiple myeloma treated with panobinostat or placebo plus bortezomib and dexamethasone (the PANORAMA 1 trial): a randomised, placebo‐controlled, phase 3 trial. Lancet Haematol. 2016;3:e506–e515. [DOI] [PubMed] [Google Scholar]
- 15. Richardson PG, Schlossman RL, Alsina M, Weber DM, Coutre SE, Gasparetto C, et al. PANORAMA 2: panobinostat in combination with bortezomib and dexamethasone in patients with relapsed and bortezomib‐refractory myeloma. Blood. 2013;122:2331–7. [DOI] [PubMed] [Google Scholar]
- 16. Atamaniuk J, Gleiss A, Porpaczy E, Kainz B, Grunt TW, Raderer M, et al. Overexpression of G protein‐coupled receptor 5D in the bone marrow is associated with poor prognosis in patients with multiple myeloma. Eur J Clin Invest. 2012;42:953–60. [DOI] [PubMed] [Google Scholar]
- 17. Kodama T, Kochi Y, Nakai W, Mizuno H, Baba T, Habu K, et al. Anti‐GPRC5D/CD3 bispecific T‐cell‐redirecting antibody for the treatment of multiple myeloma. Mol Cancer Ther. 2019;18:1555–64. [DOI] [PubMed] [Google Scholar]
- 18. Moreaux J, Klein B, Bataille R, Descamps G, Maiga S, Hose D, et al. A high‐risk signature for patients with multiple myeloma established from the molecular classification of human myeloma cell lines. Haematologica. 2011;96:574–82. [DOI] [PMC free article] [PubMed] [Google Scholar]
- 19. Shaffer AL, Emre NC, Lamy L, Ngo VN, Wright G, Xiao W, et al. IRF4 addiction in multiple myeloma. Nature. 2008;454:226–31. [DOI] [PMC free article] [PubMed] [Google Scholar]
- 20. Smith EL, Harrington K, Staehr M, Masakayan R, Jones J, Long TJ, et al. GPRC5D is a target for the immunotherapy of multiple myeloma with rationally designed CAR T cells. Sci Transl Med. 2019;11(485):eaau7746. [DOI] [PMC free article] [PubMed] [Google Scholar]
- 21. van Andel H, Kocemba KA, Spaargaren M, Pals ST. Aberrant Wnt signaling in multiple myeloma: molecular mechanisms and targeting options. Leukemia. 2019;33:1063–75. [DOI] [PMC free article] [PubMed] [Google Scholar]
- 22. Ocio EM, Davila J, Caballero JC, Alonso S, de la Calle VG, Garcia‐Sanz R, et al. Evidence of long‐term disease control with panobinostat maintenance in patients with relapsed multiple myeloma. Haematologica. 2015;100:e289–e291. [DOI] [PMC free article] [PubMed] [Google Scholar]
- 23. Gonsalves WI, Gertz MA, Dispenzieri A, Lacy MQ, Lin Y, Singh PP, et al. Implications of continued response after autologous stem cell transplantation for multiple myeloma. Blood. 2013;122:1746–9. [DOI] [PMC free article] [PubMed] [Google Scholar]
- 24. Fernandez de Larrea C, Davila J, Isola I, Ocio EM, Rosinol L, Garcia‐Sanz R, et al. Absence of spontaneous response improvement beyond day +100 after autologous stem cell transplantation in multiple myeloma. Bone Marrow Transplant. 2017;52:567–9. [DOI] [PubMed] [Google Scholar]
- 25. Goldschmidt H, Dimopoulos MA, Rajkumar SV, Weisel KC, Moreau P, Chng WJ, et al. Deepening responses associated with improved progression‐free survival with ixazomib versus placebo as posttransplant maintenance in multiple myeloma. Leukemia. 2020. [Online ahead of print]. 10.1038/s41375-020-0819-8 [DOI] [PMC free article] [PubMed] [Google Scholar]
- 26. Kaufman JL, Mina R, Jakubowiak AJ, Zimmerman TL, Wolf JJ, Lewis C, et al. Combining carfilzomib and panobinostat to treat relapsed/refractory multiple myeloma: results of a Multiple Myeloma Research Consortium Phase I Study. Blood Cancer J. 2019;9:3. [DOI] [PMC free article] [PubMed] [Google Scholar]
- 27. Morgan GJ, Davies FE, Gregory WM, Bell SE, Szubert AJ, Cook G, et al. Long‐term follow‐up of MRC Myeloma IX trial: Survival outcomes with bisphosphonate and thalidomide treatment. Clin Cancer Res. 2013;19:6030–8. [DOI] [PubMed] [Google Scholar]
- 28. Jackson GH, Davies FE, Pawlyn C, Cairns DA, Striha A, Collett C, et al. Lenalidomide maintenance versus observation for patients with newly diagnosed multiple myeloma (Myeloma XI): a multicentre, open‐label, randomised, phase 3 trial. Lancet Oncol. 2019;20:57–73. [DOI] [PMC free article] [PubMed] [Google Scholar]
- 29. Shah V, Sherborne AL, Johnson DC, Ellis S, Price A, Chowdhury F, et al. Predicting ultrahigh risk multiple myeloma by molecular profiling: an analysis of newly diagnosed transplant eligible myeloma XI trial patients. Leukemia. 2020. [Online ahead of print]. 10.1038/s41375-020-0750-z [DOI] [PMC free article] [PubMed] [Google Scholar]
- 30. DeAngelo DJ, Spencer A, Bhalla KN, Prince HM, Fischer T, Kindler T, et al. Phase Ia/II, two‐arm, open‐label, dose‐escalation study of oral panobinostat administered via two dosing schedules in patients with advanced hematologic malignancies. Leukemia. 2013;27:1628–36. [DOI] [PubMed] [Google Scholar]
- 31. Von Tresckow BSA, Lisukov I, Srivastava S, Morgan DS, Morschhauser F, et al. Phase III randomized, double blind, placebo controlled multi‐center study of panobinostat for maintenance of response in patients with Hodgkin lymphoma who are at risk for relapse after high dose chemotherapy and autologous stem cell transplant: final results after early trial discontinuation. Blood. 2013;122:4648. [Google Scholar]
- 32. West AC, Mattarollo SR, Shortt J, Cluse LA, Christiansen AJ, Smyth MJ, et al. An intact immune system is required for the anticancer activities of histone deacetylase inhibitors. Cancer Res. 2013;73:7265–76. [DOI] [PubMed] [Google Scholar]
- 33. San‐Miguel JF, Hungria VTM, Yoon SS, Beksac M, Dimopoulos MA, Elghandour A, et al. Panobinostat plus bortezomib and dexamethasone: impact of dose intensity and administration frequency on safety in the PANORAMA 1 trial. Br J Haematol. 2017;179:66–74. [DOI] [PubMed] [Google Scholar]
- 34. Richardson PG, Hungria VT, Yoon SS, Beksac M, Dimopoulos MA, Elghandour A, et al. Panobinostat plus bortezomib and dexamethasone in previously treated multiple myeloma: outcomes by prior treatment. Blood. 2016;127:713–21. [DOI] [PMC free article] [PubMed] [Google Scholar]
- 35. Kroesen M, Gielen P, Brok IC, Armandari I, Hoogerbrugge PM, Adema GJ. HDAC inhibitors and immunotherapy; a double edged sword? Oncotarget. 2014;5:6558–72. [DOI] [PMC free article] [PubMed] [Google Scholar]
- 36. Ibrahim N, Buchbinder EI, Granter SR, Rodig SJ, Giobbie‐Hurder A, Becerra C, et al. A phase I trial of panobinostat (LBH589) in patients with metastatic melanoma. Cancer Med. 2016;5:3041–50. [DOI] [PMC free article] [PubMed] [Google Scholar]
- 37. Wang J, Hasan F, Frey AC, Li HS, Park J, Pan K, et al. Histone deacetylase inhibitors and IL21 cooperate to reprogram human effector CD8+ T cells to memory T cells. Cancer. Immunol Res. 2020. [Online ahead of print]. 10.1158/2326-6066 [DOI] [PMC free article] [PubMed] [Google Scholar]
- 38. Laino AS, Betts BC, Veerapathran A, Dolgalev I, Sarnaik A, Quayle SN, et al. HDAC6 selective inhibition of melanoma patient T‐cells augments anti‐tumor characteristics. J Immunother Cancer. 2019;7:33. [DOI] [PMC free article] [PubMed] [Google Scholar]
- 39. Zhang F, Zhou X, DiSpirito JR, Wang C, Wang Y, Shen H. Epigenetic manipulation restores functions of defective CD8(+) T cells from chronic viral infection. Mol Ther. 2014;22:1698–706. [DOI] [PMC free article] [PubMed] [Google Scholar]
- 40. Kay NE, Leong TL, Bone N, Vesole DH, Greipp PR, Van Ness B, et al. Blood levels of immune cells predict survival in myeloma patients: results of an Eastern Cooperative Oncology Group phase 3 trial for newly diagnosed multiple myeloma patients. Blood. 2001;98:23–8. [DOI] [PubMed] [Google Scholar]
- 41. Rossjohn J, Gras S, Miles JJ, Turner SJ, Godfrey DI, McCluskey J. T cell antigen receptor recognition of antigen‐presenting molecules. Annu Rev Immunol. 2015;33:169–200. [DOI] [PubMed] [Google Scholar]
- 42. Keil KP, Altmann HM, Abler LL, Hernandez LL, Vezina CM. Histone acetylation regulates prostate ductal morphogenesis through a bone morphogenetic protein‐dependent mechanism. Dev Dyn. 2015;244:1404–14. [DOI] [PMC free article] [PubMed] [Google Scholar]
- 43. Qin G, Li Y, Xu X, Wang X, Zhang K, Tang Y, et al. Panobinostat (LBH589) inhibits Wnt/beta‐catenin signaling pathway via upregulating APCL expression in breast cancer. Cell Signal. 2019;59:62–75. [DOI] [PubMed] [Google Scholar]
- 44. Gotze S, Coersmeyer M, Muller O, Sievers S. Histone deacetylase inhibitors induce attenuation of Wnt signaling and TCF7L2 depletion in colorectal carcinoma cells. Int J Oncol. 2014;45:1715–23. [DOI] [PubMed] [Google Scholar]
- 45. Shieh JM, Tang YA, Hu FH, Huang WJ, Wang YJ, Jen J, et al. A histone deacetylase inhibitor enhances expression of genes inhibiting Wnt pathway and augments activity of DNA demethylation reagent against nonsmall‐cell lung cancer. Int J Cancer. 2017;140:2375–86. [DOI] [PubMed] [Google Scholar]
- 46. Liu C, Zhang Y, Li J, Wang Y, Ren F, Zhou Y, et al. p15RS/RPRD1A (p15INK4b‐related sequence/regulation of nuclear pre‐mRNA domain‐containing protein 1A) interacts with HDAC2 in inhibition of the Wnt/beta‐catenin signaling pathway. J Biol Chem. 2015;290:9701–13. [DOI] [PMC free article] [PubMed] [Google Scholar]
- 47. Pelletier J, Thomas G, Volarevic S. Ribosome biogenesis in cancer: new players and therapeutic avenues. Nat Rev Cancer. 2018;18:51–63. [DOI] [PubMed] [Google Scholar]
- 48. Volarevic S, Stewart MJ, Ledermann B, Zilberman F, Terracciano L, Montini E, et al. Proliferation, but not growth, blocked by conditional deletion of 40S ribosomal protein S6. Science. 2000;288:2045–7. [DOI] [PubMed] [Google Scholar]
- 49. Spencer A, Savvidou I, Khong T, Mithraprabhu S. Panobinostat (LBH589) in combination with the & #x3b2;‐catenin inhibitor Tegavivint (BC2059) exerts significant anti‐myeloma activity both in vitro and in vivo. Clin Lymphoma Myeloma Leuk. 2019;19:e137. [DOI] [PMC free article] [PubMed] [Google Scholar]
- 50. El Arfani C, De Veirman K, Maes K, De Bruyne E, Menu E. Metabolic features of multiple myeloma. Int J Mol Sci. 2018;19:1200. 10.3390/ijms19041200 [DOI] [PMC free article] [PubMed] [Google Scholar]
- 51. Steiner N, Muller U, Hajek R, Sevcikova S, Borjan B, Johrer K, et al. The metabolomic plasma profile of myeloma patients is considerably different from healthy subjects and reveals potential new therapeutic targets. PLoS One. 2018;13:e0202045. [DOI] [PMC free article] [PubMed] [Google Scholar]
Associated Data
This section collects any data citations, data availability statements, or supplementary materials included in this article.
Supplementary Materials
Supplementary S1. Detailed description of materials and methods, supplementary tables 1 (antibody panel) and 2 (EORTC‐QLQ‐C30 expanded table) and supplementary figure 1 (KEGG pathway analyses for genes upregulated at end of cycle 3 (1A) and end of cycle 6 (1B) following panobinostat treatment.
Supplementary S2. Excel file containing differentially expressed gene list following RNA‐sequencing between Post‐ASCT vs EOC3, Pre‐ASCT vs EOC3, Post‐ASCT vs EOC6, Pre‐ASCT vs EOC6, Pre‐ASCT (RSP) vs Pre‐ASCT (NRSP) (EOC3 ‐ end of cycle 3, EOC6 ‐ end of cycle 6, ASCT ‐ autologous stem cell transplant, RSP ‐ responders, NRSP ‐ non‐responders.