

Abstract
Aim
This study was designed to determine whether faecal regenerating 1B protein (REG1B) concentration is associated with physical growth among 6–30‐month‐old children in rural Malawi.
Methods
This was a secondary analysis from a randomised controlled trial in rural Malawi in which we followed‐up 790 live‐born infants from birth to 30 months of age. We collected anthropometric data at the age of 6, 12, 18, 24 and 30 months. We measured faecal REG1B concentration by enzyme‐linked immunosorbent assay (ELISA) technique using stool samples collected at 6, 18 and 30 months of age. We assessed the association between faecal REG1B concentration and children's physical growth using linear regression and longitudinal data analysis.
Results
Of 790 live‐born infants enrolled, 694 (87%) with at least one faecal REG1B concentration measurement were included in the analysis. Faecal REG1B concentration was not associated with the children's concurrent length‐for‐age z‐score (LAZ), weight‐for‐age z‐score (WAZ), weight‐for‐length z‐score (WLZ) and mid‐upper arm circumference‐for‐age z‐score (MUACZ) at any time point (P > 0.05), nor with a change in their anthropometric indices in the subsequent 6‐month period (P > 0.05).
Conclusions
Faecal REG1B concentration is not associated with LAZ, WAZ, WLZ and MUACZ among 6–30‐month‐old infants and children in rural Malawi.
Keywords: child growth, intestinal repair, regenerating 1B protein, rural Malawi
What is already known on this topic
Linear growth faltering, i.e., stunting, commonly affects children in Sub‐Saharan Africa and other low‐resource settings.
Intestinal inflammation and environmental enteric dysfunction are believed to play an important role in contributing to childhood stunting.
Faecal concentration of regenerating 1B protein (REG1B), an intestinal repair marker, has been shown to predict stunting among infants and young children in Peru and Bangladesh.
What this paper adds
Faecal REG1B concentration was not associated with attained size among 6‐, 18‐ or 30‐month‐old children in rural Malawi.
Faecal REG1B concentration was not associated with subsequent growth among 6–30‐month‐old children in rural Malawi.
Faecal REG1B concentration may not be a sensitive biomarker of child growth in rural Sub‐Saharan Africa.
Childhood stunting, defined as being too short for age, is estimated to affect globally 149 million children under 5 years old. Ninety per cent of these children live in Southern Asia and Sub‐Saharan Africa. 1 Stunting can contribute to serious consequences, such as increased mortality, poor cognition, chronic diseases and even low career attainment in adults. 2 , 3 , 4 , 5 , 6 Therefore, there is a pressing need to prevent childhood stunting.
One approach for prevention is identifying those children who are at the highest risk of stunting and targeting interventions to them. Measuring biomarkers from stool samples provides a non‐invasive way to assess the risk of growth faltering. 7 Regenerating 1B protein (REG1B), related to intestinal repair, is one such possible biomarker. Its stool concentration has been shown to reflect intestinal inflammation which is a main contributor to stunting. 8 , 9 , 10 , 11 A cohort study in Bangladesh found that faecal REG1B concentration was associated with growth shortfall among children under 2 years old. Additionally, a similar association was found among children in Peru. 12 However, there is still limited evidence on the association between REG1B and linear growth and none from Africa.
The aim of our analysis was to analyse REG1B concentration from stool samples and determine whether faecal REG1B concentration was associated with physical growth of infants and young children in rural Malawi. Specifically, we were interested in assessing the association of REG1B concentration with attained body size and change in body size.
Materials and Methods
Study site and design
This is a secondary analysis of data that were collected in a randomised controlled trial conducted in two hospitals (Mangochi, Malindi) and two health centres (Lungwena, Namwera) in Mangochi District, rural Malawi, South‐East Africa between February 2011 and April 2015. Details of this trial have been described elsewhere. 13 The total population in the study area was about 190 000 and most of them spoke Chiyao and subsisted on farming and fishing.
In brief, pregnant women with less than 20 completed gestation weeks were enrolled and randomly allocated into three groups, receiving daily 60 mg iron +400 μg folic acid (IFA) in IFA group, a tablet of multiple micronutrients (MMN) in MMN group or 20 g of lipid‐based nutrient supplements (LNS) in LNS group as interventions. After delivery, 790 live‐born infants were followed up until age of 30 months. Clinic and home visits were conducted to collect both data using questionnaires and biological samples. Further details of trial design and its main outcomes have been published earlier. 14 The study was approved by ethics committees in Malawi (College of Medicine) and Finland (Pirkanmaa Hospital District) and performed in accordance with the principles of Helsinki declaration and regulatory guidelines in Malawi. Written informed consents were obtained from caregivers.
Stool samples collection
Research Assistants collected stool samples which had been placed in collection containers by mothers on the same day during home visits at 6, 18 and 30 months. The samples were on receipt immediately put in cooler bags. If the child had diarrhoea, sample collection was postponed by 2 weeks. The Research Assistants transported the samples in cooler bags to the site laboratory and laboratory technicians aliquoted the samples to cryovial tubes and stored them first in a −20°C freezer. Within 48 h, the samples were transported to a central laboratory where they were frozen at −80°C until being shipped on dry ice to Tampere University of Finland for analysis.
Measurement of REG1B concentration
An enzyme‐linked immunosorbent assay (ELISA) technique (TECHLAB, Inc., Blacksburg, VA, USA) was used to quantify REG1B concentration in stool samples. Samples were diluted at 1:10 000 before adding 100 μL of standards, controls and stool samples in duplicates to plates with pre‐coated immobilised polyclonal antibody against REG1B. The plates were incubated at 37°C for 20 min followed by shaking and five times of washing before adding conjugate solution into each well. The incubation and washing were then repeated before adding substrate solution, followed by incubating for 15 min at room temperature. After adding stop solution, plates were read using optical density (OD) 450/620 nm (Multiskan FC Microplate Photometer, Thermo Fisher Scientific Inc., Waltham, MA, USA). The linear standard curve was made by plotting standard absorbance against standard concentration to calculate REG1B concentration. Concentration was expressed as μg/g.
Anthropometric measurements
Anthropometric measurements of children were taken by trained study staff at clinic visits at 6, 12, 18, 24 and 30 months. The staff measured length or height to 1 mm using a length board (Harpenden Infantometer, Holtain Limited, Crosswell, UK) and weight with reading increments of 10 g using an electronic infant weighing scale (SECA 735) and a digital adult weighing scale (SECA 874). Also, they measured mid upper arm circumference (MUAC) and head circumference to 1 mm with the use of non‐stretchable plastic insertion tapes. We calculated length‐for‐age z‐score (LAZ), weight‐for‐age z‐score (WAZ), weight‐for‐length z‐score (WLZ), head circumference‐for‐age z‐score (HCZ) and mid‐upper arm circumference‐for‐age z‐score (MUACZ) using World Health Organisation Child Growth Standards. 15 Change in z‐score was calculated by subtracting the anthropometric z‐score at the end of the interval of interest from that at the beginning of the interval.
Other information
Baseline information of mothers and infants was obtained at both home and clinical visits. Maternal body mass index (BMI) and HIV infection was assessed at enrolment. Maternal malaria was diagnosed by the Rapid Diagnosis Test using Clearview Malaria Combo (British Biocell International Ltd., Dundee, UK). Research nurses recorded duration of pregnancy, infant sex and birthweight. Trained study staff collected breastfeeding information using questionnaires. Information on household food insecurity, expressed as household food insecurity access scores, 16 was also collected to assess the situation of household food intake in the past month.
Statistical analysis
Statistical analyses were performed with STATA version 15.0 (StataCorp, College Station, TX, USA). The definition of age for 6, 12, 18, 24 and 30 months was 20–32 weeks, 46–58 weeks, 72–84 weeks, 98–110 weeks and 124–136 weeks, respectively. Linear regression models were used to analyse the association between REG1B concentration at 6, 18 and 30 months and anthropometric data at the same time point respectively, and the association between REG1B concentration at 6 or 18 months and change in anthropometric z‐score in subsequent 6 months. Random effects model was used to estimate the association between repeated anthropometric indices at 6, 18 and 30 months and repeated faecal REG1B concentration also from the same multiple time points. Models were adjusted for child age, birthweight, breastfeeding after delivery (yes/no), maternal HIV infection (positive/negative), child sex, duration of pregnancy, maternal malaria (positive/negative) and household food insecurity access scores. These variables were selected as potential confounders in advance of the analysis, as recommended in a recent textbook on statistical analysis of child growth. 17 To better understand the impact of possible confounders, we present as also unadjusted analyses as Supplementary tables. For the repeated measurement analysis, adjustment for child age was included also in the sensitivity analysis because of the strong association between it and the children's intestinal biomarker concentration. The numbers of participants included were different in different models because of missing values in REG1B data at different visit times.
Results
Of the 790 live‐born infants enrolled in the study, 735 (93%) were still in follow‐up at 6 months, 699 (88%) at 18 months and 668 (85%) at 30 months of age. A total of 694 children (87% of those born alive) provided REG1B data on at least one time point and were thus included in the analysis (Fig. 1). Children whose data were not included in the analysis were born after a shorter mean duration of pregnancy, had smaller mean birthweight and were less frequently breastfed after birth than those included in the analysis (Table 1).
Fig 1.
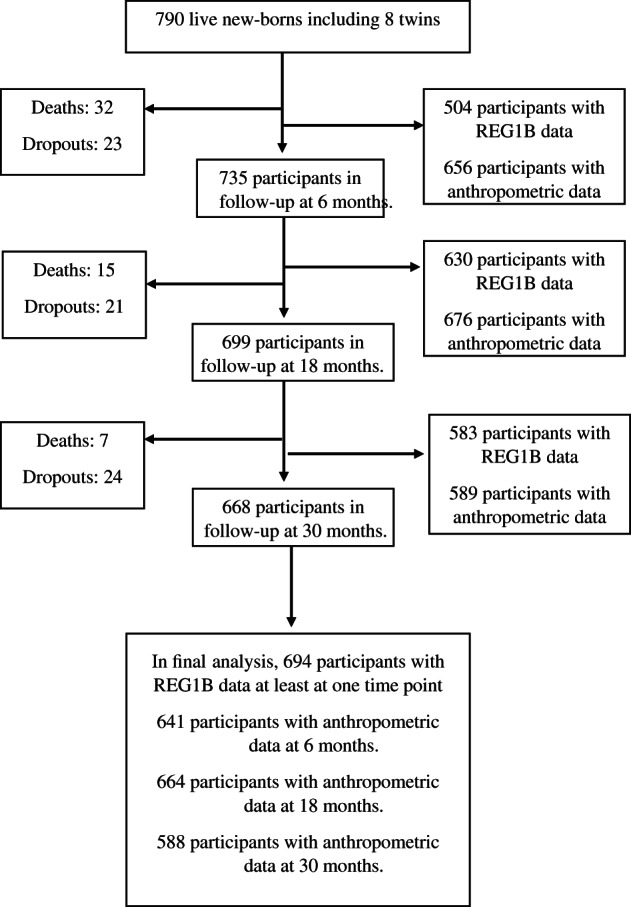
Participant flow.
Table 1.
Baseline characteristics of included and excluded participants†
| Characteristics | Included (n = 694) | Excluded (n = 103) | P‐value‡ |
|---|---|---|---|
| Infant and child characteristics | |||
| Proportion of boys | 47% | 52% | 0.575 |
| Birthweight (kg) | 2.97 (0.45) | 2.69 (0.58) | <0.001 |
| Proportion of breastfeeding after delivery | 100% | 88% | <0.001 |
| Maternal characteristics | |||
| Proportion with malaria parasitaemia | 23% | 24% | 0.802 |
| Proportion with low BMI (<18.5 kg m−2)§ | 8% | 6% | 0.554 |
| Duration of pregnancy (weeks) | 39.5 (1.8) | 38.1 (3.9) | <0.001 |
†Values are mean (SD) or percentages. ‡ P value is obtained from Fisher's exact test for categorical variables, or Student's t‐test for continuous variables. §Body mass index (BMI) calculated by weight and height as kg m−2.
Mean (SD) REG1B concentration at 6, 18 and 30 months was 193 (168), 105 (140) and 58 (104) μg/g respectively (Fig. 2). Between 6 and 30 months, the mean LAZ decreased from −1.26 to −1.94, mean WAZ fell from −0.57 to −1.04 and mean HCZ decreased from −0.28 to −0.98. Mean MUACZ and mean WLZ were close to 0 throughout the follow‐up (Supplemental Table 1).
Fig 2.
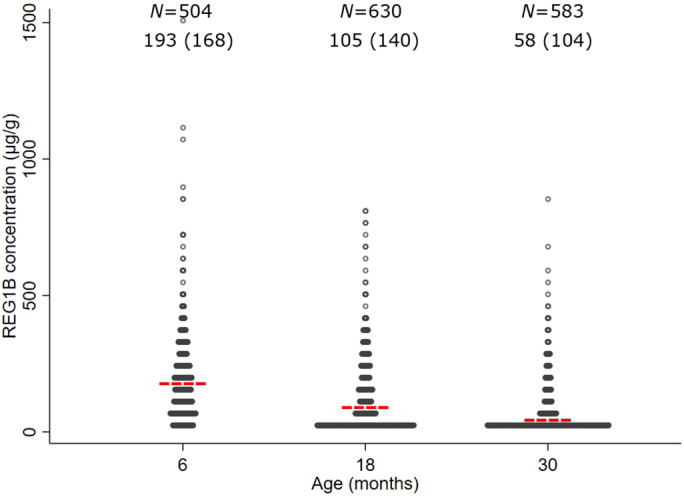
Distribution of faecal REG1B concentration at 6, 18 and 30 months. Mean REG1B concentration is shown as a red line for each age group. REG1B concentration ranges from 3.13 to 1530.07 μg/g. The values of mean (standard deviation) REG1B concentration at 6, 18 and 30 months are on the top of this figure. REG1B, regenerating 1B protein.
In cross‐sectional analyses, there were no statistically significant associations between faecal REG1B concentration and attained LAZ, WAZ, WLZ or MUACZ, at any age (P > 0.05; Table 2). For attained HCZ, there was a statistically significant, albeit weak, negative association at 6 months of age and a positive association at 30 months (P = 0.007 and 0.028, respectively; Table 2).
Table 2.
The associations between children's faecal REG1B concentration and attained size at 6, 18 and 30 months of age†
| Anthropometric index§ | REG1B (every 100 μg/g) | ||||||
|---|---|---|---|---|---|---|---|
| 6 months | 18 months | 30 months | |||||
| B‡ | 95% CI | B‡ | 95% CI | B‡ | 95% CI | ||
| LAZ | −0.00 | −0.06, 0.05 | 0.03 | −0.04, 0.09 | 0.04 | −0.04, 0.11 | |
| WAZ | −0.03 | −0.09, 0.02 | −0.02 | −0.07, 0.04 | 0.04 | −0.03, 0.11 | |
| WLZ | −0.04 | −0.10, 0.02 | −0.04 | −0.10, 0.01 | 0.02 | −0.05 0.10 | |
| HCZ | −0.08* | −0.13, −0.02 | −0.00 | −0.06, 0.05 | 0.08* | 0.01, 0.16 | |
| MUACZ | −0.06 | −0.02, 0.01 | −0.03 | −0.08, 0.03 | 0.03 | −0.04, 0.10 | |
*P < 0.05. †Models were adjusted for birthweight, breastfeeding after delivery (yes/no), maternal BMI, child sex, duration of pregnancy, maternal malaria status (positive/negative), maternal HIV status (positive/negative) and household food insecurity access scores. ‡Unstandardized regression coefficient between the children's faecal REG1B concentration at the age indicated in the column heading and their anthropometric index indicated in the left column. §HCZ, head circumference‐for‐age z‐score; LAZ, length‐for‐age z‐score; MUACZ, mid‐upper arm circumference‐for‐age z‐score; REG1B, regenerating 1B protein; WAZ, weight‐for‐age z‐ score; WLZ, weight‐for‐length z‐score.
There were no statistically significant associations between the participants' faecal REG1B concentration at 6 or 18 months and change in their LAZ, WAZ, WLZ, HCZ or MUACZ in the subsequent 6‐month period (Table 3).
Table 3.
The associations between faecal REG1B concentration at 6‐ or 18‐month‐old children and their change in anthropometric z‐scores in the subsequent 6 months†
| Change in anthropometric index§ | REG1B (every 100 μg/g) | |||
|---|---|---|---|---|
| 6 months | 18 months | |||
| B‡ | 95% CI | B‡ | 95% CI | |
| ΔLAZ | 0.00 | −0.04, 0.05 | 0.00 | −0.03, 0.04 |
| ΔWAZ | −0.00 | −0.04, 0.03 | 0.01 | −0.03, 0.04 |
| ΔWLZ | −0.01 | −0.05, 0.04 | 0.01 | −0.04, 0.06 |
| ΔHCZ | 0.01 | −0.02, 0.04 | −0.01 | −0.04, 0.02 |
| ΔMUACZ | 0.00 | −0.05, 0.05 | −0.00 | −0.05, 0.04 |
†Models were adjusted for birthweight, breastfeeding after delivery (yes/no), maternal BMI, child sex, duration of pregnancy, maternal malaria status (positive/negative), maternal HIV status (positive/negative) and household food insecurity access scores. ‡Unstandardized regression coefficient between the children's faecal REG1B concentration at the age indicated in the column heading and their gain in anthropometric index indicated in the left column. §ΔHCZ, change in head circumference‐for‐age z‐score; ΔLAZ, change in length‐for‐age z‐score; ΔMUACZ, change in mid‐upper arm circumference‐for‐age z‐score; REG1B, regenerating 1B protein; ΔWAZ, change in weight‐for‐age z‐score; ΔWLZ, change in weight‐for‐length z‐score.
In repeated measurements analysis, there were also no statistically significant associations between faecal REG1B and LAZ, WAZ, WLZ, MUACZ or HCZ after adjusting for age, birthweight, breastfeeding, maternal BMI, child sex, duration of pregnancy, maternal malaria status, maternal HIV status and household food insecurity access scores (Table 4).
Table 4.
The association between repeated faecal REG1B concentration and repeated anthropometric z‐scores at 6, 18 and 30 months†
| Anthropometric index§ | REG1B (every 100 μg/g) | |
|---|---|---|
| Coefficient (SE)‡ | 95% CI | |
| LAZ | 0.01 (0.01) | −0.01, 0.03 |
| WAZ | −0.01 (0.01) | −0.04, 0.01 |
| WLZ | −0.02 (0.02) | −0.06, 0.01 |
| HCZ | −0.01 (0.01) | −0.03, 0.01 |
| MUACZ | −0.02 (0.01) | −0.05, 0.01 |
†Random effects models were adjusted for age, birthweight, breastfeeding after delivery (yes/no), maternal BMI, child sex, duration of pregnancy, maternal malaria status (positive/negative), maternal HIV status (positive/negative) and household food insecurity access scores. ‡The coefficient of the association between the children's faecal REG1B concentration and anthropometrics from random effects models, SE, standard error. §HCZ, head circumference‐for‐age z‐score; LAZ, length‐for‐age z‐score; MUACZ, mid‐upper arm circumference‐for‐age z‐score; REG1B, regenerating 1B protein; WAZ, weight‐for‐age z‐score; WLZ, weight‐for‐length z‐score.
Unadjusted cross‐sectional analyses gave essentially similar results to the fully adjusted analyses (Supplemental Tables 2,3). Repeated measurement analyses that were adjusted only for the child age gave also other similar results to the fully adjusted model, except for MUACZ, for which there was a weak negative association with faecal REG1B concentration (Supplemental Table 4).
Discussion
Our study aimed to analyse the association between faecal REG1B concentration and child growth in rural Malawian infants and children. In a sample of 694 children followed at 6, 18 and 30 months, faecal REG1B concentration was not associated with the children attained size at the same visit. Furthermore, faecal REG1B concentration at 6 or 18 months of age was not predictive of the children's growth in the subsequent 6 months. Finally, a repeated measurements analysis showed only few associations between the participants' faecal REG1B concentration and their anthropometric measurements. For attained HCZ, there was a weak negative association at 6 months of age and a positive association at 30 months, suggesting a spurious finding. Thus, our sample findings suggest that faecal REG1B concentration does not function well as a biomarker that would be predictive of infant or young child growth in rural Malawi.
In our study, the results were obtained from a longitudinal study design with a large sample size. In principle, problems related to stool sample collection, storage or analysis could introduce a bias for interpretation of the findings. However, the samples were collected only from children with no diarrhoea, aliquoted after collection and stored at −80°C, at which temperature biological specimens can be maintained over many years. 18 For REG1B concentration analysis, we used ELISA technique that has been proven a reliable method to detect protein in stool samples. 12 , 19 Furthermore, we did the analysis in duplicate to reduce potential variation during laboratory work. Even though some cohort members were not included in this analysis, the variables that showed a difference between the included and excluded were adjusted for in the analytic models. Therefore, we consider the sample findings unbiased and indicative of a lack of association between faecal REG1B concentration and physical growth in the Malawian population.
Our findings from Malawi contrast those from two previous studies in Bangladesh and Peru, both using the same REG1B ELISA test as we used. In those studies, faecal REG1B concentration in early infancy was predictive of growth faltering by 2 years of age. 12 Increased faecal REG1B concentration has also been associated with other conditions that predict low LAZ, such as small intestine bacterial overgrowth among 2‐year‐old Bangladeshi children 19 and presence of IgA class antibodies against lipopolysaccharide in the plasma of 6–10‐month‐old Pakistani infants. 20 Besides different study locations between our and the earlier studies, there were differences in the mean faecal REG1B concentration (higher in Malawi than elsewhere), the age when REG1B concentration was measured and the duration of the participants' follow‐up. There may also have been additional differences in stool processing and storage, the participants' diets and background inflammation or other factors that may affect the REG1B protein or the assay. Given the limitations in data comparability, we cannot conclusively explain the observed differences. However, it seems that faecal REG1B concentration may not be a universally useful biomarker to predict linear growth in all infant and child populations.
REG1B is one of several potential biomarkers for intestinal inflammation and dysfunction. The other commonly reported biomarkers include calprotectin, neopterin, alpha‐1‐antitrypsin and myeloperoxidase. 21 Whereas REG1B concentration is believed to indicate intestinal repair and regeneration, calprotectin, neopterin and myeloperoxidase measure mostly intestinal inflammation and alpha‐1‐antitrypsin reflects increased intestinal permeability. 22 Each of these biomarkers can be reliably measured from fresh or stored stool samples, with a simple ELISA‐test. All except REG1B test are commercially available, with an approximate material cost of 5 USD per test. However, faecal calprotectin does not necessarily indicate intestinal inflammation correctly among under‐4‐year‐old children, 23 and alpha‐1‐antitrypsin concentration may be affected by breastfeeding. 24 There is also some evidence that faecal myeloperoxidase and neopterin analyses are difficult to interpret unless both tests are done concomitantly. 25 Since REG1B is not known to have these limitations and its concentration has predicted infant growth in Bangladesh and Peru, 12 it might still have a place in the assessment of intestinal health, especially among young breastfeeding infants.
In conclusion, our findings suggest that faecal REG1B concentration may be not a sensitive predictor of child growth in rural Malawi. However, given that there are no other studies published from Sub‐Saharan Africa, these data should be treated as preliminary. Further studies in other paediatric populations in Africa would be needed to establish the value of faecal REG1B concentration as a predictive biomarker for child growth in Sub‐Saharan Africa.
Supporting information
Supplemental Table 1 Mean (SD) anthropometric z‐scores among study participants at 6, 18 and 30 months of age †
Supplemental Table 2. Unadjusted association between children's faecal REG1B concentration and attained size at 6, 18 and 30 months of age †
Supplemental Table 3. Unadjusted associations between faecal REG1B concentration at 6‐ or 18‐month‐old children and their change in anthropometric z‐scores in the subsequent 6 months †
Supplemental Table 4. The association between repeated faecal REG1B concentration and repeated anthropometric z‐scores at 6, 18 and 30 months†
Acknowledgements
The study was funded by Finnish Funding Agency for Technology and Innovation (TEKES), the Foundation for Paediatric Research in Finland and the Competitive Research Funding of the Tampere University Hospital. The original iLiNS‐DYAD trial was funded by a grant to the University of California, Davis from the Bill & Melinda Gates Foundation, with additional funding from the Office of Health, Infectious Diseases, and Nutrition, Bureau for Global Health, U.S. Agency for International Development (USAID) under terms of Cooperative Agreement No. AID‐OAA‐A‐12‐00005, through the Food and Nutrition Technical Assistance III Project (FANTA), managed by FHI 360. The REG1B test kits were kindly donated free of charge by Dr. William A. Petri from the University of Virginia, Charlottesville, VA, USA.
Conflict of interest: None.
References
- 1. United Nations Children's Fund, World Health Organization, International Bank for Reconstruction and Development/The World Bank . Level and Trends in Child Malnutrition: Key Findings of the 2019 Edition of the Joint Child Malnutrition Estimates. Geneva: World Health Organization; 2019. Available from: https://www.unicef.org/reports/joint-child-malnutrition-estimates-levels-and-trends-child-malnutrition-2019 [accessed November 2019]. [Google Scholar]
- 2. Victora CG, de Onis M, Hallal PC, Blossner M, Shrimpton R. Worldwide timing of growth faltering: Revisiting implications for interventions. Pediatrics 2010; 125: e473–80. [DOI] [PubMed] [Google Scholar]
- 3. Grantham‐McGregor S, Cheung YB, Cueto S et al. Developmental potential in the first 5 years for children in developing countries. Lancet 2007; 369: 60–70. [DOI] [PMC free article] [PubMed] [Google Scholar]
- 4. Acevedo P, Garcia Esteban MT, Lopez‐Ejeda N, Gomez A, Marrodan MD. Influence of malnutrition upon all‐cause mortality among children in Swaziland. Endocrinol. Diabetes Nutr. 2017; 64: 204–10. [DOI] [PubMed] [Google Scholar]
- 5. Kyle UG, Shekerdemian LS, Coss‐Bu JA. Growth failure and nutrition considerations in chronic childhood wasting diseases. Nutr. Clin. Pract. 2015; 30: 227–38. [DOI] [PubMed] [Google Scholar]
- 6. Valla FV, Berthiller J, Gaillard‐Le‐Roux B et al. Faltering growth in the critically ill child: Prevalence, risk factors, and impaired outcome. Eur. J. Pediatr. 2018; 177: 345–53. [DOI] [PubMed] [Google Scholar]
- 7. Iqbal NT, Sadiq K, Syed S et al. Promising biomarkers of environmental enteric dysfunction: A prospective cohort study in Pakistani children. Sci. Rep. 2018; 8: 2966. [DOI] [PMC free article] [PubMed] [Google Scholar]
- 8. Keel M, Harter L, Reding T et al. Pancreatic stone protein is highly increased during posttraumatic sepsis and activates neutrophil granulocytes. Crit. Care Med. 2009; 37: 1642–8. [DOI] [PubMed] [Google Scholar]
- 9. Ogawa H, Fukushima K, Naito H et al. Increased expression of HIP/PAP and regenerating gene III in human inflammatory bowel disease and a murine bacterial reconstitution model. Inflamm. Bowel Dis. 2003; 9: 162–70. [DOI] [PubMed] [Google Scholar]
- 10. Investigators M‐EN . The MAL‐ED study: A multinational and multidisciplinary approach to understand the relationship between enteric pathogens, malnutrition, gut physiology, physical growth, cognitive development, and immune responses in infants and children up to 2 years of age in resource‐poor environments. Clin. Infect. Dis. 2014; 59: S193–206. [DOI] [PubMed] [Google Scholar]
- 11. Kosek MN, Investigators M‐EN . Causal pathways from enteropathogens to environmental enteropathy: Findings from the MAL‐ED birth cohort study. EBioMedicine 2017; 18: 109–17. [DOI] [PMC free article] [PubMed] [Google Scholar]
- 12. Peterson KM, Buss J, Easley R et al. REG1B as a predictor of childhood stunting in Bangladesh and Peru. Am. J. Clin. Nutr. 2013; 97: 1129–33. [DOI] [PMC free article] [PubMed] [Google Scholar]
- 13. Ashorn P, Alho L, Ashorn U et al. The impact of lipid‐based nutrient supplement provision to pregnant women on newborn size in rural Malawi: A randomized controlled trial. Am. J. Clin. Nutr. 2015; 101: 387–97. [DOI] [PubMed] [Google Scholar]
- 14. Maleta KM, Phuka J, Alho L et al. Provision of 10‐40 g/d lipid‐based nutrient supplements from 6 to 18 months of age does not prevent linear growth faltering in Malawi. J. Nutr. 2015; 145: 1909–15. [DOI] [PubMed] [Google Scholar]
- 15. WHO MGRSG . WHO child growth standards based on length/height, weight and age. Acta Paediatr. Suppl. 2006; 450: 76–85. [DOI] [PubMed] [Google Scholar]
- 16. Coates J, Anne S, Paula B. Household Food Insecurity Access Scale (HFIAS) for Measurement of Household Food Access: Indicator Guide, Vol. 3. Washington, DC: Food and Nutrition Technical Assistance Project, Academy for Educational Development; 2007. [Google Scholar]
- 17. Cheung YB. Statistical Analysis of Human Growth and Development. London, UK: CRC Press; 2014. [Google Scholar]
- 18. Gies A, Niedermaier T, Weigl K, Schrotz‐King P, Hoffmeister M, Brenner H. Effect of long‐term frozen storage and thawing of stool samples on faecal haemoglobin concentration and diagnostic performance of faecal immunochemical tests. Clin. Chem. Lab. Med. 2020; 58: 390–8. [DOI] [PubMed] [Google Scholar]
- 19. Donowitz JR, Haque R, Kirkpatrick BD et al. Small intestine bacterial overgrowth and environmental enteropathy in Bangladeshi children. MBio 2016; 7: e02102–15. [DOI] [PMC free article] [PubMed] [Google Scholar]
- 20. Syed S, Iqbal NT, Sadiq K et al. Serum anti‐flagellin and anti‐lipopolysaccharide immunoglobulins as predictors of linear growth faltering in Pakistani infants at risk for environmental enteric dysfunction. PLoS One 2018; 13: e0193768. [DOI] [PMC free article] [PubMed] [Google Scholar]
- 21. Kosek M, Guerrant RL, Kang G et al. Assessment of environmental enteropathy in the MAL‐ED cohort study: Theoretical and analytic framework. Clin. Infect. Dis. 2014; 59: S239–47. [DOI] [PMC free article] [PubMed] [Google Scholar]
- 22. Colston JM, Penataro Yori P, Colantuoni E et al. A methodologic framework for modeling and assessing biomarkers of environmental enteropathy as predictors of growth in infants: An example from a Peruvian birth cohort. Am. J. Clin. Nutr. 2017; 106: 245–55. [DOI] [PubMed] [Google Scholar]
- 23. Davidson F, Lock RJ. Paediatric reference ranges for faecal calprotectin: A UK study. Ann. Clin. Biochem. 2017; 54: 214–8. [DOI] [PubMed] [Google Scholar]
- 24. Davidson LA, Lonnerdal B. Fecal alpha 1‐antitrypsin in breast‐fed infants is derived from human milk and is not indicative of enteric protein loss. Acta Paediatr. Scand. 1990; 79: 137–41. [DOI] [PubMed] [Google Scholar]
- 25. Guerrant RL, Leite AM, Pinkerton R et al. Biomarkers of environmental enteropathy, inflammation, stunting, and impaired growth in children in northeast Brazil. PLoS One 2016; 11: e0158772. [DOI] [PMC free article] [PubMed] [Google Scholar]
Associated Data
This section collects any data citations, data availability statements, or supplementary materials included in this article.
Supplementary Materials
Supplemental Table 1 Mean (SD) anthropometric z‐scores among study participants at 6, 18 and 30 months of age †
Supplemental Table 2. Unadjusted association between children's faecal REG1B concentration and attained size at 6, 18 and 30 months of age †
Supplemental Table 3. Unadjusted associations between faecal REG1B concentration at 6‐ or 18‐month‐old children and their change in anthropometric z‐scores in the subsequent 6 months †
Supplemental Table 4. The association between repeated faecal REG1B concentration and repeated anthropometric z‐scores at 6, 18 and 30 months†