Abstract
Following a request from the European Commission, the EFSA Panel on Nutrition, Novel Foods and Food Allergens (NDA) was asked to revise the Opinion on the essential composition of total diet replacements for weight control (TDRs) regarding the minimum content of linoleic acid (LA) and alpha‐linolenic acid (ALA) and the maximum content of magnesium (Mg). Through a comprehensive literature search, human studies were retrieved reporting on LA and ALA concentrations in adipose tissue (AT), on weight loss and gallstone formation following TDR consumption and on diarrhoea after supplemental Mg intake. The distribution of the amount of LA and ALA release from AT during weight loss when consuming TDRs was estimated using statistical simulations. Using the fifth percentile, the coverage of the adequate intake (AI) for both FA was estimated. For the risk of developing diarrhoea when consuming TDRs with an Mg content of 350 mg/day, four cross‐over studies using 360–368 mg Mg/day were reviewed. The Panel concludes that (1) there is no need to add LA to TDRs, as the amount released from AT during weight loss when consuming TDRs is sufficient to cover the AI for LA; (2) a minimum of 0.8 g/day ALA is needed in TDRs in order to meet the AI for ALA; (3) the minimum fat content of TDRs of 20 g/day as derived in the Panel's previous opinion is proposed to be maintained until the availability of further evidence, given the considerable uncertainty as to the amount of fat required for reducing the risk of gallstone formation; and (4) the likelihood that Mg‐induced diarrhoea occurs at a severity that may be considered of concern for overweight and obese individuals consuming TDRs is low when the total maximum Mg content in TDRs is 350 mg/day.
Keywords: total diet replacements for weight control, fatty acids, obesity, micronutrient, diarrhoea, comprehensive literature search, foods for specific groups
1. Introduction
1.1. Background and Terms of Reference as provided by the requestor
1.1.1. Background
Commission delegated Regulation (EU) 2017/1798 repeals Directive 96/8/EC and revises the rules applicable to total diet replacement for weight control (TDR), taking into account the scientific opinion of the European Food Safety Authority (EFSA) of 2015.
EFSA's Scientific Opinion on the essential composition of TDR includes a recommendation on the minimum linoleic acid (LA) and alpha‐linolenic acid (ALA) content of the products. It states that TDR should provide at least 11 g LA and 1.4 g ALA per day. As explained in the opinion, the values were proposed on the basis of the Adequate Intake for linoleic acid and alpha‐linolenic acid established for energy‐adequate diets. It is further noted that ‘this recommendation is based on the consideration that the fatty acid content of adipose tissue and the rate of adipose tissue loss may vary between individuals; thus, there is considerable uncertainty as to whether body stores can completely cover requirements’.
The opinion also includes a recommendation on the magnesium content of TDR, proposing a range of 150–250 mg/day of magnesium in these products. As regards the maximum magnesium content threshold, the EFSA Panel noted that ‘as most of the magnesium in total diet replacements for weight control would be easily dissociable magnesium salts, the UL of 250 mg/day applies’.
On 7 November 2019, Total Diet & Meal Replacements Europe (TDMR) sent a letter to the Commission requesting the revision of the Commission delegated Regulation (EU) 2017/17981, in particular the abovementioned requirements laid down therein. In its letter, TDMR referred to six scientific publications,2 , 3,, 4 , 5 , 6 , 7 which, according to TDMR, provide sufficient evidence for a review of the minimum values for LA and ALA and for a review of the maximum level of magnesium in TDR.
1.1.2. Terms of Reference as provided by the mandate requestor
In accordance with Article 29 of Regulation (EC) No 178/2002, the European Commission asks the European Food Safety Authority to assess the scientific evidence provided by TDMR together with any other relevant new scientific evidence available and, if necessary, to update the conclusions of the former Scientific Opinion on the essential composition of TDR as regards the minimum values for LA and ALA as well as the maximum level of magnesium in TDR.
1.2. Interpretation of the Terms of Reference
The NDA Panel understands that it is expected to provide advice on:
the amount of LA and ALA that is released from adipose tissue (AT) of overweight or obese adults8 during weight loss;
to what extent the minimum content of LA and ALA in TDRs proposed by the Panel (EFSA NDA Panel, 2015b) could be reduced based on the outcome of the review of the scientific evidence related to point (A);
to what extent the minimum fat content in TDRs proposed by the Panel (EFSA NDA Panel, 2015b), that was derived from the proposed minimum content of LA and ALA in TDRs, is to be revised together with the minimum energy content that was based on the sum of the energy provided by macronutrients;
whether a maximum magnesium (Mg) content in TDRs of 350 mg/day, as proposed by TDMR, would give rise to concerns with respect to an increased risk of diarrhoea. In this context, the Panel is not expected to revise the tolerable upper intake level (UL) of the Scientific Committee on Food (SCF) (2001) for Mg salts.
1.3. Context of the assessment
TDRs are ‘food specially formulated for use in energy restricted diets for weight reduction which, when used as instructed by the food business operator, replaces the whole daily diet’.9 The compositional and information requirements for TDRs are laid down in Commission delegated Regulation (EU) 2017/17981. This delegated Regulation is supplementing Regulation (EU) No 609/20138, which repealed Commission Directive 96/8/EC10. Commission delegated Regulation (EU) 2017/1798 shall apply from 27 October 2022. The compositional criteria laid down in this Regulation were informed by an Opinion of the NDA Panel on the essential composition of TDRs published in 2015 (EFSA NDA Panel, 2015b).
TDMR, the European trade body for manufacturers and distributors of formula diet products, including TDRs, provided the European Commission with additional scientific evidence related to the content of the fatty acids (FAs), LA and ALA, and the maximum content of Mg in TDRs that the NDA Panel is expected to assess together with any other relevant new scientific evidence available.
Briefly, in its previous Opinion (EFSA NDA Panel, 2015b), based on a narrative review of the evidence, the Panel proposed that TDRs should provide at least 11 g LA (C 18:2, n‐6) per day and 1.4 g ALA (C 18:3, n‐3) per day. This was based on the adequate intake (AI) for LA and ALA for healthy individuals (i.e. 4% of energy intake (E%) and 0.5 E%, respectively (EFSA NDA Panel, 2010)), considering a 40‐year‐old male reference subject with a physical activity level of 1.6 (moderate activity) and an average requirement (AR) for energy of 10.7 MJ/day (2,500 kcal/day) (EFSA NDA Panel, 2013). It was also based on the ‘consideration that the FA concentration of AT and the rate of AT loss may vary between individuals; thus, there is considerable uncertainty as to whether body stores can completely cover requirements’. This statement was based on a review of the FA concentration in AT by Seidelin (1995). The author had noted that, in particular, the proportion of FAs in the diet influences the proportion of FAs in AT and the proportion of LA in AT varied between different countries/ethnicities. The influence of age, sex, sampling site, body weight (for which the author considered that there was no relationship with FA composition of AT), hypertension, smoking, diabetes mellitus, serum lipids, atherosclerosis, coronary artery disease and a number of other disorders/diseases was also discussed in this review.
Regarding fat content of TDRs, the Panel noted that ‘it has been suggested that the increased risk of gallstone formation during rapid weight loss could be partly explained by a low fat content of the diet, in particular in [very‐low calorie diets] VLCDs, and that a certain minimum amount of fat is needed in a diet to prevent or reduce the incidence of gallstone formation’. After reviewing the evidence, the Panel concluded that ‘the incidence of gallstones is reduced with increasing fat and energy content of the diet. However, the available evidence does not allow a precise cut‐off value to be defined above which the risk for gallstone formation would be reduced’. Therefore, the minimum fat content in TDRs (i.e. 20 g/day) was proposed to be based on the amount of oils needed to supply LA and ALA in the necessary above‐mentioned amounts, considering that these oils have a maximum LA and ALA content of 55–75% of total FA (FA%).
Finally, the minimum energy content in TDRs was derived from the minimum macronutrient content of such diets.
With respect to Mg, the Panel proposed that TDRs should provide a maximum of 250 mg Mg per day. This was based on the UL for readily dissociable Mg salts (but not Mg normally present in foods and beverages), derived by SCF (2001) from data on mild diarrhoea. After the publication of the Opinion of the Panel on the essential composition of TDRs (EFSA NDA Panel, 2015b), AIs for Mg have been set for various population groups, including 350 mg/day for men and 300 mg/day for women (EFSA NDA Panel, 2015a). In this context, TDMR proposed to align the maximum Mg content in TDRs with the new AIs for Mg.
2. Data and methodologies
2.1. Data
For this scientific assessment, a protocol has been developed in line with existing methodology (EFSA, 2020) (see Appendix D).
This Statement is based on the data provided by TDMR as well as on data retrieved through comprehensive literature searches in Embase and PubMed performed by EFSA in June 2020 (08 June: Q1 on FA concentration of AT and release from AT (see Section 2.1.1), 02 June: Q2 on weight loss when consuming TDRs (see Section 2.1.2), 22 June: Q3 on Mg intake and risk of diarrhoea (see Section 2.1.3) and on 09 December 2020 (Q4 on fat content of energy‐restricted diets and risk of gallstone formation (see Section 2.1.4)). No limitations on publication date were applied, except for the search for Q4 that included only studies published from 2014 onwards, i.e. studies not yet considered by EFSA NDA Panel (2015b). The searches were restricted to publications in English.
The title and abstract screening was carried out in duplicate in Distiller SR® (Evidence Partners, Ottawa, Canada), while the full texts were screened by a single reviewer (protocol amendment 1). Data were extracted in tabular format in Microsoft Excel® by one EFSA staff member and validated by another. The data extraction forms were further customised following the study selection to the data needs and available evidence. As no references were retrieved for the search on fat content of energy‐restricted diets and risk of gallstone formation, the prespecified extraction list was not applied. Authors were contacted to clarify questionable values reported in two publications (see Section 3.1.1).
The following sections shortly summarise the evidence retrieval divided according to the four main literature searches.
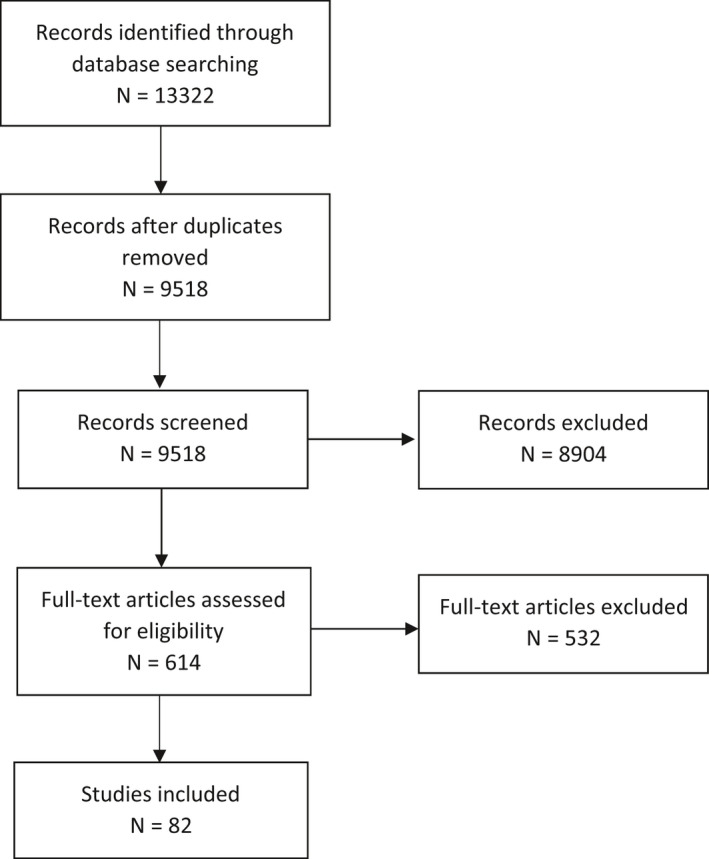
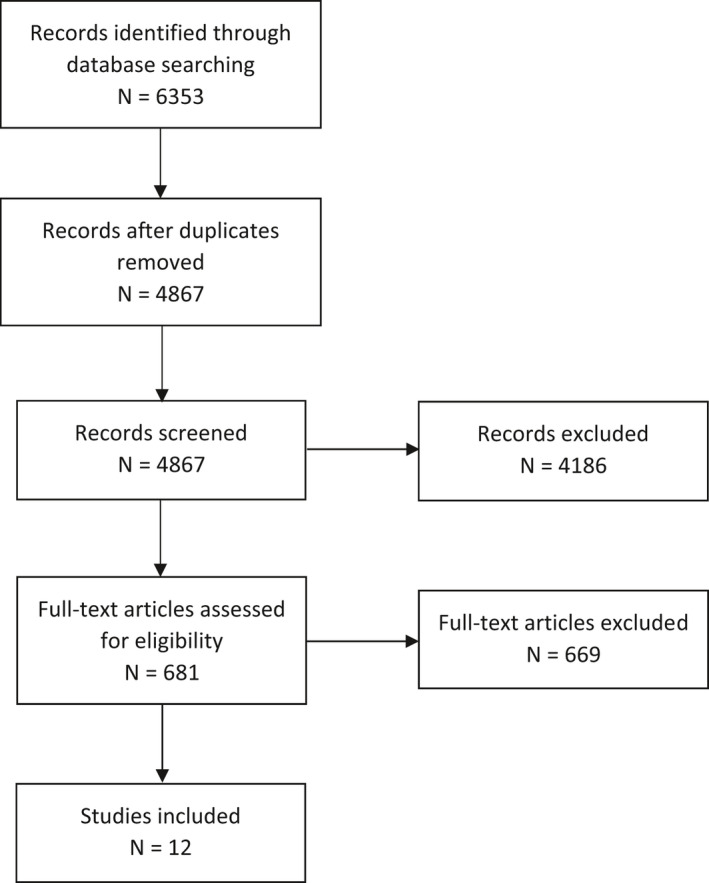
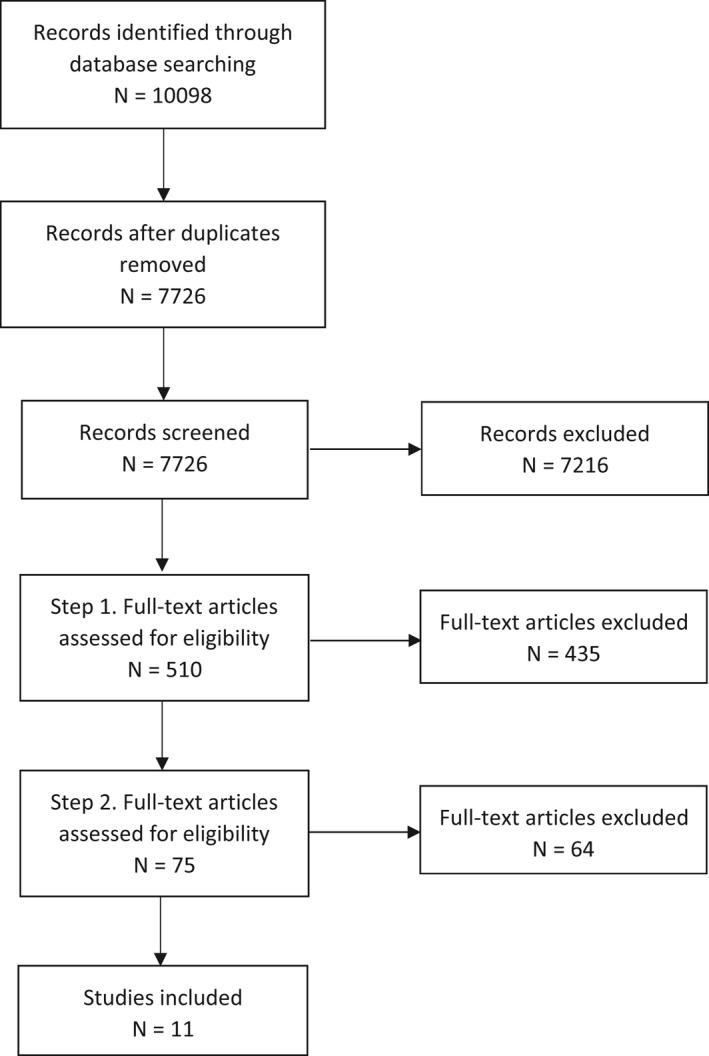
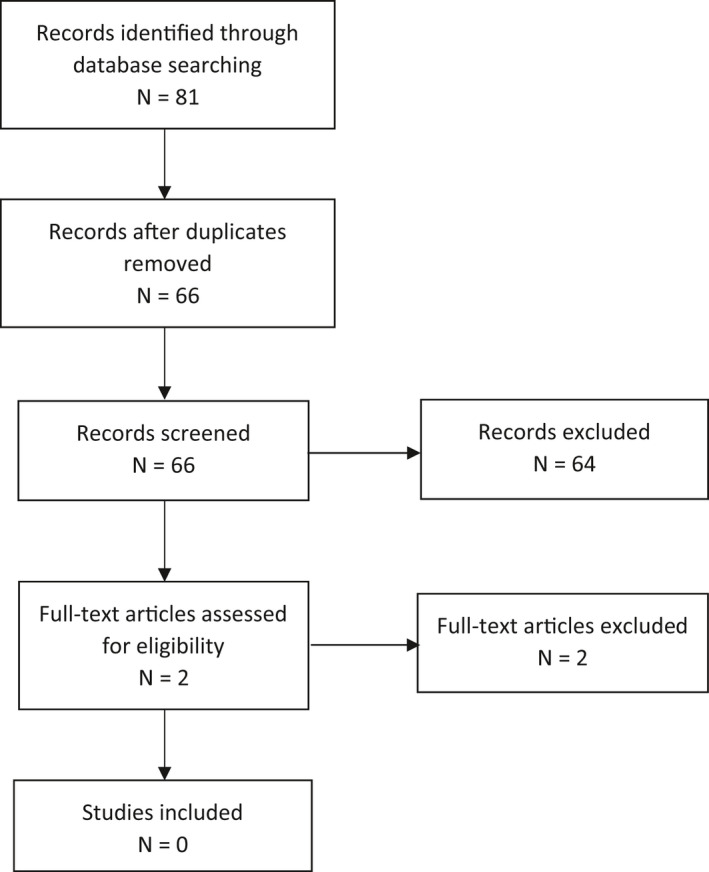
The PRISMA flow charts of the searches are included as Appendix A.
The search strings and the eligibility criteria in the protocol are reported as Appendices D and E.
2.1.1. Linoleic acid and alpha‐linolenic acid concentration and their release from adipose tissue during weight loss
Two searches were conducted to retrieve evidence 1) for the LA and ALA concentration of AT and 2) for the release of these FA from AT during weight loss. Owing to the high overlap between publications of the two searches, the data retrieved were combined and screened together (Q1).
Publications retrieved were human intervention or observational studies conducted in populations living in Europe investigating LA and ALA concentration in healthy normal weight adults or overweight or obese adults8 either without apparent co‐morbidity or with the following diseases that are frequently associated with obesity: type 2 diabetes mellitus (T2DM), hypertension, hyperlipidaemia. For the question on the release of FA from AT, studies were considered if they reported LA and/or ALA concentration of AT before and after weight loss or investigated release of these FA from AT using microdialysis of AT or tracer methods.
For the question on the release of these FA from AT during weight loss, hand search in the pertinent references was also performed from which relevant studies conducted in the US were taken into account (protocol amendment 2), given the limited references found in humans in Europe.
2.1.2. Range of weight loss when consuming total diet replacements for weight control
Publications retrieved were human intervention studies (including single arm trials) investigating the achieved range of weight loss following the consumption of TDRs alone (without consumption of other foodstuffs, e.g. vegetables, even if in limited amounts) without co‐intervention (e.g. counselling, group sessions, physical activity programmes) within the permitted energy range of 2,510–5,020 kJ (600–1,200 kcal) per day, as laid down in Commission delegated Regulation (EU) 2017/1798. Study populations eligible were overweight or obese adults without apparent co‐morbidity or those with T2DM, hypertension or hyperlipidaemia, for which weight was measured by investigators (and reported for any time point up to 8 weeks (i.e. the maximum duration of use of TDRs without medical supervision)). Further, eligible studies were those reporting on compliance (both on how it was assessed (in order to judge reliability) and how many individuals were compliant).
2.1.3. Supplemental magnesium and risk of developing diarrhoea
Publications retrieved were human intervention studies reporting on the development of diarrhoea or on adverse effects following administration of two different interventions (i.e. placebo vs. Mg; or Mg vs. Mg at different doses) of readily dissociable Mg salts consumed by participants.
The initial eligibility considerations were to include only studies that reported the criteria used for the diagnosis of diarrhoea and applying the World Health Organisation (WHO) criteria (i.e. stool frequency of ≥ 3 loose or watery stools per day11). As this type of data was not retrievable, cross‐over studies were considered to decrease uncertainty of the outcome assessment (i.e. diarrhoea) as subjects act as their own controls (protocol amendment 3). This is indicated as an additional full‐text screening (step 2) in PRISMA flow chart for Q3 (Appendix A).
2.1.4. Fat content of energy‐restricted diets and risk of gallstone formation
The Panel searched for publications on human intervention studies comparing the effect of different levels of dietary fat in energy‐restricted diets on the risk of gallstone formation and of biliary sludge formation, as well as on gallbladder emptying. This search was considered relevant only in case of need for a reassessment of the minimum fat content in TDRs that was derived from the proposed minimum content of LA and ALA in TDRs.
2.2. Methodologies
As outlined in Section 1.1.2, the current scientific assessment was carried out to assess the additional available evidence related to the essential composition of TDRs. The methodology for proposing such an essential composition has been outlined in the previous Opinion of the EFSA NDA Panel (2015b): ‘The guiding principle for providing advice on the essential composition of total diet replacements for weight control should be that products are safe and suitable when consumed as a sole source of nutrition, for several weeks to months, by overweight or obese adults in the context of energy‐restricted diets for weight reduction. In order to avoid nutrient deficiencies, these products should, therefore, provide at least the PRI or AI for adults of all indispensable nutrients. As Dietary Reference Values (DRVs) are generally established for healthy normal‐weight individuals, specific consideration will be given by the Panel in this opinion to whether there is an increase in nutrient requirements in the overweight or obese or whether (rapid) weight loss leads to an increased nutrient loss and thus a higher requirement. When advising on the macronutrient composition of total diet replacements, the Panel will also consider the extent to which different diet compositions impact on losses in fat free mass (FFM), and on other adverse effects of weight loss diets, such as gallstone formation. The effectiveness of a product in terms of extent of weight loss is not in itself an appropriate determinant for the necessary composition of total diet replacements for weight control.’
2.3. Protocol amendments
The full‐text screening was carried out by a single reviewer in Distiller SR® (Evidence Partners, Ottawa, Canada) (see Section 2.1).
Studies conducted in the United States (US) were included that investigated the release of LA and ALA from AT during weight loss (Q1) (Section 3.1.2).
For the evidence retrieval on Mg intake and risk of diarrhoea (Q3), only cross‐over studies were included as no studies were identified reporting on the criteria for diagnosis of diarrhoea and applying the WHO criteria (Section 3.3.2).
Studies conducted in non‐overweight/non-obese subjects with mild hypertension and not on medication were included as eligible evidence on Mg intake and risk of diarrhoea (Q3) (Section 3.3.2).
Observational and interventional studies either single‐arm or with only one arm consuming a TDR without co‐intervention were considered as supportive evidence in relation to gallstone formation, biliary sludge formation and/or gallbladder emptying (Q4) (Section 3.2).
3. Assessment
3.1. Minimum content of linoleic acid and alpha‐linolenic acid in total diet replacements for weight control
3.1.1. Linoleic acid and alpha‐linolenic acid composition of adipose tissue
In the literature search that formed the basis of the present assessment, the Panel identified 82 studies that reported on the LA or ALA composition of AT in normal‐weight, overweight or obese adults living in Europe, either without apparent co‐morbidity or overweight or obese with T2DM, hypertension or hyperlipidaemia.
The two papers provided by TDMR to the European Commission on the FA concentrations in AT (Bork et al., 2018; Venø et al., 2018) reported on quantiles of LA and ALA concentrations in AT in the same cohort study (i.e. Danish Diet, Cancer and Health cohort). They did not provide summary data, i.e. means and measures of spread that allowed them to be combined with the other evidence that was retrieved through the search. Data from this cohort were included in the assessment through consideration of the publication by Dahm et al. (2011).
Two studies that originally met the inclusion criteria (Heemskerk et al., 2015; Sikorska‐Wisniewska et al., 2020) were excluded from further review, as they reported implausibly low ALA concentrations in AT that could also not be explained by the authors upon contacting them.
Hence, a total of 80 studies were considered.
AT samples in the studies were obtained either via needle biopsy, a biopsy during surgery or during autopsy. Studies were available from 20 European countries. They were heterogeneous in terms of population (specific subgroup of a population or random samples from the general populations), weight status of individuals, sample size, sampling site of the body, method of FA extraction, method of FA derivatisation to FA methyl esters12 and unit in which the FA concentration was reported (e.g. mol% of total FA, w% of total FA, w% of AT).
In the protocol, the Panel had predefined certain parameters that were intended to be investigated with respect to their potential influence on the amount of LA and ALA stored in AT. This included weight status, lifestyle factors (such as diet or physical activity), gender, age, ethnicity, AT sampling site, disease status (related to the diseases listed above) or medication use (related to the diseases indicated above).
Data analysis across the included studies: scatter plots for the predefined list of influencing factors
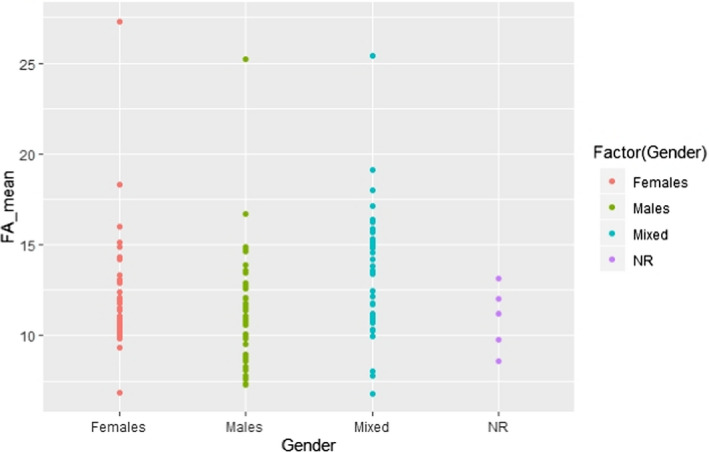
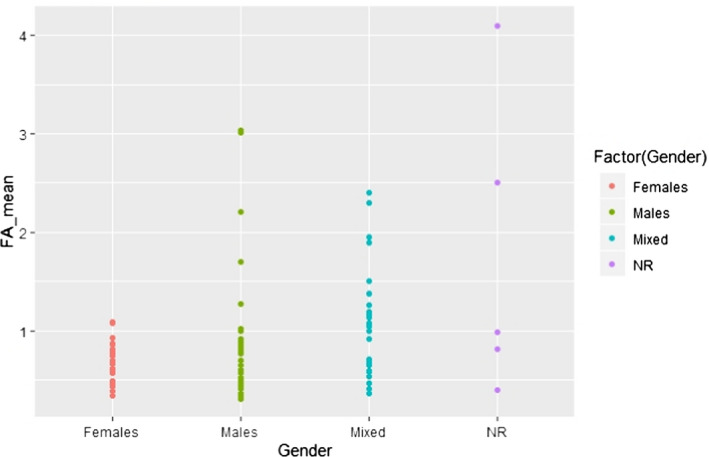
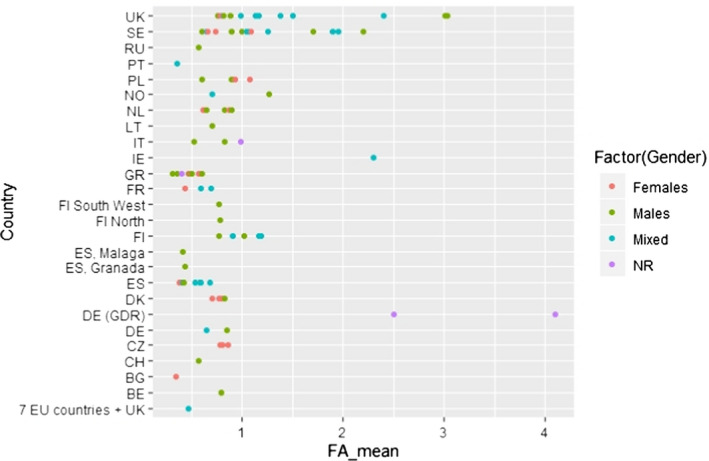
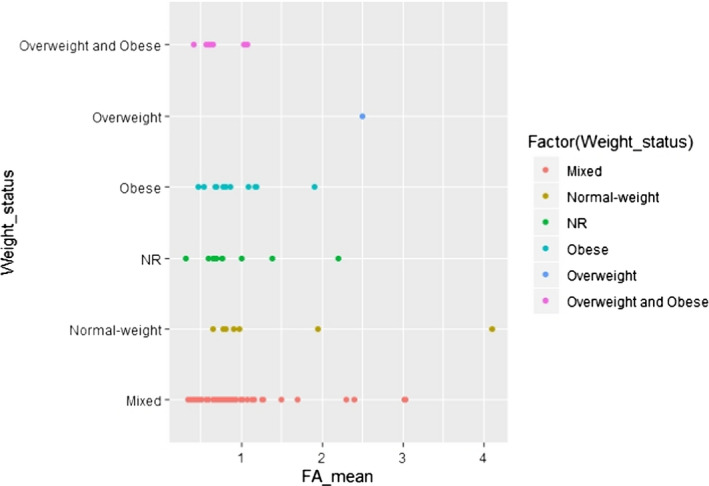
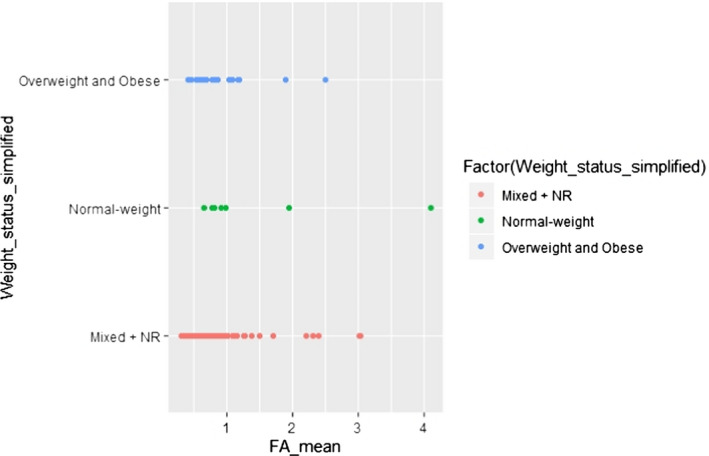
The overall data set was evaluated visually in the form of scatter plots, for each of the two FA LA and ALA, for the following potentially influencing factors for which enough data were available to create informative plots:
- –
-
–
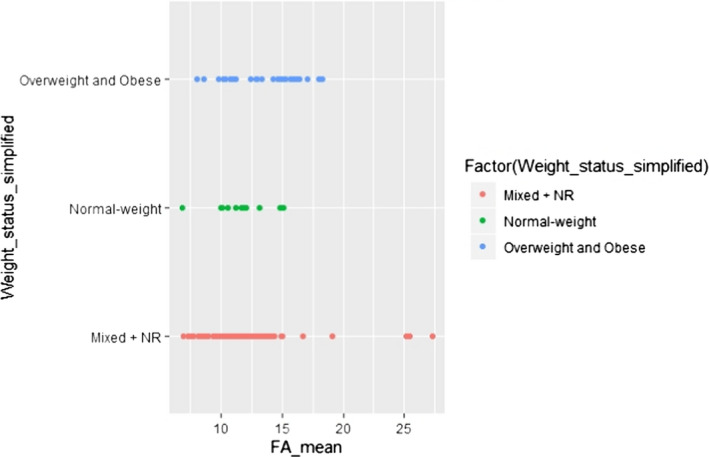
weight status (i.e. overweight and obese, overweight, obese, normal weight, mixed, not reported; Appendices C.4, C.5, C.13, C.14),
-
–
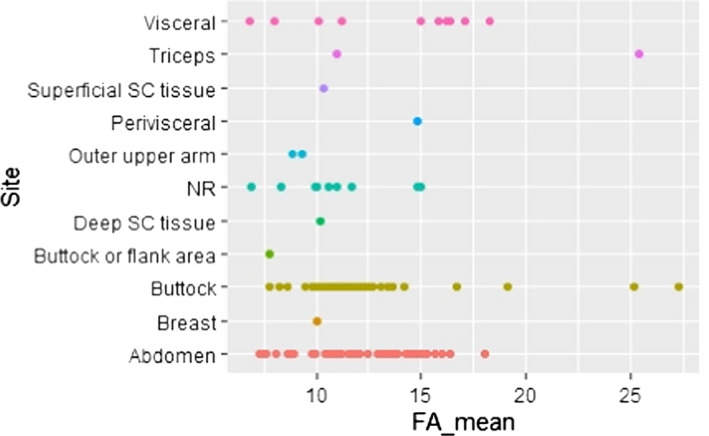
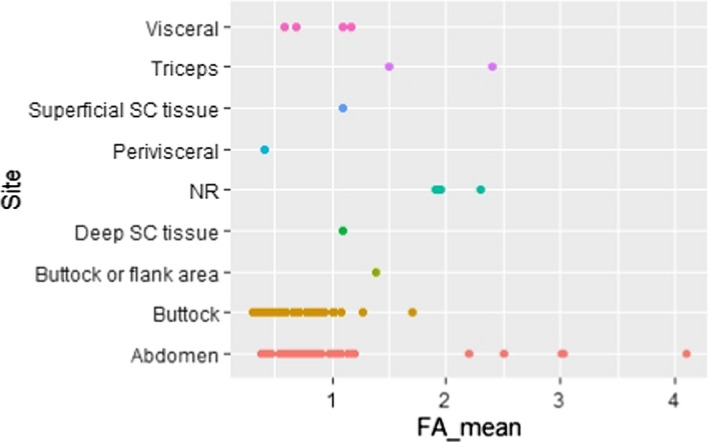
and sampling site (i.e. visceral (VC) or superficial subcutaneous (SC) AT from various sites; Appendices C.8 and C.17).
However, these graphical presentations did not reveal a pattern suggesting an association between the factors investigated and the reported LA and ALA concentrations in AT.
For other factors, such an evaluation was not feasible because (1) the data set did not allow categories to be created, e.g. for age owing to the broad age ranges of participants in the individual studies, or (2) too few studies were available that investigated the particular factor, i.e. ethnicity, diet and physical activity.
Comparisons, reported in individual publications, for the predefined list of influencing factors
In addition, individual papers that made direct comparisons between different potentially influencing factors in the same population were also considered and are described below.
The majority of studies (six out of eight) that investigated site‐specific difference in LA and/or ALA concentrations in AT did not observe such differences, both with respect to SC AT samples taken from different body areas (sample sizes ranging from 7 to 76 individuals), and when comparing SC and VC fat (Calder et al., 1992; Garaulet et al., 2001; Kotronen et al., 2010; Hernandez‐Morante et al., 2011; Pinnick et al., 2012; Petrus et al., 2017). Only two studies reported site‐specific differences in LA concentrations. Schäfer and Overvad (1990) found statistically significantly lower LA concentrations in abdominal SC AT than in gluteal SC AT (n = 6; mean difference 0.5 percentage points). Sledzinski et al. (2013) found lower LA concentrations in abdominal SC AT than in VC AT (n = 16; mean difference 2.3 percentage points).
Around half of the studies (7 out of 13) that investigated gender‐specific differences in LA and ALA composition of AT did not report an association between gender and SC or VC AT composition with respect to these two FA (sample sizes ranged from 10 to 556 individuals per group) (Ruiz‐Gutierrez et al., 1992; Tjonneland et al., 1993; Popp‐Snijders and Blonk, 1995; Garaulet et al., 2001; Mamalakis et al., 2006, 2008; Dahm et al., 2011). The studies in which differences were observed reported mainly higher LA concentrations in women compared with men (sample sizes ranged from 14 to 2,308 per group) (Bolton‐Smith et al., 1997; Mamalakis et al., 1998, 2002b; Petrova et al., 2011; Pinnick et al., 2012; Zatońska et al., 2012). Zatońska et al. (2012) reported the gender difference only in the rural, but not in the urban population. Except for Pinnick et al. (2012) who did not investigate ALA and for Zatońska et al. (2012) who found, in an unadjusted analysis, higher ALA concentrations in SC AT in rural women compared with rural men, ALA concentrations in SC AT were not different between men and women in the studies mentioned above.
With respect to the influence of the weight status (two studies), Garaulet et al. (2011) did not find significant differences in LA concentration of abdominal SC or VC AT between overweight (n = 20, body mass index (BMI) 25–29.9 kg/m2), obese (n = 20, 30–39.9 kg/m2) and morbidly obese (n = 20, ≥ 40 kg/m2) individuals. Equally, Scazzocchio et al. (2020) found similar concentrations of LA in VC AT in 17 normal weight and 19 obese individuals.
With respect to the influence of age (three studies), Bolton‐Smith et al. (1997) showed a significant inverse relationship between age and LA SC AT concentration of the outer upper arm in both men (n = 2,308) and women (n = 2,049), recruited from the general population. This was observed in a linear regression analysis after adjusting for height, weight, smoking, dietary polyunsaturated FAs, saturated FAs and monounsaturated FAs and total energy, plus menopausal status for women. Schäfer et al. (1989) found no significant difference in LA and ALA gluteal SC AT between women > 64 years (n = 28) and women < 36 years (n = 33) of age. Hodson et al. (2014) showed higher LA concentrations in gluteal SC AT in post‐menopausal women (n = 23) than in premenopausal women (n = 19) (mean difference: 1.3 percentage points).
In the only study that looked at different ethnicities living in Europe, Cruz et al. (2001) did not find significant differences in LA and ALA abdominal SC AT concentrations of individuals from Latin America (n = 8), South Asia (n = 8) and Northern Europe (n = 9) who had been living in the UK > 1 year.
With respect to the influence of diet (two studies), Garaulet et al. (2001) observed a significant correlation between the dietary intake of LA and its concentration in omental AT and between dietary intake of ALA and its concentration in abdominal SC, perivisceral and omental AT in 84 obese individuals. Sanders et al. (1978) found significantly higher LA concentrations in SC AT of the triceps in 12 vegans compared with 12 omnivores (mean difference: 14.4 percentage points). Even though ALA concentrations were also somewhat higher (mean difference: 0.9 percentage points), this did not reach statistical significance.
In the only study that investigated the influence of physical activity/training, Danner et al. (1984) reported that LA concentrations in AT (site not reported) increased by around 2 percentage points in 15 rowers after 210‐day intense training that followed a 4‐month holiday without training (i.e. from mean (SD) 14.8 (2.4) to 16.9 (2.2) FA%). The increase was, however, not statistically significant. In control subjects without physical activity, no increase of the LA concentration in AT during this period was observed. The E% provided by polyunsaturated FA did not change, neither in the rowers nor in the control subjects, during the study. This was assessed by a 3‐day dietary history.
There were no data to evaluate the influence of medication use.
Overall, the Panel considers that there is no evidence that the data set would need to be stratified for the factors listed above for the subsequent evaluation of data. The only exception was for age, for which stratification may have been relevant. However, in the absence of access to the individual data, only the age categories reported in the papers were available, which were too broad to create a meaningful stratification.
Data analysis across the included studies: scatter plots for other potential influencing factors
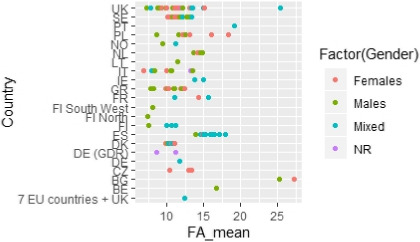
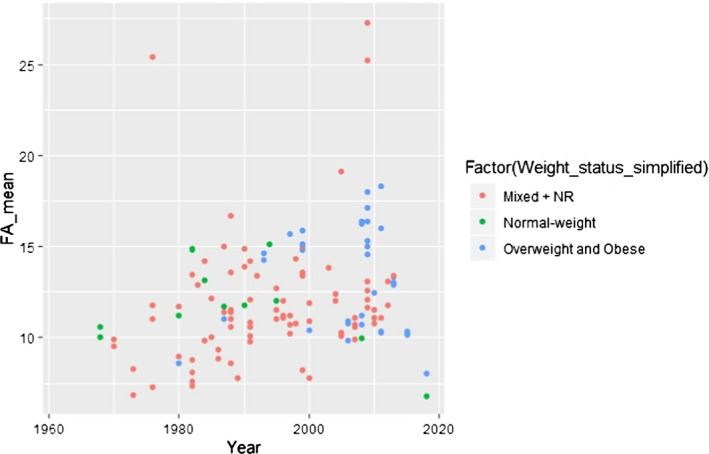
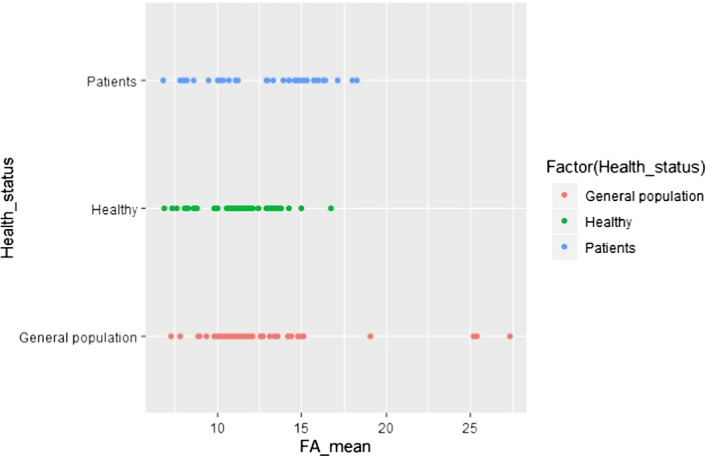
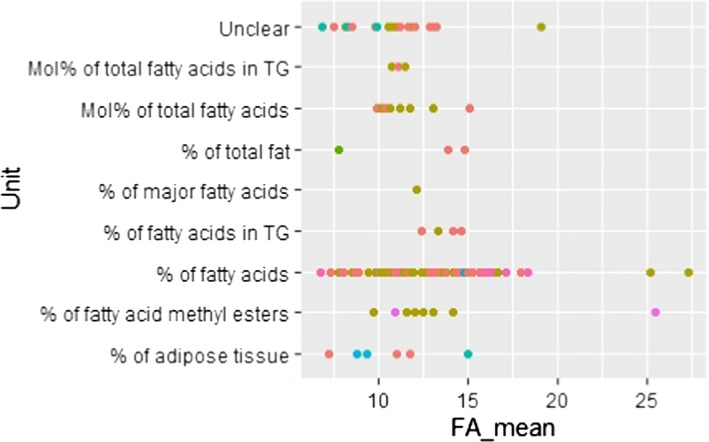
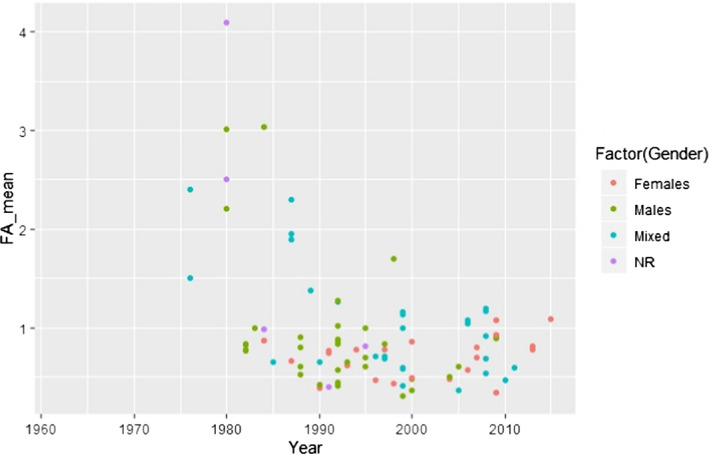
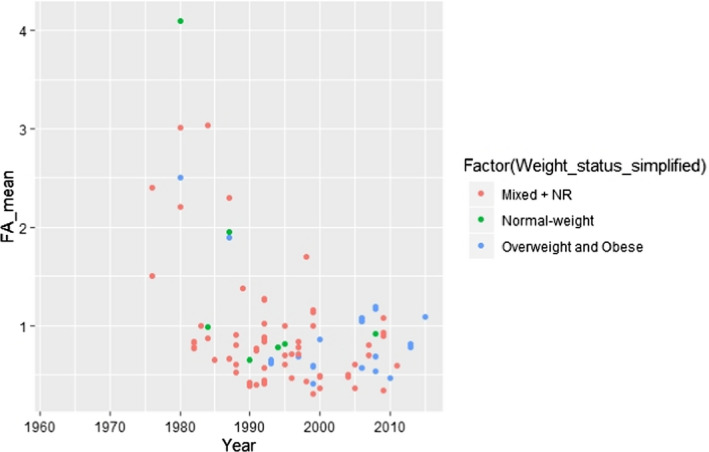
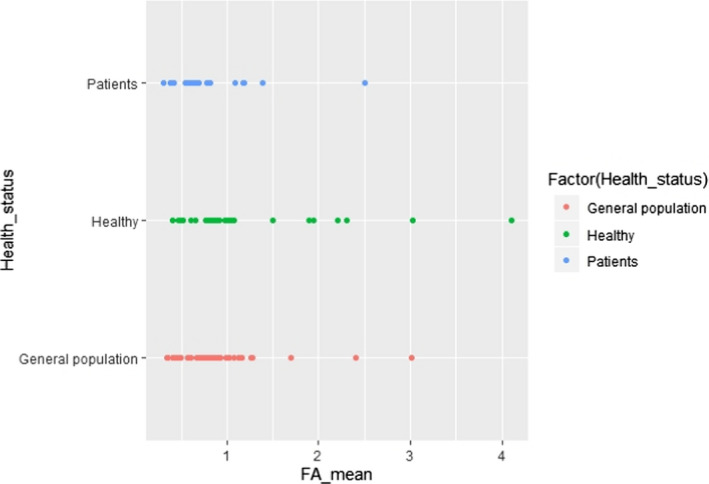
Additional potential influencing factors or parameters, not present in the predefined list, were further investigated visually in scatter plots, with regard to either LA or ALA concentration in AT. These factors were the combination of gender and country (Appendices C.2 and C.11) or gender and year of study conduct (Appendices C.3 and C.12), weight status and year of study conduct (Appendices C.6 and C.15), health status (i.e. patients, healthy subjects, general population) (Appendices C.7 and C.16) and unit of measurement of the FA concentration in AT (Appendices C.9 and C.18).
In order to attribute a year of study conduct to a study reported in a publication, the year in which the last AT sample was obtained was taken as the year of study conduct. If this information was not reported, the year was approximated based on the publication year minus two. The inspection of the scatter plots revealed that studies conducted before around 1990 showed generally higher ALA AT concentrations and lower LA AT concentrations than the ones conducted thereafter. The Panel assumed that this might be due to more refined analytical methods of FA analysis that have become available in more recent years. Therefore, the Panel decided to use in the following modelling exercise (described further down) only studies conducted following and including the year 1990 (as classified using the above‐described criteria) in order to ensure comparability of results. Also, only results from a single sampling site per individual were included. This concerned the studies by Garaulet et al. (2001), Kotronen et al. (2010), Hernandez‐Morante et al. (2011), Pinnick et al. (2012), Petrus et al. (2017) and Sledzinski et al. (2013), for which results from abdominal SC AT (arbitrary choice) were included. For the study by Calder et al. (1992), the averaged FA composition over 14–15 sampling sites that was reported in the article was used.
The Panel also decided to include studies irrespective of the unit in which the FA concentration was provided (i.e. w% of AT, w% of total fat, w% of FA, mol% of total AT, w% of FA in triglycerides, w% of FA methyl esters or unclear). The impact of the diversity in units of measurement on the overall conclusion was considered negligible, having in mind the overall heterogeneity of the included data and the fact that the scatter plots did not reveal an association between the unit of measurements used and the reported values of the FA concentration of AT.
The selection of studies conducted in 1990 and thereafter resulted in the inclusion of 54 studies in total. Out of these, 53 studies reported on LA and 42 on ALA.
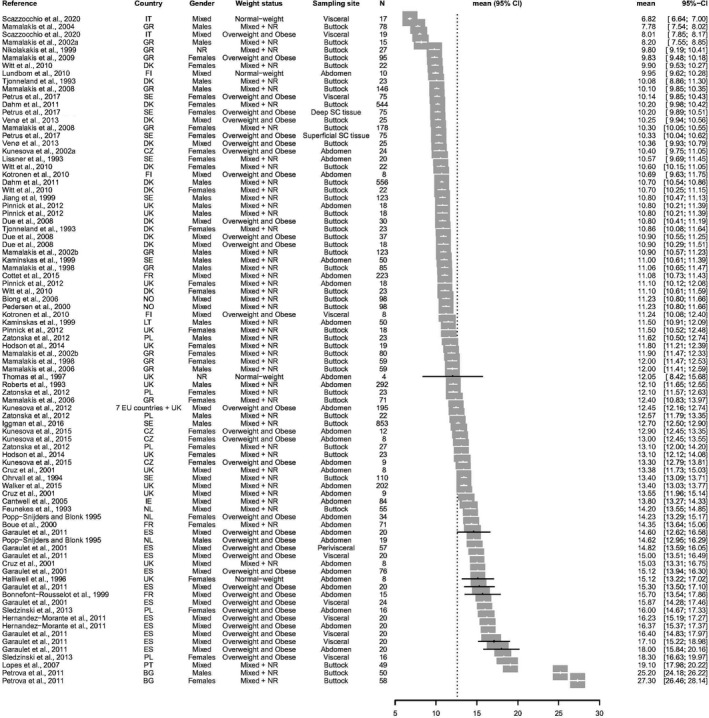
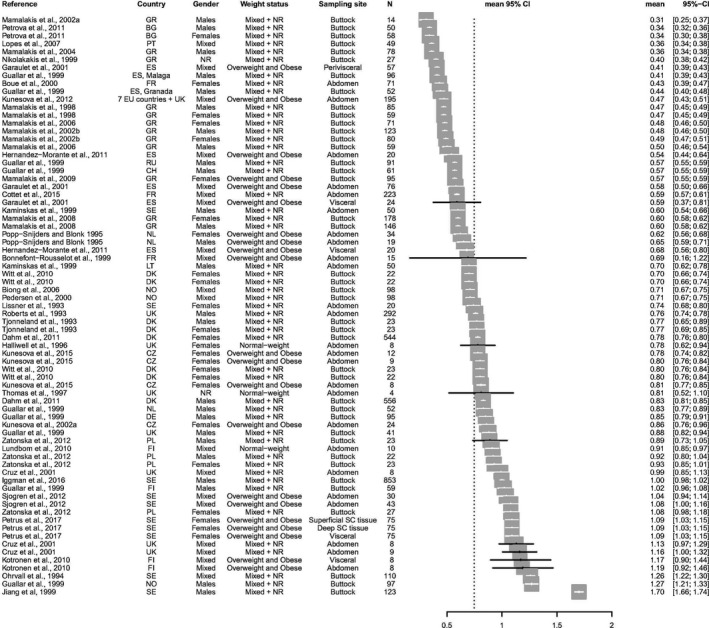
The list of studies and their results that were finally included in the assessment are given as forest plots in Appendix B.
Data analysis of the finally included data set after visual inspection
The majority of studies reported on mean concentrations of LA and ALA in AT without providing information on the overall distribution of individual data. In three studies conducted in three different European countries (Calder et al., 1992; Leichsenring et al., 1992; Boué et al., 2000), information on the range of LA and ALA concentrations in AT was available. For three other studies (Simonsen et al., 1998; Andersen et al., 1999; Sjögren et al., 2012), including seven European countries, the interquartile range was provided. Out of the studies mentioned above, Leichsenring et al. (1992), Boué et al. (2000) and Sjögren et al. (2012) also reported on the mean concentrations.
Therefore, the Panel decided to use in further calculations the mean concentrations of LA and ALA in AT, as this information was available for most studies. The fifth percentiles (P5) of the empirical distributions of the mean LA and ALA concentrations in AT were, however, only based on data from two (LA) and three (ALA) countries and on 156 and 249 subjects, respectively. Considering the uncertainties around the robustness of the values for P5 derived from a limited number of countries and subjects, the Panel decided to explore the use of statistical modelling or resampling (i.e. bootstrapping) techniques in order to increase the confidence in the values observed in the lower tails of the empirical distributions. The decision to fit the most appropriate probability distribution to the mean values of LA and ALA concentrations in AT reported in the included studies (using the R package ‘rriskDistributions’) instead of bootstrapping was taken based on a simulation exercise done in another context by EFSA (internal data). This exercise showed that fitting theoretical distributions to empirical data rather than using bootstrapping from empirical data led to results closer to the true values, especially in situations in which the tails of a distribution should be reliably estimated. Even though the most evident distribution for data that are bounded by 0 and 1, such as data on a proportion (e.g. the FA concentration of AT), is the beta distribution, the Panel considered other distributions that were not limited to 1 at the upper bound if they fitted the data but were restricted by 0 at the lower bound. This was done as the aim of the assessment was to estimate the lower rather than the upper tail of the distribution and to obtain the best fit for the lower tail.
For LA concentrations in AT, the following distributions were identified through ‘rriskDistributions’ as potentially compatible with the empirical data: beta, gamma, lognormal. For ALA concentrations in AT, the distributions were: beta, gamma, lognormal, Weibull and Gompertz.
The identification of the distribution best fitting the data was based on the Akaike information criterion (AIC; i.e. the lower the criterion, the better the fit). For LA concentrations in AT, the lognormal distribution was identified as the best fitting distribution (AIC = –344.00), followed by the gamma distribution (AIC = –338.34) and the beta distribution (AIC = –335.72). For ALA concentrations in AT, the gamma distribution showed the best fit (AIC = –634.31), the beta distribution resulted in an AIC of –634.29 and the lognormal in an AIC of –634.28. Because the AICs of the gamma, beta and lognormal distributions for ALA concentrations were close to each other, the Panel decided to perform a sensitivity analysis on the impact on the final outcome of using these three distributions (see Section 3.1.4). At the same time, sensitivity analyses were conducted for the three potentially fitting distributions for LA concentrations in AT, even though, from the AIC, there was clearly less support for the gamma and beta distribution than for the lognormal distribution, but they were less than 10 units away from the best AIC. Figure 1 depicts the fit of those distributions that were, in principle, compatible with the empirical data (each circle representing a mean FA concentration reported for a given population in a given study). Figure 2 shows how well the best fitting distribution relates to the empirical data, which is then used further in the assessment (i.e. the lognormal distribution for LA and the gamma distribution for ALA concentrations in AT). The P5 of the mean LA and ALA concentrations in AT derived from these theoretical distributions was 8.5% and 0.36%, respectively (in comparison to the P5 of the empirical data: 9.7% and 0.36%, respectively).
Figure 1.
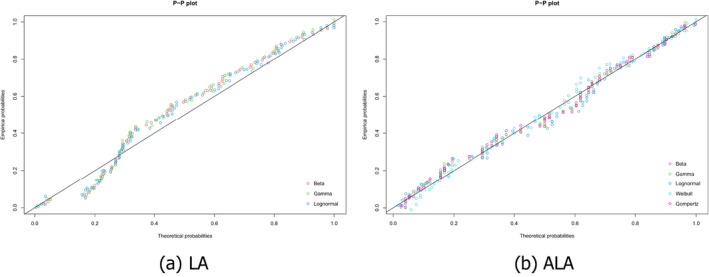
Probability‐probability (P‐P) plots of different theoretical probability distributions compatible with the empirical distributions of mean (a) linoleic acid (LA) and (b) alpha‐linolenic acid (ALA) concentrations in adipose tissue (AT)
Figure 2.
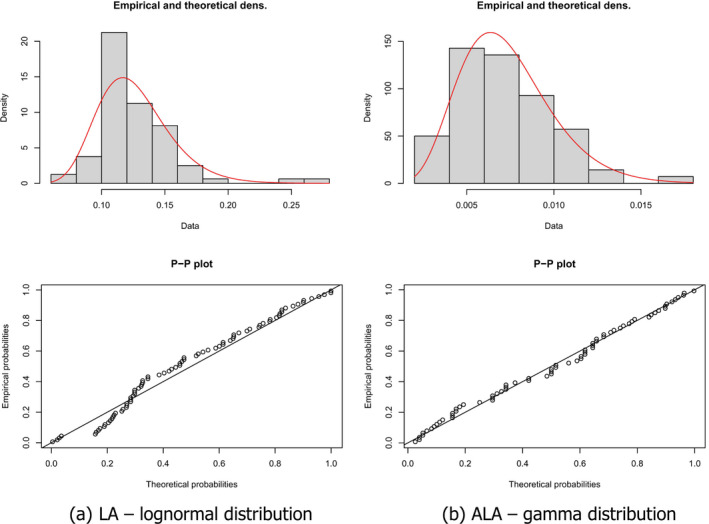
Comparison of empirical distributions of (a) mean LA AT concentrations (given as proportion) with a theoretical lognormal distribution and (b) mean ALA AT concentrations (given as proportion) with a theoretical gamma distribution (density and P‐P plots, theoretical distribution represented as a red curve in the density graph)
3.1.2. Release of fatty acids from adipose tissue
Through the literature search, only two pertinent studies were retrieved (Kunešová et al., 2002, 2012) that met the original inclusion criteria (i.e. human studies in healthy volunteers or overweight or obese individuals with T2DM, hypertension or hyperlipidaemia conducted in Europe; see Section 2.1.2 and protocol in Appendix D). In addition, from hand search, the Panel retrieved two studies from the US (Phinney et al., 1990; Tang et al., 1993).
Phinney et al. (1990), in the US, studied FA composition in AT before and after a diet that provided between 1,800 and 2,500 kJ/day (420–600 kcal/day). The study included 12 and 21 obese females (group 1 and 2, respectively) in two different study sites. AT biopsies were taken from the buttock in group 1 and from the lateral thigh in group 2. The diets were continued until 18 or 27 kg, respectively, were lost. In group 2, it took 140 days, while the duration of energy restriction in group 1 was not reported. Two and seven women, respectively, did not finish the intervention. In both groups, women either consumed a formula‐based TDR or an energy‐restricted diet consisting of self‐selected foods. In both groups, a significant reduction in AT ALA concentrations (16 and 17%, respectively) was observed. In group 1, ALA concentrations declined in all subjects and in group 2 in 12 out of 14 participants. Considering individual subject data, no consistent pattern was observed for LA.
Tang et al. (1993), as a follow‐up of the study conducted by Phinney et al. (1990), examined the effect of supplementing a TDR with either canola oil providing 1.6 g/day ALA or linseed oil providing 1.1 g/day ALA on the ALA concentration in AT. The calorie contents of the TDRs ranged from 1,882 to 2,927 kJ/day (450–700 kcal/day). Five obese women received a formula‐based diet for 4–5 months and lost on average 23.9 kg (group 1). Six women consumed a diet based on self‐selected foods for 2–3 months (group 2). Average weight loss in group 2 was 17.4 kg. AT biopsies were taken from the thigh. Weight loss led to a significant reduction of AT ALA concentrations by 20% in group 1 and by 17% in group 2. LA concentrations reduced non‐significantly by 1% and 7%, respectively.
Kunešová et al. (2002) investigated FA concentrations on 11 pairs of obese monozygotic twins (i.e. n = 22; age: 23–48 years, BMI: 24.8–41.2 kg/m2) with a stable body weight in the 6 months before the study. Participants underwent an institutionalised weight reduction programme that consisted in a 1‐week run‐in period with a eucaloric diet and a 4‐week weight reduction programme on a TDR with 1,600 kJ/day (383 kcal/day). During this time, participants were also subjected to light to moderate physical activity. Abdominal AT biopsies were obtained at the end of the run‐in period, and at the end of the weight stabilisation period at the institution. During the TDR period, subjects lost on average 8.27 kg of weight. ALA concentrations in AT were reduced by around 11.4% and LA concentrations by around 3.8% following the TDR consumption, but the reductions did not reach statistical significance.
Kunešová et al. (2012) examined the effect on AT composition of FA in subjects participating to the Diet, Obesity and Genes (DIOGENES) study, a multi‐centre intervention study in eight European countries. This study recruited families with at least one overweight and obese parent that underwent an 8‐week TDR intervention with 3,200 kJ/day (766 kcal/day), supplemented with 400 g/day of vegetables, before randomisation into one of five energy ad libitum diets. Data on abdominal SC AT composition are presented for 195 subjects (out of 773 adults randomised). During the TDR period, subjects lost on average 11 kg of weight. ALA concentrations were statistically significantly reduced by around 13% during this period. No changes were observed for LA.
The Panel notes that the limited data available indicate that the relative release of ALA from AT during weight loss is higher than of LA.
The Panel considers that the available evidence does not allow to establish whether a correction factor needs to be applied to the LA and ALA concentrations of AT in order to derive the amount of these FAs that is released from AT during weight loss. Therefore, the Panel will assume in the following a proportionate release of both LA and ALA during weight loss.
3.1.3. Range of weight loss when consuming total diet replacements for weight control
A total of 12 studies were identified through the literature search. The target had been to identify trials reporting on the consumption of TDRs providing between 2,510 and 5,020 kJ (600 and 1,200 kcal) of energy per day and weight loss at time points up to 8 weeks. Two trials did not fully comply with these two requirements. Wing et al. (1995) administered TDRs with a calorie content of 2,467 kJ (590 kcal) and 2,484 kJ (594 kcal) per day and Yang et al. (1981) reported numeric average weight loss data only for the time point of 9 weeks and not for other intermediate time points (for which only graphic representations were available). These two studies were included as they were considered to provide useful information, in particular, in the light of the limited data that were available.
In eight studies (Yang et al., 1981; Hill et al., 1987; Phinney et al., 1988; Davies et al., 1989; Stanko et al., 1992a,b; Vazquez and Kazi, 1994; Wing et al., 1995), participants were confined in metabolic wards for the duration of the studies. Results of these studies therefore include only data from fully compliant subjects. In addition, Lee et al. (2010) dropped all subjects from analysis that were not compliant. Behary et al. (2019) report that, on average, 3,442 kJ/day (823 kcal)/day were consumed by participants, the target being 3,346 kJ/day (800 kcal/day) and Van Dale et al. (1987) described an average daily energy intake of 2,785 kJ/day (666 kcal/day) with the target of 2,844 kJday (680 kcal/day) per day. Compliance can, therefore, also be considered as high. Finally, Gils Contreras et al. (2018) classified 94% of individuals as being compliant (> 80% of sachets consumed) based on counts of returned empty packages, which was 96.7 ± 6.8 (SD)% of sachets distributed.
Most of the included studies were on obese subjects. Only two studies (Van Dale et al., 1987; Lee et al., 2010) also included overweight participants in addition to obese ones. Energy contents of diets ranged from 2,467 kJ (590 kcal) to 4,266 kJ (1,020 kcal) per day. Study durations were from 3 to 9 weeks. Average weekly weight loss in the included studies ranged from 1.18 to 2.58 kg per week.
In two studies (Hill et al., 1987; Van Dale et al., 1987), loss of fat mass was investigated by hydrostatic underwater weighing, which is considered as a valid methodology for body composition analysis. Hill et al. (1987) found that fat loss amounted to around 57% of weight loss in a sedentary dieting group and Van Dale et al. (1987) observed that fat loss amounted to around 76% of weight loss. Other studies, in which loss of fat mass (Stanko et al., 1992b; Lee et al., 2010; Gils Contreras et al., 2018; Behary et al., 2019) was assessed by bioelectrical impedance analysis were not taken into account, as the Panel considers that this method is generally not appropriate to assess small changes in body fat when used alone, particularly in obese subjects and/or when significant changes in body water compartments occur. The results for loss of fat mass in the study by Lee et al. (2010) assessed by air displacement plethysmography were the same as for weight loss and were therefore considered implausible by the Panel. Hence, the results of this study with respect to loss of fat mass were not taken into account.
The percentage of weight that is lost as fat was estimated by the Panel as average of the values cited above (i.e. 57 and 76%) and rounding up to the closest 10% (i.e. 66.5% rounded up to 70%). Weekly fat loss in all included studies was therefore calculated by multiplying by 0.7 the weekly mean weight loss extracted from these studies. To these data (15 data points in total13), a theoretical distribution was fitted, as was done for LA and ALA concentrations in AT tissue (Section 3.1). The best fit was observed for the normal distribution (Figure 3), based on the lowest value for AIC (215.84). The P5 of this theoretical distribution for fat mass loss was 863 g/week, as compared with the P5 of the empirical distribution of 949 g/week.
Figure 3.
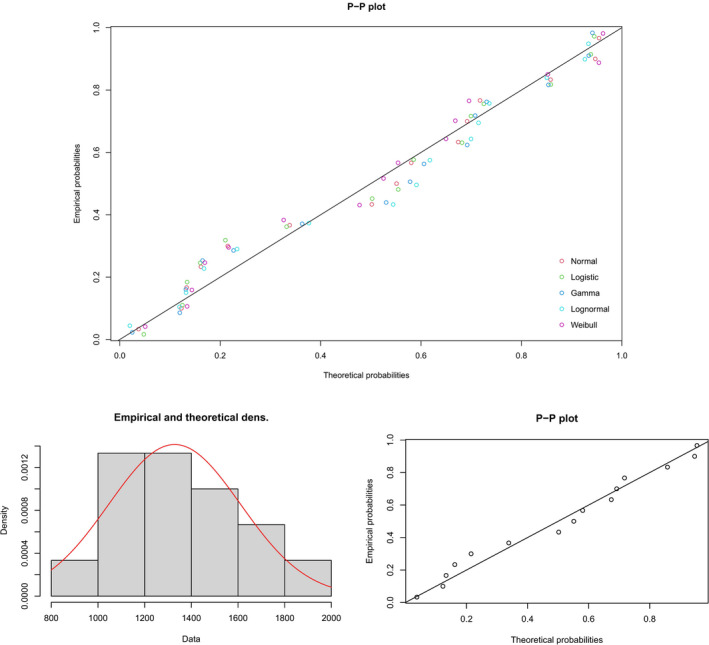
Probability‐probability (P‐P) plot of different theoretical probability distributions compatible with the empirical distribution of mean fat mass loss (g/week) (upper graph) and comparison of the empirical distribution with a theoretical normal distribution (density graph, theoretical distribution represented as a red curve in the density graph) (lower graphs)
3.1.4. Linoleic acid and alpha‐linolenic acid release from adipose tissue during weight loss in subjects consuming TDR
In total, 10,000 data points were generated in the R software following the theoretical distributions with the best fit to the data, i.e. the lognormal distribution for LA, the gamma distribution for ALA and the normal distribution for fat loss. Values, taken randomly by R from the lognormal distribution for LA and the gamma distribution for ALA, were multiplied by random values taken from the normal distribution for fat loss. This thus generated an overall distribution of weekly release of LA and ALA from AT during weight loss in overweight or obese subjects consuming TDRs. The resulting distributions are depicted in Figure 4.
Figure 4.
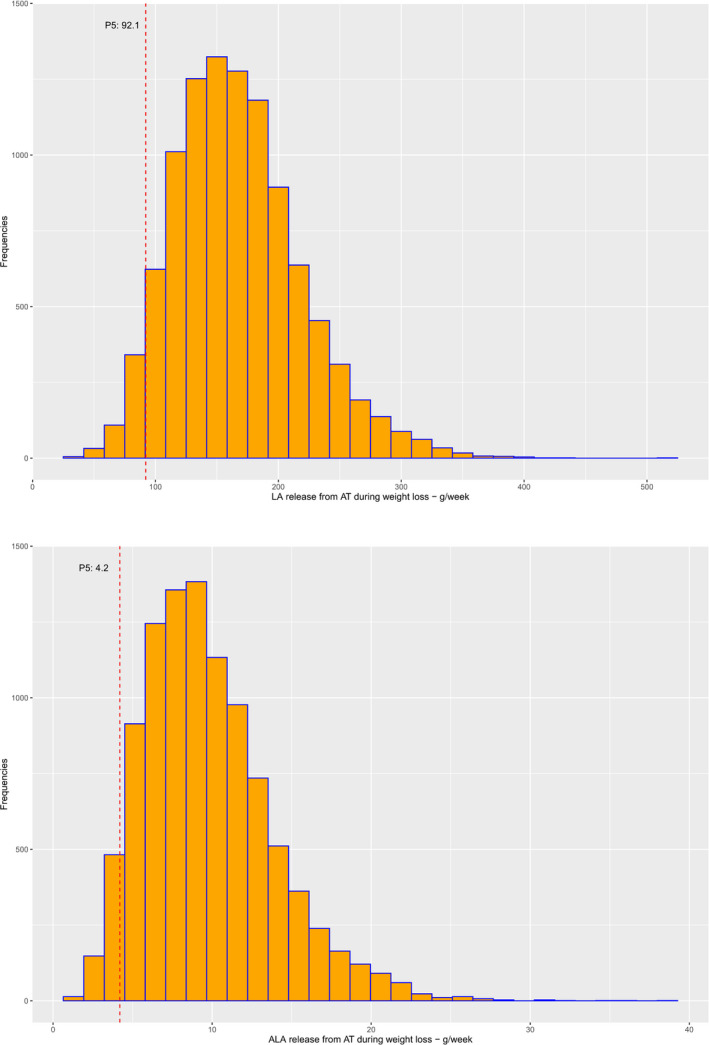
Distribution of weekly release of linoleic acid (LA) and alpha‐linolenic acid (ALA) from adipose tissue (AT) during weight loss in overweight and obese individuals consuming total diet replacements for weight control (TDRs) (P5 indicated as red dotted line)
From these distributions, the P5 was taken as a conservative estimate of the weekly LA and ALA release from AT during weight loss in overweight and obese subjects consuming TDRs, i.e. 92.1 g/week for LA (13.2 g/day) and 4.2 g/week for ALA (0.60 g/day).
Sensitivity analyses were conducted using the second and third best fitting distributions to the data on LA and ALA concentration in AT and multiplying random values drawn from these distributions with random values from the normal distribution of fat loss. The use of a gamma distribution (AIC = –338.34) to the data on LA concentration in AT resulted in a P5 of LA release from AT during weight loss of 92.3 g/week (13.2 g/day), and the use of a beta distribution (AIC = –335.72) in a P5 of 89.9 g/week (12.8 g/day). For ALA, the use of the beta distribution (AIC = –634.29) and lognormal distribution (AIC = –634.28) resulted in P5 of 4.14 and 4.28 g/week, respectively (0.59 and 0.61 g/day).
Sensitivity analyses were also conducted for data on fat mass loss with the second and third best fitting distributions (i.e. gamma and Weibull distributions). The best fitting distributions for LA (i.e. lognormal distribution) and ALA (i.e. gamma distribution) concentration in AT were kept. The use of gamma and Weibull distributions (both AIC = 215.90) to the data on LA concentration in AT resulted in a P5 of LA release from AT during weight loss of 94.0 g/week (13.4 g/day) and 91.0 g/week (13.0 g/day), respectively. For ALA, this resulted in a P5 of 4.3 g/week (0.61 g/day) and 4.0 g/week (0.57 g/day).
The Panel notes the uncertainties that are associated with the derived values for the following reasons: (1) the modelling was based on means and not on individual data, (2) variation among individuals may be greater than variation among means, (3) weight status and the extent of obesity before weight loss may have an impact on the percentage of weight that is lost as fat, which could not be taken into account in the modelling due to the missing data, (4) there is no information to judge whether the LA and ALA concentration in AT used in the modelling is representative of the FA AT concentration of individuals consuming TDRs. These uncertainties may lead either to an under‐ or an overestimation of the release of FA from AT during weight loss.
3.1.5. Conclusions on the minimum content of linoleic acid and alpha‐linolenic acid in total diet replacements for weight control
Even taking into account these uncertainties, the Panel concludes that the amount of LA released from AT during weight loss in overweight or obese subjects consuming TDRs is sufficient to cover the AI for this FA in the reference subject, as explained in Section 1.3. Therefore, there is no need to add LA to TDRs.
The Panel also concludes that around 40% (i.e. 0.6 g/day) of the AI of ALA could be provided by the release of ALA from AT during weight loss in overweight or obese individuals consuming TDRs. Therefore, a minimum of 0.8 g/day ALA needs to be supplied by TDRs in order to meet the AI for this FA in the reference subject.
3.2. Minimum fat content in total diet replacements for weight control
In its previous Opinion (EFSA NDA Panel, 2015b), the Panel concluded that ‘the available evidence is insufficient to establish a minimum fat content in total diet replacements for weight control beyond their content of [essential fatty acids] EFA’. The minimum content of LA and ALA proposed for TDRs in the previous opinion led to a minimum fat content in TDRs of around 20 g/day, under the assumption that oils used to supply these FAs have a maximum EFA content of 55–75 FA%.
Consistent with this consideration, 1.5 g of oil with an ALA content of 55% supplies 0.8 g ALA and would be equivalent to the minimum fat content in TDRs, if no other fats are added. The Panel notes that such a low fat content in TDRs has been associated with an increased risk of gallstone formation, as reviewed in the Panel's previous opinion (EFSA NDA Panel, 2015b) and further described below.
The comprehensive literature search for intervention studies investigating the effect of different fat contents in energy‐restricted diets on gallstone formation, biliary sludge formation and/or gallbladder emptying did not yield any results. Therefore, the Panel relied on the four intervention studies that had already been reviewed in its previous Opinion (Stone et al., 1992; Gebhard et al., 1996; Festi et al., 1998; Vezina et al., 1998). As supporting evidence, the Panel also considered data from observational studies or intervention studies that were either single‐arm or in which only one arm consumed a TDR without further co‐intervention, even if they did not meet the initial inclusion criteria of the search (protocol amendment 5). These studies were retrieved by an additional non‐systematic search of the literature not foreseen in the protocol. This was done in an attempt to complement the limited data from two‐arm intervention studies. It was undertaken in February 2021, in PubMed. The five publications retrieved are described further down.
Table 1 provides an overview on the evidence, considered in this Statement, on the incidence of gallstone formation and on gallbladder emptying following the consumption of TDRs with differing fat content.
Table 1.
Summary of studies reporting on incidence of gallstone formation and on gallbladder emptying following the consumption of total diet replacements for weight control (TDRs), supportive evidence shaded in grey
| Publication | Duration (weeks) | N | kcal/d | Fat g/d | Fat g/meal | Gallstones incidence % | Gallbladder emptying |
|---|---|---|---|---|---|---|---|
| Studies on gallstone formation | |||||||
| Broomfield et al. (1988) | 3 | 19 | 520 | 1 | 26 | n/a | |
| Liddle et al. (1989) | 8 | 51 | 520 | 1 | 26 | n/a | |
| Yang et al. (1992) | 16 | 248 | 520 | 1 | 11 | n/a | |
| Gebhard et al. (1996) | 12 | 6 | 520 | < 2 | 67 | n/a | |
| Shiffman et al. (1995) | 16 | 202 | 520 | 1–3 | 28 | n/a | |
| Festi et al. (1998) | 12 | 11 | 535 | 3 | 55 | n/a | |
| Johansson et al. (2014) | 6–10 | 3,320 | 500 | 8 | 1.5a | n/a | |
| Festi et al. (1998) | 12 | 11 | 577 | 12.2 | 0 | n/a | |
| Vezina et al. (1998) | 13 | 94 | 900 | 16 | 17 | n/a | |
| Vezina et al. (1998) | 13 | 178 | 900 | 30 | 11.2 | n/a | |
| Gebhard et al. (1996) | 12 | 7 | 900 | 30 | 0 | n/a | |
| Studies on gallbladder emptying | |||||||
| Stone et al. (1992) | n/a | 14 | 0 | n/a | Below maximal | ||
| Gebhard et al. (1996) | n/a | 6 | < 1 | n/a | Below maximal | ||
| Stone et al. (1992) | n/a | 14 | 4 | n/a | Below maximal | ||
| Stone et al. (1992) | n/a | 14 | 10 | n/a | Maximal | ||
| Gebhard et al. (1996) | n/a | 7 | 10 | n/a | Maximal | ||
| Stone et al. (1992 | n/a | 14 | 20 | n/a | Maximal | ||
d: day; g: gram; n: number of subjects in the study population; n/a: not applicable.
Gallstones requiring hospital care.
Among the four originally considered studies, there was only one randomised study that investigated gallstone formation on two isocaloric TDRs (2,238–2,414 kJ/day (535–577 kcal/day)) with varying fat contents in obese subjects (Festi et al., 1998). This study showed that consumption for 90 days of a TDR that provided 3 g/day fat led to the development of asymptomatic gallstones in six of 11 subjects (55%), while none of the 11 individuals on the TDR with 12.2 g/day developed gallstones. None of the subjects had gallstones at the beginning of the study.
A non‐randomised intervention study (Vezina et al., 1998) found that, in obese individuals, gallstone formation was similar in the groups that consumed a TDR (providing 3,766 kJ/day (900 kcal/day)) for 13 weeks with 16 g/day fat (n = 16 out of 94 developed gallstones; 17%) and the group that consumed a TDR with the same energy content, but with 30 g/day fat (n = 20 out of 178 developed gallstones; 11.2%). None of the subjects had gallstones at the beginning of the study. However, diets differed not only in the fat but also in dietary fibre content (11 and 15 g/day in the 16 g and 30 g/day fat groups, respectively), which could also have had an effect on the outcome.
Gebhard et al. (1996) reported the development of asymptomatic gallstones in four out of six individuals (67%) who consumed a TDR providing 2,176 kJ/day (520 kcal/day) with < 2 g of fat per day after having consumed the TDR for 12 weeks. None of the participants in the group who consumed a TDR (n = 7) with 3,766 kJ/day (900 kcal/day) and 30 g fat per day developed gallstones. None of the subjects had gallstones at the beginning of the study.
One non‐randomised (Stone et al., 1992) and one randomised intervention study previously described (Gebhard et al., 1996) found that gallbladder emptying was similar to gallbladder emptying at maximal stimulating conditions when a meal with a minimum of 10 g fat was consumed. This was not the case for meals with fat contents between 0 and 4 g. No other fat content per meal (between 4 and 10 g) was tested. Gallbladder stasis resulting from a reduced stimulus for gallbladder emptying has been proposed as one of the mechanisms by which diets inducing rapid weight loss may lead to gallstone formation (Festi et al., 2000).
Supportive evidence
From a non‐comprehensive literature search, the Panel retrieved the five publications described below. The Panel notes that there is uncertainty whether these publications represent the totality of observational or single‐arm intervention studies on TDRs reporting on gallstone formation/biliary sludge formation/gallbladder emptying.
In a matched cohort study, Johansson et al. (2014) investigated gallstone formation in individuals consuming a TDR providing 2,091 kJ/day (500 kcal/day, n=3320) and 8 g fat per day for 6–10 weeks. This was compared to a diet in which two meals were replaced by a meal replacement product; the diet providing 5,018–6,273 kJ/day (1,200–1,500 kcal/day, n = 3,320). No information on the approximate fat content of this overall diet was available. In total, 48 cases with gallstones that required hospital care per 6,361 person‐years occurred in the TDR group and 14 in the meal replacement group.
Broomfield et al. (1988), Liddle et al. (1989), Shiffman et al. (1995) and Yang et al. (1992) studied TDRs with a fat content of 1–3 g/day and an energy content of around 2,176 kJ/day (520 kcal/day). In these studies, 5 out of 19 subjects (26%, 3 weeks), 13 out of 51 (26%, 8 weeks), 57 out of 202 (28%, 16 weeks) and 27 out of 248 (11%, 16 weeks) newly developed gallstones after having consumed the TDR, respectively. Subjects with gallstones at the beginning of the study were either excluded from the studies (Broomfield et al., 1988; Liddle et al., 1989; Shiffman et al., 1995) or data were presented separately (Yang et al., 1992).
The Panel notes that, in the only randomised study that investigated gallstone formation on two isocaloric TDRs (Festi et al., 1998), gallstones did not occur when a TDR with 12.2 g fat/day was consumed while 55% of subjects developed gallstones with a TDR with a fat content of 3 g/day. However, this observation is based on only 11 subjects per group and gallstones have been observed in another study at fat contents higher than 12.2 g/day (i.e. 16 and 30 g/day) (Vezina et al., 1998).
The Panel also notes that two small intervention studies focussing on gallbladder emptying (which limitations have been described above) indicate that around 10 g fat per meal is needed to reach gallbladder emptying equal to maximal stimulating conditions (Stone et al., 1992; Gebhard et al., 1996). With a total daily fat content in a TDR of 12.2 g/day, this will not be achieved under the assumption that TDRs are consumed in at least three portions per day.
The Panel considers that a minimum content of 1.5 g fat in a TDR as derived from the minimum content of ALA (see Section 3.1.5) is associated with an increased risk of gallstone formation. Hence, the minimum fat content in a TDR cannot be derived only from the minimum content of ALA proposed by the Panel. The Panel, however, considers that the limited available data do not allow to establish a minimal fat content in TDRs for the prevention of gallstone formation that is attributable to a too low fat content of the diet. There is some evidence that 10 g fat per meal is required for maximal gallbladder emptying. The Panel assumes a consumption of TDR in three meals per day and finally proposes, until further scientific evidence becomes available, to maintain the minimum fat content in TDRs at a level of (at least) 20 g/day, as in the Panel's previous opinion (EFSA NDA Panel, 2015b).
3.3. Maximum magnesium content in total diet replacements for weight control
3.3.1. Potential mechanisms of action
Mg absorption takes place in the distal small intestine, mainly through a paracellular process that is driven by electrochemical gradients and solvent drag. Transcellular absorption is a saturable process and seems to be significant only at low dietary intakes. At usual intakes, Mg absorption is generally considered to be 40–50%, but figures from 10 to 70% have also been reported (EFSA NDA Panel, 2015a). Fractional Mg absorption diminishes with increasing Mg intake in a non‐linear manner. The non‐linearity has been suggested to be the result of the transcellular absorption mechanism reaching its absorption maximum at around 120–145 mg of Mg intake per bolus, while the paracellular absorption mechanism continues with absorption at a rate of around 7% (Fine et al., 1991b). The part of Mg that remains unabsorbed, e.g. at high doses when the transcellular absorption mechanism reaches saturation, acts as an osmotic agent and may cause diarrhoea (Fine et al., 1991a,b). Mg‐induced diarrhoea is characterised by high faecal Mg output and may be distinguished from diarrhoea from other causes by measuring faecal Mg concentrations (Fine et al., 1991a). Fine et al. (1991a) proposed as an upper bound of ‘normal’ 355 mg (14.6 mmol) Mg per day in faeces and observed that, for each 24 mg (1 mmol)/day increase in faecal Mg above the upper bound of normal, stool weight augmented by around 7.3 g.
3.3.2. Supplemental magnesium and risk of developing diarrhoea
The Panel originally set out to retrieve intervention studies in which (i) different doses of Mg were administered (including a zero (placebo) dose), (ii) in populations without apparent co‐morbidities, or in overweight or obese individuals with T2DM, hypertension or hyperlipidaemia and (iii) which reported on the incidence of diarrhoea (or the absence of adverse effects) as well as (iv) on the criteria that were used to diagnose diarrhoea. However, no such studies were retrieved through the search.
The Panel notes that studies in which the incidence of diarrhoea is self‐reported by participants without using predefined diagnostic criteria are at high risk of bias, because of the interindividual differences in the perception of what constitutes diarrhoea. Among those studies at high risk of bias, cross‐over studies are more reliable than parallel studies, as bowel habits are described in both periods by the same person and reports are subject to the same subjective interpretations. Therefore, in the absence of studies in which diarrhoea was diagnosed according to objective criteria, the Panel decided to base its evaluation on results of cross‐over studies in which the incidence of diarrhoea was self‐reported (protocol amendment 3).
In addition, the Panel also considered studies conducted in non‐overweight/non‐obese individuals with mild to moderate hypertension treated with diet only that would have not met the original inclusion criteria of healthy non‐overweight/non‐obese individuals (protocol amendment 4). As these individuals were not under medication, the study population was considered appropriate.
The criteria applied in the current evaluation excluded a number of studies that were originally taken into account by the SCF (2001) in order to set the UL for Mg.
The 11 studies that met the inclusion criteria for the present evaluation are listed in Table 2.
Table 2.
Cross‐over studies on differing magnesium doses reporting on the incidence of diarrhoea or the absence of adverse effects (ordered by increasing Mg daily dose)
|
Study study location |
Study population: health status, gender (females %), age [years] | Total N (reference population for N with diarrhoea) | Mg form Mg vehicle | Mg dose [mg/d] | Mg duration (washout) [d] | n with diarrhoea in Mg group (%)* | n with diarrhoea in placebo group (%) |
|---|---|---|---|---|---|---|---|
|
Kato et al. ( 2004 ) Japan |
Healthy Males Mean: 31 |
25 (25) |
Magnesium oxide Tablets (after meals) |
150 | 7 (7–10) | 0 (0) | 0 (0) |
|
Navarrete‐Cortes et al. ( 2014 ) Mexico |
NIDDM/mean BMI (SD) 30.55 (5.72) kg/mc Mixed (64) Mean (SD): 53 (8) |
98 (56) |
Magnesium lactate Tablets (with a meal) |
360 | 90 (90) | 0 (0) | 0 (0) |
|
Cappuccio et al. ( 1985 ) United Kingdom |
Hypertension not on medication Mixed (47) Mean (range): 52 (33–66) |
17 (17) |
Magnesium‐aspartate hydrochloride Tablets |
365 | 30 (0) | 0 (0) | 0 (0) |
|
Widman et al. ( 1993 ) Sweden |
Mild hypertension not on medication Mixed (12) Mean (SD): 50 (6) |
17 (16) |
Magnesium hydroxide Tablets |
365 | 21 (21) | 0 (0) | 0 (0) |
|
Cosaro et al. ( 2014 ) Italy |
Healthy Males Mean (SD): 260 (3) |
16 (14) |
Magnesium pidolate Powder (empty stomach before meal) |
368 | 56 (28) | 2 (14) | 0 (0) |
|
Purvis et al. ( 1994 ) United States |
NIDDM/mostly obese Mixed (86) Mean (SD): 54 (13) |
33 (28) |
Magnesium chloride Tablets |
384 | 42 (14) | 41 (14) | 21 (7) |
|
Marken et al. ( 1989 ) United States |
HealthyMixed (46)Range: 18–65 | 50 (47) | Magnesium oxideCapsules | 476 | 60 (0) | 5 (11) | 1 (2) |
|
Kishimoto et al. ( 2010 )Japan |
HealthyMalesMean (SE): 420 (3) | 16 (16) | Magnesium chlorideFood | 500 | Single doses (≥ 6) | 0 (0) | 0 (0) |
|
Shechter et al. ( 2012 ) Israel |
Healthy Mixed (49) Mean (SD): 53 (8) |
41 (40) |
Magnesium oxide Tablets |
520 | 30 (30) | 5 (13) | 3 (8)2 |
|
Widman et al. ( 1993 ) Sweden |
Mild hypertension not on medication Mixed (12) Mean (SD): 50 (6) |
17 (16) |
Magnesium hydroxide Tablets |
972 | 21 (21) | 0 (0) | 0 (0) |
|
Dolberg et al. ( 2017 ) Denmark |
Healthy Males Mean (range): 22 (20‐24) |
10 (10) |
Magnesium hydroxide Tablets (with 150 mL water) |
1,094 | Single doses (≥ 6) | 0 (0) | 0 (0) |
|
Vu et al. ( 2000 ) The Netherlands |
Healthy Mixed (50) Mean (SE): 21 (3) |
8 (8) |
Magnesium sulfate Overnight fasting ≥ 10 h |
3,000 | Single doses (NR) | 3 (38) | NR |
|
Vu et al. ( 2000 ) The Netherlands |
Healthy Mixed (50) Mean (SE): 21 (3) |
8 (8) |
Magnesium sulfate With a meal |
3,000 | Single doses (NR) | 8 (100) | NR |
d: day(s); h: hours; Mg: magnesium; N: number of subjects; NIDDM: non‐insulin‐dependent diabetes mellitus; NR: not reported; SD: standard deviation; SE: standard error.
Calculated % of cases with diarrhoea from the reference population when not reported in the paper (rounded numbers).
Reported as increased frequency of stools or diarrhoea.
Comparator being magnesium citrate given in a dose of 296 mg/day.
The Mg form, the doses (150–3,000 mg/day), the dosage forms and patterns and the duration of administration (single dose to 90‐day administration) in these studies were diverse. The Panel notes that the differences in Mg forms, the dosage forms and patterns investigated and the duration of administration, together with the uncertainties associated with the diagnosis of diarrhoea in the available studies, do not permit the derivation of an Mg content in TDRs below which diarrhoea is not expected to occur. Nor do these differences and uncertainties allow an evaluation of whether different Mg forms or the consumption of Mg with or without a meal have differential effects.
In its proposal to the European Commission, TDMR suggested to raise the maximum Mg content in TDRs to 350 mg/day. In the absence of data that allows the Panel to conclude on a content in TDRs below which diarrhoea is not expected to occur, the Panel will, however, comment on the likelihood of occurrence of Mg‐induced diarrhoea when TDRs contain a maximum Mg dose of 350 mg/day.
The three articles highlighted by TDMR (Christensen et al., 2011, 2018; Lean et al., 2018) in support of their request did not report on the Mg doses used in these parallel studies nor did they report on the criteria used to diagnose diarrhoea. The Panel notes that these studies cannot be used to determine a content of Mg in TDRs that does not cause diarrhoea.
In the following, the five cross‐over studies that investigated Mg doses between 300 and 400 mg/day are described.
Navarrete‐Cortes et al. (2014) evaluated, in 56 subjects with T2DM not receiving insulin (mean BMI 30.55 (SD 5.72) kg/m2), the effect of consuming 360 mg/day Mg in the form of Mg lactate supplementation in tablets, divided into two doses per day taken after meals, vs. placebo. Mg and placebo were administered for 3 months each, with a 3‐month washout period in between. It is reported that no adverse effects occurred during both periods. Even though this study does not specifically report on diarrhoea, the absence of adverse effects may indicate that no severe diarrhoea occurred.
Cappuccio et al. (1985) administered 365 mg/day Mg given in the form of Mg‐aspartate hydrochloride divided into three doses per day for a month to 17 hypertensive individuals not on blood pressure lowering medication or thiazide diuretics. This was compared with a 1‐month placebo period that followed the Mg period without a washout. Diarrhoea did not occur in any of the subjects during the study periods.
Widman et al. (1993) analysed 16 individuals with mild hypertension not on blood pressure lowering medication or any medication that could interfere with Mg administration. They received 365 mg/day Mg given in the form of Mg hydroxide and placebo, presumably as a single daily dose, for 3 weeks each, with a 3‐week washout period in between. Diarrhoea did not occur in any of the subjects during the study periods.
Cosaro et al. (2014) studied 14 males without hypertension, diabetes, obesity, kidney or liver disease, and previous cardiovascular events and not taking lipid‐lowering medication or continuous therapy with non‐steroidal anti‐inflammatory medication. Placebo and Mg pidolate powder were taken twice a day before meals for 8 weeks with a 4‐week washout period in between. Mg was administered in a daily dose equivalent to 368 mg elemental Mg. Two participants developed mild diarrhoea (not further defined) in the Mg period. The diarrhoea disappeared when the dose of Mg was reduced for a few days (extent and duration of reduction not reported).
Purvis et al. (1994) assessed 28 subjects with T2DM not receiving insulin (mean BMI 32.2 (SD 7.1) kg/m2) treated by diet only or on stable doses of oral hypoglycaemics. Mg chloride was administered in a sustained release form as a single dose in an amount of 384 mg/day for 6 weeks and the effect was compared with placebo. The washout period was 2 weeks. Four subjects during the Mg period and two during the placebo period reported an increased frequency of stools or diarrhoea. It is not indicated whether the two participants reporting gastrointestinal effects during the placebo period overlapped with those reporting effects during the Mg period. It is also not reported how many individuals experienced diarrhoea and how many an increased frequency of stools. Also, there is no report on the severity of the diarrhoea that was observed. The Panel notes that no conclusions can be drawn from this study with respect to the risk of developing diarrhoea following Mg consumption, as the incidence of diarrhoea is not reported separately from the occurrence of an increased stool frequency, the latter not being an adverse effect.
The Panel notes that, in three out of four studies in which Mg was administered in doses of 360–368 mg/day and from which conclusions could be drawn, no adverse effects or diarrhoea were reported. The Panel also notes that, in the fourth study, the diarrhoea that developed in two out of 14 participants was self‐reported as mild and disappeared when the dose of Mg was reduced for a few days. There was no consistent pattern in the data that allows conclusions to be drawn on whether dividing the Mg administration into multiple daily doses reduces the risk of developing diarrhoea as compared with a single daily dose. The Panel also notes that, in the studies in which diarrhoea was observed, the aetiology has not been verified.
3.3.3. Conclusions on the maximum magnesium content in total diet replacements for weight control
Taking into account that
in three out of four studies that investigated supplemental Mg doses of 360–368 mg/day, no adverse effects or diarrhoea were reported, and that
in one study in which diarrhoea was observed, the diarrhoea occurred only in two participants and was classified as mild,
the Panel considers that the likelihood that Mg‐induced diarrhoea occurs at a severity that may be considered of concern for overweight and obese individuals consuming TDRs (who more often suffer from constipation than diarrhoea (Christensen et al., 2011; Lean et al., 2018)) is low when the total maximum Mg content in TDRs is 350 mg/day.
4. Conclusions
The Panel concludes that
there is no need to add LA to TDRs, as the amount released from AT during weight loss when consuming TDRs is sufficient to cover the AI for this FA;
the release of ALA from AT during weight loss when consuming TDRs is not sufficient to cover the AI and a minimum of 0.8 g/day ALA needs to be supplied by TDRs in order to meet the AI for ALA;
the minimum fat content of TDRs of 20 g/day as derived in the previous opinion is proposed to be maintained until the availability of further evidence, given the considerable uncertainty as to the amount of fat required for reducing the risk of gallstone formation;
the likelihood that Mg‐induced diarrhoea occurs at a severity that may be considered of concern for overweight or obese individuals consuming TDRs is low when the total maximum Mg content in TDRs is 350 mg/day.
Abbreviations
- AI
adequate intake
- AIC
Akaike Information Criterion
- ALA
alpha‐linolenic acid
- AR
average requirement
- AT
adipose tissue
- BE
Belgium
- BG
Bulgaria
- BMI
body mass index
- CH
Switzerland
- CI
confidence interval
- CZ
Czechia
- DASH
Dietary Approaches to Stop Hypertension (study)
- DE
Germany
- DIOGENES
Diet, Obesity and Genes (study)
- DK
Denmark
- DRV
dietary reference value
- E%
percentage of energy intake
- EFA
essential fatty acids
- EKE
expert knowledge elicitation
- ES
Spain
- FA
fatty acid(s)
- FFM
fat free mass
- FI
Finland
- FR
France
- FSG
food for specific groups
- FSMP
food for special medical purposes
- GDR
German Democratic Republic
- GR
Greece
- IE
Ireland
- ISO
International Organization for Standardization
- LA
linoleic acid
- LCD
low calorie diet
- LT
Lithuania
- Mg
magnesium
- MRI
magnetic resonance imaging
- N
number of subjects
- NDA Panel
Panel on Nutrition, Novel Foods and Food Allergens
- NIDDM
non‐insulin dependent diabetes mellitus
- NL
Netherlands
- NO
Norway
- NR
not reported
- P5
fifth percentile
- P‐P
probability‐probability
- PL
Poland
- PRI
population reference intake
- PRISMA
Preferred Reporting Items for Systematic Reviews and Meta‐Analyses
- PT
Portugal
- Q
question
- RCT
randomised controlled trial
- RU
Russia Federation
- SC
subcutaneous
- SCF
Scientific Committee on Food
- SD
standard deviation
- SE
standard error
- SE
- SEM
standard error of the mean
- T2DM
type 2 diabetes mellitus
- TDMR
Total Diet & Meal Replacements Europe
- TDR
total diet replacement for weight control
- TG
triglycerides
- ToR
terms of reference
- UK
United Kingdom
- UL
tolerable upper intake level
- US
United States
- VC
visceral
- VLCD
very low calorie diet
- VKM
Norwegian Scientific Committee on Food Safety
- WHO
World Health Organisation
Appendix A – PRISMA flow charts for the literature searches
1.
PRISMA flow chart for Q1
Aimed at identifying data on the linoleic acid (LA) and alpha‐linolenic acid (ALA) concentrations in from adipose tissue (AT) and their release from AT during weight loss.
PRISMA flow chart for Q2
Aimed at identifying data on the weight loss achieved when consuming total diet replacements for weight control.
PRISMA flow chart for Q3
Aimed at identifying data on supplemental Mg intake and risk of developing diarrhoea.
PRISMA flow chart for Q4
Aimed at identifying data on intake of dietary fat in energy‐restricted diets and risk of gallstone/biliary sludge formation and gallbladder emptying.
Appendix B – Studies included in the assessment of the linoleic and alpha‐linolenic acid concentrations in adipose tissue
1.
The following two forest plots are graphical presentations of the available data on the linoleic acid (LA) and alpha‐linolenic acid (ALA) concentrations in adipose tissue. Data are presented for studies published from the year 1990 onwards.
The studies are sorted by ascending point estimates. Each point estimate constitutes the mean fatty acid (FA) concentration for the specific study population, which is also indicated numerically (as percentage) in the seventh column. The 95% confidence interval (CI) around each point estimate is presented by a horizontal line (also indicated in the eight column).
B.1. Linoleic acid concentrations in adipose tissue – studies from 1990
B.2. Alpha‐linolenic acid concentrations in adipose tissue – studies from 1990
Footnotes to Appendices B.1 and B.2. BG = Bulgaria; CH = Switzerland; CI = confidence interval; CZ = Czechia; DE = Germany; DK = Denmark; ES = Spain; EU = European Union; FI = Finland; FR = France; GR = Greece; IE = Ireland; IT = Italy; LT = Lithuania; Mixed = study populations consisting of mixtures of weight statuses; N = number of subjects in the study population; NL = Netherlands; NO = Norway; NR = not reported; PL = Poland; PT = Portugal; RU = Russia Federation; SC = subcutaneous; SE = Sweden; UK = United Kingdom.
Appendix C – Scatter plots of fatty acid concentrations in adipose tissue
1.
The following scatter plots depict how the linoleic acid (LA) and alpha‐linolenic acid (ALA) concentrations in adipose tissue are affected by a number of variables, i.e. gender, country, year of study conduct, weight status, health status, sampling site, unit of measurement and some combinations of these criteria.
C.1. Mean linoleic acid concentration in adipose tissue by gender
C.2. Mean linoleic acid concentration in adipose tissue by gender and country
C.3. Mean linoleic acid concentration in adipose tissue by gender and year of study conduct
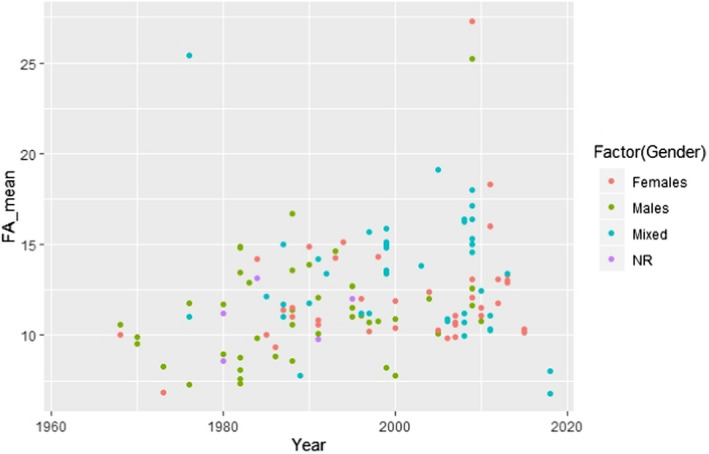
C.4. Mean linoleic acid concentration in adipose tissue by weight status
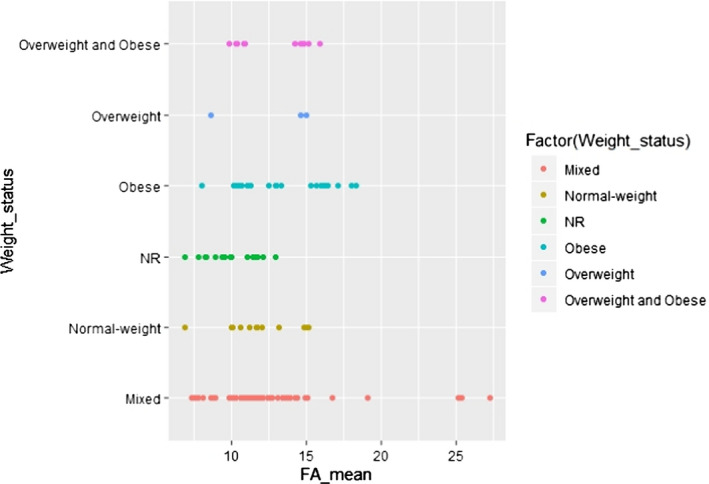
C.5. Mean linoleic acid concentration in adipose tissue by weight status collapsed into three categories (called in the following simplified)
C.6. Mean linoleic acid concentration in adipose tissue by weight status (simplified) and year of study conduct
C.7. Mean linoleic acid concentration in adipose tissue by health status
C.8. Mean linoleic acid concentration in adipose tissue by sampling site
C.9. Mean linoleic acid concentration in adipose tissue by unit of measurement
C.10. Mean alpha‐linolenic acid concentration in adipose tissue by gender
C.11. Mean alpha‐linolenic acid concentration in adipose tissue by gender and country
C.12. Mean alpha‐linolenic acid concentration in adipose tissue by gender and year of study conduct
C.13. Mean alpha‐linolenic acid concentration in adipose tissue by weight status
C.14. Mean alpha‐linolenic acid concentration in adipose tissue by weight status (simplified)
C.15. Mean alpha‐linolenic acid concentration in adipose tissue by weight status (simplified) and year of study conduct
C.16. Mean alpha‐linolenic acid concentration in adipose tissue by health status
C.17. Mean alpha‐linolenic acid concentration in adipose tissue by sampling site
C.18. Mean alpha‐linolenic acid concentration in adipose tissue by unit of measurement
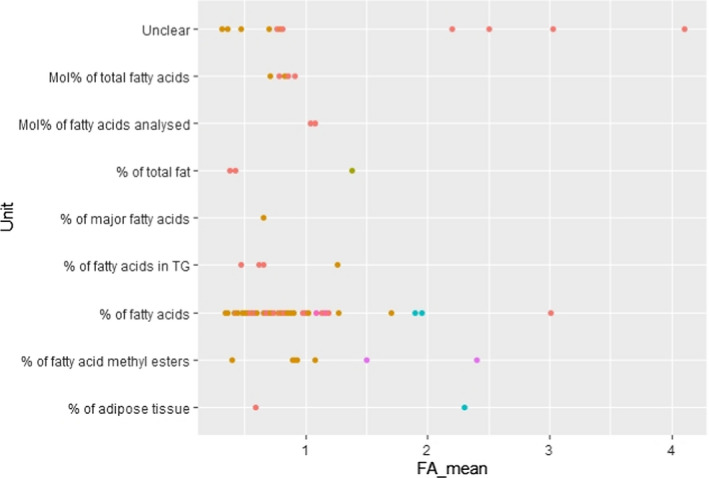
Abbreviations to Appendices C. BE = Belgium; BG = Bulgaria; CH = Switzerland; CZ = Czechia; DE = Germany; DK = Denmark; ES = Spain; FA = fatty acids; FI = Finland; FR = France; GDR = German Democratic Republic; GR = Greece; IE = Ireland; IT = Italy; LT = Lithuania; Mixed (Gender) = males and females; NL = Netherlands; NO = Norway; NR = not reported; PL = Poland; PT = Portugal; RU = Russia Federation; SC = subcutaneous; SE = Sweden; TG = triglycerides; UK = United Kingdom.
Appendix D – Protocol for the assessment of additional scientific evidence in relation to the composition of total diet replacements for weight control with respect to linoleic acid and alpha‐linolenic acid as well as magnesium
1.
Assessment questions and subquestions
The following protocol has been developed in line with current EFSA methodology (EFSA, 2020). As described in the 2020 EFSA ‘Draft framework for protocol development for EFSA's scientific assessments’, the extent of planning ahead of the assessment is determined as ‘low’ in order to accommodate the deadline (February 2021) and resources available, although this does not affect the complexity of the subject and of the methodologies to be applied.
In order to answer the Terms of Reference (ToR) as interpreted in Section 1.2 of the statement, the Panel considers that the following questions and subquestions need to be answered.
For point A (Section 1.2 ):
A.1. What is the amount of linoleic acid (LA) and alpha‐linolenic acid (ALA) stored in adipose tissue (AT) in overweight and obese individuals living in Europe?
In order to identify the scientific evidence relevant for the assessment, the following subquestions may need to be answered:
Do the methods for fat store measurement influence the results and, if so, what are the effects?
Is the LA and ALA concentration in AT proportionally different between normal weight, overweight and obese individuals?
Are the LA and ALA concentrations/proportions in AT different between different body sites (i.e. does the sampling site influence the assessment of the data), if so, what would be appropriate sampling sites in overweight and obese (not normal weight)?
What are the fat stores that are released first during weight loss?
What is the amount of LA and ALA that is released from AT during weight loss?
-
How is the proportion of LA and ALA in AT affected by:
lifestyle factors (i.e. diet, physical activity)
gender,
age,
ethnicity,
and/or diseases (i.e. hypertension, type 2 diabetes mellitus (T2DM), hyperlipidaemia, cardiovascular diseases) in the overweight and obese? If so, which disease(s)? In this context, it should also be considered that overweight and obese individuals consuming total diet replacements for weight control (TDRs) under medical supervision may not only be healthy individuals.
Does medication intake for the diseases listed above influence the LA and ALA concentration of AT?
To what extent are LA and ALA released from AT during weight loss reutilised?
A.2. Is there preferential release of certain fatty acids (FA) from AT during weight loss?
In addition to all potential influencing factors listed above that could also influence the release of LA and ALA from AT, the following sub‐questions may need to be answered to identify the relevant scientific evidence:
Does the release of LA and ALA from AT depend on the duration of energy restriction and/or intensity of weight loss?
Is there preferential release from certain fat depots?
What are appropriate study designs? Do subjects necessarily need to have lost weight or is a fasting state sufficient? What are the appropriate techniques to measure FA release from AT?
What is the expected range of weight loss in overweight and obese individuals consuming TDRs?
For point C (Section 1.2 ):
C.1. What is the lowest fat content consumed in an energy‐restricted diet that does not give rise to concern with respect to an increased risk of gallstone formation?
For points D (Section 1.2 ):
D.1. What is the amount of supplemental magnesium (Mg) consumed in the context of a diet (i.e. not on an empty stomach) that does not give rise to concern with respect to an increased risk of diarrhoea?
D.2. Is this amount different from the amount of supplemental Mg consumed on an empty stomach that does not give rise to concern with respect to an increased risk of diarrhoea?
For points B and E (Section 1.2 ):
These questions will be answered based on the outcome of the comprehensive literature searches for point A) and D), respectively.
Method for the study selection for inclusion/exclusion
The questions listed above will be answered based on a comprehensive literature search. The literature screening will be done in parallel and duplicates (first come first served basis) using DistillerSR® (Evidence Partners, Ottawa, Canada). Conflicts that may arise will be discussed and resolved internally during the screening process. Following the screening, the references will be exported to EndNote®. Reasons for exclusion at full‐text level will be recorded.
The comprehensive literature searches will be conducted by EFSA's information specialist in Embase and PubMed. No limitations on publication date (except for the search on gallstone formation) will be applied but limited to publications in English due to translation constraints.
Search strings are provided in Appendix E with numbers of items identified prior to deduplication. Hand search will be undertaken through the comprehensive reviews and meta‐analyses excluded during the screening but identified (with a label in Distiller) as potentially useful for this assessment. In addition, data that could be provided spontaneously by stakeholders and interested parties will be screened for their eligibility. Regarding Mg, previously published scientific reports of officially recognised scientific bodies, and the studies therein, e.g. SCF (2001) and VKM (2016), may be considered.
Planned approach towards the evidence retrieval from the scientific literature
The following sections will summarise the approach taken for the evidence retrieval to answer the predefined subquestions (Section 1.1).
Linoleic acid and alpha‐linolenic acid concentrations in adipose tissue and their release from adipose tissue during weight loss
References for these two questions will be screened jointly (to limit duplicates; Q1).
Eligible studies are:
Human intervention (clinical trials) or observational studies in adults not on an intentionally modified diet (irrespective of weight status) on the FA composition of human AT or FA release from human AT:
Studies in study populations living in Europe.
Studies in either healthy subjects or in overweight or obese individuals with hypertension, hyperlipidaemia or T2DM, but no other disease. Medication use should be restricted to medicines related to these diseases.
-
At title and abstract screening,
studies on FA composition of subcutaneous (SC) AT in which samples were taken by biopsies or from visceral (VC) AT taken during surgery or autopsy (incl. subsequent gas chromatography or other methods of sample analysis),
or studies on FA composition of SC AT before and after weight loss,
or studies on FA release during weight loss or in the fasting state via microdialysis of the tissue of interest or using isotopes to study the fate of the FA in metabolism.
-
To be finally included,
articles providing quantitative data on LA (18:2 (n‐6)) and/or ALA (18:3 (n−3)) concentration of AT. Preferably, full‐text papers should report on the study population characteristics (including age, sex), diet, weight and health status to be included. For large observational studies, this information may be provided in other publications on the same studies.
Not eligible are:
Systematic or narrative reviews and meta‐analyses. Although these may be used to provide background information to the general sections of the statement or for hand search of relevant references.
Protocols (as no results are reported), commentaries, editorials, letters to the editor, grey literature (PhD theses, extended abstracts, conference proceedings, etc.), or other publication types not peer‐reviewed (except contributions from stakeholders and interested parties).
Animal studies, in vitro studies and studies on cells.
Studies on infants, children and adolescents, pregnant and lactating women.
Studies on patients except for diseases listed above, as they may have an impact on the outcome of interest,
Studies on subjects on medication except related to the diseases listed above.
Studies on dietary FA/FA intake only.
Studies on FA concentration not measured in AT, e.g. in liver, muscle, brain, bone marrow, etc.
Studies on plasma free FA only.
Studies on individuals living outside of Europe.
-
Additional reasons at full‐text screening:□
studies not reporting on LA and/ALA quantitatively in SC AT or VC AT.
inappropriate method of measurement.
Range of weight loss when consuming TDR
Eligible studies are:
Human intervention studies (i.e. clinical trials, including single arm trials) in overweight or obese8 adults, in which TDRs with an energy content between 600 and 1,200 kcal (i.e. 2,510–5,020 kJ/day) are administered (i.e. within the permitted range as laid down in Commission delegated Regulation (EU) 2017/17981) and that report on weight loss (Q2):
As the terms ‘total diet replacement’ are rarely present in the abstracts, studies on ‘total meal replacement’, ‘very low calorie diet’ or ‘low calorie diet’ will be included at title and abstract screening if the diet investigated is in the energy range as specified in the Regulation.
TDRs may have been consumed with or without added/supplemental vitamins and/or minerals (considering vitamins and/or minerals will not have an impact on weight loss).
TDRs could have been consumed before bariatric surgery.
Overweight or obese subjects without apparent co‐morbidity, or with hypertension, hyperlipidaemia, T2DM, but no other disease. Medication use should be restricted to medicines related to the disease listed.
-
For practical reasons during the title and abstract screening, as the abstracts often do not provide information in a harmonised and/or detailed way, the following criteria will be applied:
the maximal duration of the studies included at title and abstract level should be less than 6 months (no minimal duration expected).
abstracts of studies only mentioning the daily energy restriction/deficit (compared to the initial diet) will be included for full‐text screening if this deficit is of at least ‐800 kcal/day (‐3,347 kJ/day), is expressed in absolute amount, or at least ‐40% energy/day if expressed as a percentage.
if the abstracts report the energy intake per kg body weight, the ‘rule of thumb’ to decide if the inclusion or exclusion at the next step is to multiply by 60 kg to calculate the calories/day.
-
For full‐text screening, additional criteria are:
studies in which body weight (or fat mass) is measured by investigators (i.e. no self‐reported body weight) using validated and standardised methods, before and immediately after energy restriction.
studies that report on the amount of weight loss, the caloric content of the TDR administered and the duration of the energy restriction.
studies that report on weight loss up to and including 2 months.
studies that report on compliance and how compliance was assessed.
Preferably, full‐text publications included at title and abstract screening should report on the study population characteristics (including age, sex), diet, weight and health status.
Not eligible are:
Studies on weight loss following diets not based on specifically designed foods, e.g. Atkins, DASH,14 Paleolithic, Mediterranean, ‘low carb’, ‘low fat’, vegetarian, ketogenic (if not with specially designed foods), low glycaemic diet (if not with specially designed foods/TDR) or ‘low calorie’/’low energy’/’hypocaloric’/’energy‐restricted’ diets using usual foods e.g. almonds, dairy, liquorice.
Studies on intermittent fasting.
Studies undertaken after bariatric surgery.
Studies on subjects with catabolic diseases (such as cancer) should be excluded, as these diseases may have an impact on the outcome of interest).
Studies in which TDR/energy‐restricted diets was consumed in combination with a medication for weight loss in all groups or with training/physical activity/exercise, or counselling/group sessions or with other foods (even if in limited amounts) in all groups (i.e. no arm with TDR/energy‐restricted diet and without co‐intervention).
Observational studies (e.g. surveys, case reports, case‐series, prospective cohort, case‐control, retrospective).
Systematic or narrative reviews and meta‐analyses. Although, these may be used to provide background information to the general sections of the statement or for hand search of relevant references.
Protocols (as no results are reported), commentaries, editorials, letters to the editor, grey literature (PhD theses, extended abstracts, conference proceedings, etc.), or other publication types not peer‐reviewed except contributions from stakeholders and interested parties.
Studies on infants, children and adolescents, pregnant and lactating women, normal weight/lean subjects (i.e. BMI below 25).
Animal studies, in vitro studies.
Studies on meal replacements (also called ‘partial meal replacement’), as these are not covered by Commission delegated Regulation (EU) 2017/1798 and Regulation (EU) 609/2013.
Studies not using a specifically formulated product (i.e. TDRs) or products with an energy content outside the range as specified in the Regulation.
Magnesium and risk of developing diarrhoea
Eligible studies are:
Human intervention studies (clinical trials) that report on the risk of developing diarrhoea associated with supplemental Mg or Mg intentionally added to food in adults (Q3):
The intervention studies should have at least two arms and compare different levels of supplemental/added Mg (possibly including a placebo) administered orally to adults.
Trials in which only the amount of Mg consumed between groups differ.
Studies in subjects either healthy or defined as overweight/obese presenting with hypertension, hyperlipidaemia or T2DM.
Studies reporting on adverse effects (including diarrhoea) associated with Mg administration. Studies included at title and abstract level may report on adverse effects only at full‐text level. Studies for which the full texts report on various adverse effects but not diarrhoea will be also considered as relevant for inclusion.
Studies that report on the definition of diarrhoea (applying the World Health Organization (WHO) criteria). For the full‐text screening, trials reporting on Mg administration and (the severity of) diarrhoea should preferably report on the frequency and consistency of the stools using validated assessment methods and documenting diarrhoea by the frequency of ≥ 3 loose or watery stools per day.11 Hence, a ranking of the final included studies may be made, distinguishing those with a reliable outcome assessment from those with an unreliable outcome assessment or improper reporting.
After full‐text screening, included studies should specify (among other parameters) the Mg dose and duration of administration in all groups.
Not eligible are:
Systematic or narrative reviews and meta‐analyses. However, these may be used to provide background information to the general sections of the statement or for hand search of relevant references.
Observational studies, animal studies, in vitro studies, studies in cells, protocols (as no results are reported), commentaries, editorials, letters to the editor, grey literature (PhD theses, extended abstracts, conference proceedings, etc.), or other publication types not peer‐reviewed except contributions from stakeholders and interested parties.
Studies in infants, children and adolescents, pregnant and lactating women, patients with diseases not mentioned above.
Studies comparing similar doses of different forms of Mg.
Single arm studies.
Studies that investigate the effect of Mg in combination with other substances
Studies on Mg naturally present in food, as the UL for Mg set by SCF only applies to readily dissociable Mg salts.
Studies in which Mg is not provided orally (e.g. injection, perfusion, infusion, nebulisation, intra‐muscular, intrathecal, intravenous or intraperitoneal administration, transdermal administration, bioresorbable devices, placental transfer), including those with an initial parenteral Mg administration.
Studies not on the subject of interest, e.g. on Mg content of foods or breast milk, on Mg deficiency/insufficiency/hypomagnesaemia, or on Mg status/biomarkers/adequacy.
At full‐text screening, publications not reporting on the Mg dose and duration of consumption.
At full‐text screening, publications not reporting on adverse events.
Dietary fat and risk of gallstone formation
Eligible studies are:
Human intervention studies investigating the relationship between low‐fat energy‐restricted diets and the risk of gallstone/biliary sludge formation or gallbladder emptying (Q4):
Studies published from the year 2014 and onwards, i.e. starting from the conclusion of the scientific assessment by EFSA NDA Panel (2015b).
Human intervention studies in adults comparing at least two different fat contents of energy‐restricted diets or investigating the effect of at least two test meals with varying fat content (on gallbladder emptying).
Studies that report on the fat and caloric content of the diet per day and the duration of the dietary intake.
Studies reporting on gallstone formation or biliary sludge formation or gallbladder emptying.
Preferably, full‐text papers of studies included at title and abstract screening should report on the study population characteristics (including age, sex), diet, weight and health status to be included.
Not eligible are:
Systematic or narrative reviews and meta‐analyses. Although these may be used to provide background information to the general sections of the statement or for hand search of relevant references.
Observational studies, animal studies, in vitro studies, protocols (as no results are reported), commentaries, editorials, letters to the editor, or other publication types not peer‐reviewed, grey literature (PhD theses, extended abstracts, conference proceedings, etc.) except contributions from stakeholders and interested parties.
Studies on infants, children and adolescents, pregnant and lactating women and studies on patients with diseases not listed above.
Method for data extraction from included studies
Data will be extracted in prespecified forms in Microsoft Excel® by one reviewer and a second reviewer will serve as validator. The data extraction will be divided according to the main literature searches, i.e. LA and ALA concentration of and release from human adipose tissue during weight loss (Q1), range of weight loss when consuming TDRs (Q2), Mg administration and risk of diarrhoea (Q3) and dietary fat and risk of gallstone formation (Q4). Missing data will only be collected by contacting corresponding authors in cases where clarification is critical for the interpretation of results or for the decision to include a study.
Method for appraising evidence
Appraisal of included studies is not foreseen.
Preliminary identification of sources of uncertainty and methods for prioritising them
Uncertainty analysis of the scientific assessment, i.e. identifying possible limitations in scientific knowledge and assessing their implications for scientific conclusions, will be discussed briefly, based on the EFSA guidance document on uncertainty (EFSA Scientific Committee, 2018). This implies, in particular, identifying the sources of uncertainty affecting the assessment, prioritising these sources based on their expected influence on the outcome/results and final overall discussions and planning how the uncertainty analysis will be handled. It is expected that the following identified sources of uncertainties will be discussed qualitatively (descriptive method) and no quantitative analysis will be undertaken.
The following uncertainties have been preliminary identified:
Uncertainty in the method and precision of measurement.
Exposure/compliance to TDR regimen/to Mg consumption.
Reporting/assessment of the adverse effect ‘diarrhoea’ by investigators
Publication bias.
Language (only English language considered).
Representativity/relevance for the EU population.
Uncertainties will be assessed by expert judgement.
Methods for analysing uncertainties individually and combined
Uncertainties will be identified at each step of the assessment, but no formal uncertainty assessment is foreseen.
Methods for synthesising evidence
The method for synthesising the evidence for points A–E (Section 1.2 of the statement) will be primarily semiquantitative.
A qualitative approach will be followed for those subquestions belonging to point A (Section 1.2 of the statement) answering to the influence of the methods of measurement and the extent of reutilisation of LA and ALA upon release from AT.
A conservative approach will be taken when assessing the evidence to cover the entire population that could potentially consume TDRs.
Expert knowledge elicitation (EKE) might be needed, taking into account the relevant EFSA guidance (EFSA, 2014),15 if updated composition requirements for ALA, LA and Mg are set.
Appendix E – Search strings
E.1. Linoleic acid and alpha‐linolenic acid concentrations in adipose tissue and their release from adipose tissue (Q1)
Date of search: 8 June 2020
Linoleic acid and alpha‐linolenic acid concentrations in adipose tissue
Embase
| Search | Query | Items identified |
|---|---|---|
| #8 | #6 NOT #7 | 3,690 |
| #7 | #3 AND #4 AND ([editorial]/lim OR [letter]/lim) | 16 |
| #6 | #5 AND [humans]/lim AND [english]/lim | 3,704 |
| #5 | #3 AND #4 | 10,416 |
| #4 | #1 OR #2 | 85,376 |
| #3 | ‘adipose tissue’/exp OR ’adipose tissue cell’/exp OR adipocyte*:ti,ab,kw OR (((adipose OR fat OR fatty) NEAR/3 (tissue* OR body)):ti,ab,kw) OR ((fat NEAR/3 (abdominal OR cell OR cells OR intraabdominal OR pad OR pads OR subcutaneous OR visceral)):ti,ab,kw) | 285,640 |
| #2 | (‘fatty acid’/de OR ’essential fatty acid’/exp OR ’unsaturated fatty acid’/exp OR ffa:ti,ab,kw OR ffas:ti,ab,kw OR efa:ti,ab,kw OR efas:ti,ab,kw OR pufa:ti,ab,kw OR pufas:ti,ab,kw OR ufa:ti,ab,kw OR ufas:ti,ab,kw OR ((fatty OR ’alpha linolenic’ OR alphalinolenic OR linolic OR linoleicOR ’n 3’ OR ’n 6’) NEAR/3 (acid OR acids)) OR linolate:ti,ab,kw OR linoleate:ti,ab,kw OR linolenate:ti,ab,kw OR ’omega 3’:ti,ab,kw OR ’omega 6’:ti,ab,kw OR omega3:ti,ab,kw OR omega6:ti,ab,kw OR ω3:ti,ab,kw OR ω6:ti,ab,kw OR ’18 3ω3’:ti,ab,kw OR ’183omega3’:ti,ab,kw OR ’18 3omega3’:ti,ab,kw) AND ’lipid composition’/exp | 19,889 |
| #1 | ((ffa OR ffas OR efa OR efas OR pufa OR pufas OR ufa OR ufas OR ’fatty acid’ OR ’fatty acids’ OR ’alpha linolenic acid’ OR ’alpha linolenic acids’ OR ’alphalinolenic acid’ OR ’alphalinolenic acids’ OR ’linoleic acid’ OR ’linoleic acids’ OR ’linolic acid’ OR ’linolic acids’ OR linolateOR linoleate OR linolenate OR ’n 3 acid’ OR ’n 3 acids’ OR ’n 6 acid’ OR ’n 6 acids’ OR ’omega 3’ OR ’omega 6’ OR omega3 OR omega6 OR ω3 OR ω6 OR ’18 3ω3’ OR ’183omega3’ OR ’18 3omega3’) NEAR/5 (amount* OR biops* OR composition OR concentration* OR constituent* OR content* OR distribution* OR level OR levels OR pattern* OR percentage* OR profile*)):ti,ab,kw | 78,162 |
PubMed
| Search | Query | Items identified |
|---|---|---|
| #13 | Search: ((((((Amount[tiab] OR biops*[tiab] OR composition[tiab] OR concentration*[tiab] OR constituent[tiab] OR content*[tiab] OR distribution*[tiab] OR level[tiab] OR levels[tiab] OR pattern*[tiab] OR percentage*[tiab] OR profile[tiab]) AND (“Fatty Acids”[Mesh:NoExp] OR “Fatty Acids, Unsaturated”[Mesh] OR “Fatty Acids, Essential”[Mesh] OR Fatty acid[tiab] OR fatty acids[tiab] OR FFA[tiab] OR FFAs[tiab] OR EFA[tiab] OR EFAs[tiab] OR PUFA[tiab] OR PUFAs[tiab] OR UFA[tiab] OR UFAs[tiab] OR Alpha linolenic acid[tiab] OR Alpha linolenic acids[tiab] OR Alphalinolenic acid[tiab] OR Alphalinolenic acids[tiab] OR Linoleic acid[tiab] OR Linoleic acids[tiab] OR Linolic acid[tiab] OR Linolic acids[tiab] OR linolate[tiab] OR linoleate[tiab] OR Linolenate[tiab] OR “omega 3”[tiab] OR “omega 6”[tiab] OR omega3[tiab] OR omega6[tiab] OR ((“n 3”[tiab] OR “n 6”[tiab]) AND (acid[tiab] OR acids[tiab])) OR “183ω3”[tiab] OR “18 3ω3”[tiab] OR “183omega3”[tiab] OR “18 3omega3”[tiab] OR ω3[tiab] OR ω6[tiab])) AND (“Adiposity”[Mesh] OR “Adipose Tissue”[Mesh] OR “Adipocytes”[Mesh] OR adipocyte*[tiab] OR Adipose tissue*[tiab] OR Adipose body[tiab] OR Abdominal fat[tiab] OR Body fat[tiab] OR Fat cell[tiab] OR Fat cells[tiab] OR Fat pad[tiab] OR Fat pads[tiab] OR Fat tissue*[tiab] OR Fatty tissue*[tiab] OR Intraabdominal fat[tiab] OR Subcutaneous fat[tiab] OR Visceral fat[tiab)) NOT | 6,512 |
| ((“Animals”[Mesh] NOT (“Animals”[Mesh] AND “Humans”[Mesh])))) NOT ((rat[ti] OR rats[ti] OR mouse[ti] OR mice[ti] OR swine[ti] OR porcine[ti] OR murine[ti] OR sheep[ti] OR lambs[ti] OR pigs[ti] OR piglets[ti] OR rabbit[ti] OR rabbits[ti] OR cat[ti] OR cats[ti] OR dog[ti] OR dogs[ti] OR cattle[ti] OR bovine[ti] OR monkey[ti] OR monkeys[ti] OR trout[ti] OR marmoset*[ti]))) AND (“english”[Language])) NOT ((“editorial”[Publication Type]) OR (“letter”[Publication Type])) Sort by: Most Recent | ||
| #12 | Search: (“editorial”[Publication Type]) OR (“letter”[Publication Type]) Sort by: Most Recent | 1,610,464 |
| #11 | Search: (((((Amount[tiab] OR biops*[tiab] OR composition[tiab] OR concentration*[tiab] OR constituent[tiab] OR content*[tiab] OR distribution*[tiab] OR level[tiab] OR levels[tiab] OR pattern*[tiab] OR percentage*[tiab] OR profile[tiab]) AND (“Fatty Acids”[Mesh:NoExp] OR “Fatty Acids, Unsaturated”[Mesh] OR “Fatty Acids, Essential”[Mesh] OR Fatty acid[tiab] OR fatty acids[tiab] OR FFA[tiab] OR FFAs[tiab] OR EFA[tiab] OR EFAs[tiab] OR PUFA[tiab] OR PUFAs[tiab] OR UFA[tiab] OR UFAs[tiab] OR Alpha linolenic acid[tiab] OR Alpha linolenic acids[tiab] OR Alphalinolenic acid[tiab] OR Alphalinolenic acids[tiab] OR Linoleic acid[tiab] OR Linoleic acids[tiab] OR Linolic acid[tiab] OR Linolic acids[tiab] OR linolate[tiab] OR linoleate[tiab] OR Linolenate[tiab] OR “omega 3”[tiab] OR “omega 6”[tiab] OR omega3[tiab] OR omega6[tiab] OR ((“n 3”[tiab] OR “n 6”[tiab]) AND (acid[tiab] OR acids[tiab])) OR “183ω3”[tiab] OR “18 3ω3”[tiab] OR “183omega3”[tiab] OR “18 3omega3”[tiab] OR ω3[tiab] OR ω6[tiab])) AND (“Adiposity”[Mesh] OR “Adipose Tissue”[Mesh] OR “Adipocytes”[Mesh] OR adipocyte*[tiab] OR Adipose tissue*[tiab] OR Adipose body[tiab] OR Abdominal fat[tiab] OR Body fat[tiab] OR Fat cell[tiab] OR Fat cells[tiab] OR Fat pad[tiab] OR Fat pads[tiab] OR Fat tissue*[tiab] OR Fatty tissue*[tiab] OR Intraabdominal fat[tiab] OR Subcutaneous fat[tiab] OR Visceral fat[tiab)) NOT ((“Animals”[Mesh] NOT (“Animals”[Mesh] AND “Humans”[Mesh])))) NOT ((rat[ti] OR rats[ti] OR mouse[ti] OR mice[ti] OR swine[ti] OR porcine[ti] OR murine[ti] OR sheep[ti] OR lambs[ti] OR pigs[ti] OR piglets[ti] OR rabbit[ti] OR rabbits[ti] OR cat[ti] OR cats[ti] OR dog[ti] OR dogs[ti] OR cattle[ti] OR bovine[ti] OR monkey[ti] OR monkeys[ti] OR trout[ti] OR marmoset*[ti]))) AND (“english”[Language]) Sort by: Most Recent | 6,532 |
| #10 | Search: ”english”[Language] Sort by: Most Recent | 26,364,599 |
| #9 | Search: ((((Amount[tiab] OR biops*[tiab] OR composition[tiab] OR concentration*[tiab] OR constituent[tiab] OR content*[tiab] OR distribution*[tiab] OR level[tiab] OR levels[tiab] OR pattern*[tiab] OR percentage*[tiab] OR profile[tiab]) AND (“Fatty Acids”[Mesh:NoExp] OR “Fatty Acids, Unsaturated”[Mesh] OR “Fatty Acids, Essential”[Mesh] OR Fatty acid[tiab] OR fatty acids[tiab] OR FFA[tiab] OR FFAs[tiab] OR EFA[tiab] OR EFAs[tiab] OR PUFA[tiab] OR PUFAs[tiab] OR UFA[tiab] OR UFAs[tiab] OR Alpha linolenic acid[tiab] OR Alpha linolenic acids[tiab] OR Alphalinolenic acid[tiab] OR Alphalinolenic acids[tiab] OR Linoleic acid[tiab] OR Linoleic acids[tiab] OR Linolic acid[tiab] OR Linolic acids[tiab] OR linolate[tiab] OR linoleate[tiab] OR Linolenate[tiab] OR “omega 3”[tiab] OR “omega 6”[tiab] OR omega3[tiab] OR omega6[tiab] OR ((“n 3”[tiab] OR “n 6”[tiab]) AND (acid[tiab] OR acids[tiab])) OR “183ω3”[tiab] OR “18 3ω3”[tiab] OR “183omega3”[tiab] OR “18 3omega3”[tiab] OR ω3[tiab] OR ω6[tiab])) AND (“Adiposity”[Mesh] OR “Adipose Tissue”[Mesh] OR “Adipocytes”[Mesh] OR adipocyte*[tiab] OR Adipose tissue*[tiab] OR Adipose body[tiab] OR Abdominal fat[tiab] OR Body fat[tiab] OR Fat cell[tiab] OR Fat cells[tiab] OR Fat pad[tiab] OR Fat pads[tiab] OR Fat tissue*[tiab] OR Fatty tissue*[tiab] OR Intraabdominal fat[tiab] OR Subcutaneous fat[tiab] OR Visceral fat[tiab)) NOT ((“Animals”[Mesh] NOT (“Animals”[Mesh] AND “Humans”[Mesh])))) NOT ((rat[ti] OR rats[ti] OR mouse[ti] OR mice[ti] OR swine[ti] OR porcine[ti] OR murine[ti] OR sheep[ti] OR lambs[ti] OR pigs[ti] OR piglets[ti] OR rabbit[ti] OR rabbits[ti] OR cat[ti] OR cats[ti] OR dog[ti] OR dogs[ti] OR cattle[ti] OR bovine[ti] OR monkey[ti] OR monkeys[ti] OR trout[ti] OR marmoset*[ti])) Sort by: Most Recent | 6,828 |
| #8 | Search: (rat[ti] OR rats[ti] OR mouse[ti] OR mice[ti] OR swine[ti] OR porcine[ti] OR murine[ti] OR sheep[ti] OR lambs[ti] OR pigs[ti] OR piglets[ti] OR rabbit[ti] OR rabbits[ti] OR cat[ti] OR cats[ti] OR dog[ti] OR dogs[ti] OR cattle[ti] OR bovine[ti] OR monkey[ti] OR monkeys[ti] OR trout[ti] OR marmoset*[ti]) Sort by: Most Recent | 2,007,584 |
| #7 | Search: (((Amount[tiab] OR biops*[tiab] OR composition[tiab] OR concentration*[tiab] OR constituent[tiab] OR content*[tiab] OR distribution*[tiab] OR level[tiab] OR levels[tiab] OR pattern*[tiab] OR percentage*[tiab] OR profile[tiab]) AND (“Fatty Acids”[Mesh:NoExp] OR “Fatty Acids, Unsaturated”[Mesh] OR “Fatty Acids, Essential”[Mesh] OR Fatty acid[tiab] OR fatty acids[tiab] OR FFA[tiab] OR FFAs[tiab] OR EFA[tiab] OR EFAs[tiab] OR PUFA[tiab] OR PUFAs[tiab] OR UFA[tiab] OR UFAs[tiab] OR Alpha linolenic acid[tiab] OR Alpha linolenic acids[tiab] OR Alphalinolenic acid[tiab] OR Alphalinolenic acids[tiab] OR Linoleic acid[tiab] OR Linoleic acids[tiab] OR Linolic acid[tiab] OR Linolic acids[tiab] OR linolate[tiab] OR linoleate[tiab] OR Linolenate[tiab] OR “omega 3”[tiab] OR “omega 6”[tiab] OR omega3[tiab] OR omega6[tiab] OR ((“n 3”[tiab] OR “n 6”[tiab]) AND (acid[tiab] OR acids[tiab])) OR “183ω3”[tiab] OR “18 3ω3”[tiab] OR “183omega3”[tiab] OR “18 3omega3”[tiab] OR ω3[tiab] OR ω6[tiab])) AND (“Adiposity”[Mesh] OR “Adipose Tissue”[Mesh] OR “Adipocytes”[Mesh] OR adipocyte*[tiab] OR Adipose tissue*[tiab] OR Adipose body[tiab] OR Abdominal fat[tiab] OR Body fat[tiab] OR Fat cell[tiab] OR Fat cells[tiab] OR Fat pad[tiab] OR Fat pads[tiab] OR Fat tissue*[tiab] OR Fatty tissue*[tiab] OR Intraabdominal fat[tiab] OR Subcutaneous fat[tiab] OR Visceral fat[tiab)) NOT ((“Animals”[Mesh] NOT (“Animals”[Mesh] AND “Humans”[Mesh]))) Sort by: Most Recent | 7,767 |
| #6 | Search: (“Animals”[Mesh] NOT (“Animals”[Mesh] AND “Humans”[Mesh])) Sort by: Most Recent | 4,705,782 |
| #5 | Search: ((Amount[tiab] OR biops*[tiab] OR composition[tiab] OR concentration*[tiab] OR constituent[tiab] OR content*[tiab] OR distribution*[tiab] OR level[tiab] OR levels[tiab] OR pattern*[tiab] OR percentage*[tiab] OR profile[tiab]) AND (“Fatty Acids”[Mesh:NoExp] OR “Fatty Acids, Unsaturated”[Mesh] OR “Fatty Acids, Essential”[Mesh] OR Fatty acid[tiab] OR fatty acids[tiab] OR FFA[tiab] OR FFAs[tiab] OR EFA[tiab] OR EFAs[tiab] OR PUFA[tiab] OR PUFAs[tiab] OR UFA[tiab] OR UFAs[tiab] OR Alpha linolenic acid[tiab] OR Alpha linolenic acids[tiab] OR Alphalinolenic acid[tiab] OR Alphalinolenic acids[tiab] OR Linoleic acid[tiab] OR Linoleic acids[tiab] OR Linolic acid[tiab] OR Linolic acids[tiab] OR linolate[tiab] OR linoleate[tiab] OR Linolenate[tiab] OR “omega 3”[tiab] OR “omega 6”[tiab] OR omega3[tiab] OR omega6[tiab] OR ((“n 3”[tiab] OR “n 6”[tiab]) AND (acid[tiab] OR acids[tiab])) OR “183ω3”[tiab] OR “18 3ω3”[tiab] OR “183omega3”[tiab] OR “18 3omega3”[tiab] OR ω3[tiab] OR ω6[tiab])) AND (“Adiposity”[Mesh] OR “Adipose Tissue”[Mesh] OR “Adipocytes”[Mesh] OR adipocyte*[tiab] OR Adipose tissue*[tiab] OR Adipose body[tiab] OR Abdominal fat[tiab] OR Body fat[tiab] OR Fat cell[tiab] OR Fat cells[tiab] OR Fat pad[tiab] OR Fat pads[tiab] OR Fat tissue*[tiab] OR Fatty tissue*[tiab] OR Intraabdominal fat[tiab] OR Subcutaneous fat[tiab] OR Visceral fat[tiab) Sort by: Most Recent | 16,638 |
| #4 | Search: ”Adiposity”[Mesh] OR “Adipose Tissue”[Mesh] OR “Adipocytes”[Mesh] OR adipocyte*[tiab] OR Adipose tissue*[tiab] OR Adipose body[tiab] OR Abdominal fat[tiab] OR Body fat[tiab] OR Fat cell[tiab] OR Fat cells[tiab] OR Fat pad[tiab] OR Fat pads[tiab] OR Fat tissue*[tiab] OR Fatty tissue*[tiab] OR Intraabdominal fat[tiab] OR Subcutaneous fat[tiab] OR Visceral fat[tiab] Sort by: Most Recent | 193,456 |
| #3 | Search: ”Fatty Acids”[Mesh:NoExp] OR “Fatty Acids, Unsaturated”[Mesh] OR “Fatty Acids, Essential”[Mesh] OR Fatty acid[tiab] OR fatty acids[tiab] OR FFA[tiab] OR FFAs[tiab] OR EFA[tiab] OR EFAs[tiab] OR PUFA[tiab] OR PUFAs[tiab] OR UFA[tiab] OR UFAs[tiab] OR Alpha linolenic acid[tiab] OR Alpha linolenic acids[tiab] OR Alphalinolenic acid[tiab] OR Alphalinolenic acids[tiab] OR Linoleic acid[tiab] OR Linoleic acids[tiab] OR Linolic acid[tiab] OR Linolic acids[tiab] OR linolate[tiab] OR linoleate[tiab] OR Linolenate[tiab] OR “omega 3”[tiab] OR “omega 6”[tiab] OR omega3[tiab] OR omega6[tiab] OR ((“n 3”[tiab] OR “n 6”[tiab]) AND (acid[tiab] OR acids[tiab])) OR “183ω3”[tiab] OR “18 3ω3”[tiab] OR “183omega3”[tiab] OR “18 3omega3”[tiab] OR ω3[tiab] OR ω6[tiab] Sort by: Most Recent | 434,755 |
| #2 | Search: Amount[tiab] OR biops*[tiab] OR composition[tiab] OR concentration*[tiab] OR constituent[tiab] OR content*[tiab] OR distribution*[tiab] OR level[tiab] OR levels[tiab] OR pattern*[tiab] OR percentage*[tiab] OR profile[tiab] Sort by: Most Recent | 8,394,012 |
| #18 | #8 AND #16 AND [english]/lim | 1,764 |
| #17 | #8 AND #16 | 1,806 |
| #16 | #9 OR #10 OR #11 OR #12 OR #13 OR #14 OR #15 | 5,460,152 |
| #15 | ((data NEAR/1 (synthes* OR extraction* OR abstraction*)):ti,ab) OR handsearch*:ti,ab OR ’hand search’:ti,ab OR ’hand searches’:ti,ab OR ’hand searching’:ti,ab OR ’mantel haenszel’:ti,ab OR peto:ti,ab OR ’der simonian’:ti,ab OR dersimonian:ti,ab OR ’fixed effect’:ti,ab OR ’fixed effects’:ti,ab OR ’latin square’:ti,ab OR ’latin squares’:ti,ab OR ’meta analysis’:ti,ab OR ’meta analyses’:ti,ab OR ’met analysis’:ti,ab OR ’met analyses’:ti,ab OR metaanaly*:ti,ab OR metanaly*:ti,ab OR ’meta regression’:ti,ab OR ’meta regressions’:ti,ab OR metaregression*:ti,ab OR medline:ti,ab OR cochrane:ti,ab OR pubmed:ti,ab OR medlars:ti,ab OR embase:ti,ab OR cinahl:ti,ab OR cochrane:jt OR ’evidence report’:jt OR ((comparative NEAR/3 (efficacy OR effectiveness)):ti,ab) OR ’outcomes research’:ti,ab OR ’relative effectiveness’:ti,ab OR (((indirect OR ’indirect treatment’ OR ’mixed treatment’) NEAR/3 comparison):ti,ab) | 457,229 |
| #14 | ((systematic* NEAR/3 (review* OR overview*)):ti,ab) OR ((methodologic* NEAR/3 (review* OR overview*)):ti,ab) OR ((quantitative NEAR/3 (review* OR overview* OR synthes*)):ti,ab) OR ((research NEAR/3 (integrati* OR overview*)):ti,ab) OR ((integrative NEAR/3 (review* OR overview*)):ti,ab) OR ((collaborative NEAR/3 (review* OR overview*)):ti,ab) OR ((pool* NEAR/3 analy*):ti,ab) | 273,284 |
| #13 | ‘meta analysis’/exp OR ’meta analysis (topic)’/exp OR 'systematic review’/exp OR 'systematic review (topic)’/exp OR ’biomedical technology assessment’/exp | 402,070 |
| #12 | ‘crossover procedure’/exp OR (((crossover OR ’cross over’) NEAR/10 (study OR studies OR design* OR method* OR procedure OR comparison)):ti,ab) | 93,441 |
| #11 | ((singl* OR doubl* OR trebl* OR tripl*) NEAR/10 (mask* OR blind* OR dumm*)):ti,ab | 249,336 |
| #10 | ‘clinical trial (topic)’/exp OR ’double blind procedure’/exp OR 'single blind procedure’/exp OR ’triple blind procedure’/exp | 532,576 |
| #9 | ‘clinical trial’/exp OR ’randomization’/exp OR randomized:ti,ab OR randomised:ti,ab OR placebo:ti,ab OR randomly:ti,ab OR trial:ti,ab OR groups:ti,ab OR (‘group 1’:ti,ab,kw AND ’group 2’:ti,ab,kw) | 4,883,034 |
| #8 | #6 NOT #7 | 5,091 |
| #7 | (rat:ti OR rats:ti OR mouse:ti OR mice:ti OR swine:ti OR porcine:ti OR murine:ti OR sheep:ti OR lambs:ti OR pigs:ti OR piglets:ti OR rabbit:ti OR rabbits:ti OR cat:ti OR cats:ti OR dog:ti OR dogs:ti OR cattle:ti OR bovine:ti OR monkey:ti OR monkeys:ti OR trout:ti OR marmoset*:ti) AND ’animal experiment’/de | 1,064,962 |
| #6 | #4 NOT #5 | 5,185 |
| #5 | ‘animal experiment’/de NOT (‘human experiment’/de OR ’human’/de) | 2,250,451 |
| #4 | #1 AND #2 AND #3 | 8,320 |
| #3 | ‘body weight change’/exp OR (((weight OR fat OR ’adipose tissue’) NEAR/3 (decreas* OR loss OR losing OR reduc*)):ti,ab,kw) OR ((weightNEAR/3 management):ti,ab,kw) OR ((chang* NEAR/3 (‘adipose tissue’ OR ’fat mass’ OR ’fat tissue’ OR weight)):ti,ab,kw) | 419,800 |
| #2 | ‘fatty acid’/de OR ’essential fatty acid’/exp OR ’unsaturated fatty acid’/exp OR ffa:ti,ab,kw OR ffas:ti,ab,kw OR efa:ti,ab,kw OR efas:ti,ab,kw OR pufa:ti,ab,kw OR pufas:ti,ab,kw OR ufa:ti,ab,kw OR ufas:ti,ab,kw OR ((fatty OR ’alpha linolenic’ OR alphalinolenic OR linolic OR linoleicOR ’n 3’ OR ’n 6’) NEAR/3 (acid OR acids)) OR linolate:ti,ab,kw OR linoleate:ti,ab,kw OR linolenate:ti,ab,kw OR ’omega 3’:ti,ab,kw OR ’omega 6’:ti,ab,kw OR omega3:ti,ab,kw OR omega6:ti,ab,kw OR ω3:ti,ab,kw OR ω6:ti,ab,kw OR ’18 3ω3’:ti,ab,kw OR ’183omega3’:ti,ab,kw OR ’18 3omega3’:ti,ab,kw | 423,778 |
| #1 | ‘adipose tissue’/exp OR ’adipose tissue cell’/exp OR adipocyte*:ti,ab,kw OR (((adipose OR fat OR fatty) NEAR/3 (tissue* OR body)):ti,ab,kw) OR ((fat NEAR/3 (abdominal OR cell OR cells OR intraabdominal OR pad OR pads OR subcutaneous OR visceral)):ti,ab,kw) | 285,922 |
PubMed
| Search | Query | Items identified |
|---|---|---|
| #14 | Search: ”english”[Language] AND #13 Sort by: Most Recent | 1,356 |
| #13 | Search: #12 AND #9 Sort by: Most Recent | 1,387 |
| #12 | Search: #10 OR #11 Sort by: Most Recent | 3,747,938 |
| #11 | Search: systematic[sb] OR meta‐analysis[pt] OR meta‐analysis as topic[Mesh] OR meta‐analysis[Mesh] OR meta analy*[tw] OR metanaly*[tw] OR metaanaly*[tw] OR met analy*[tw] OR integrative research[tiab] OR integrative review*[tiab] OR integrative overview*[tiab] OR research integration*[tiab] OR research overview*[tiab] OR collaborative review*[tiab] OR collaborative overview*[tiab] OR systematic review*[tiab] OR comparative efficacy[tiab] OR comparative effectiveness[tiab] OR outcomes research[tiab] OR indirect comparison*[tiab] OR Embase*[tiab] OR Cinahl*[tiab] OR systematic overview*[tiab] OR methodological overview*[tiab] OR methodologic overview*[tiab] OR methodological review*[tiab] OR methodologic review*[tiab] OR quantitative review*[tiab] OR quantitative overview*[tiab] OR quantitative synthes*[tiab] OR pooled analy*[tiab] OR Cochrane[tiab] OR Medline[tiab] OR Pubmed[tiab] OR Medlars[tiab] OR handsearch*[tiab] OR hand search*[tiab] OR meta‐regression*[tiab] OR metaregression*[tiab] OR data synthes*[tiab] OR data extraction[tiab] OR data abstraction*[tiab] OR mantel haenszel[tiab] OR peto[tiab] OR der‐simonian[tiab] OR dersimonian[tiab] OR fixed effect*[tiab] OR “Cochrane Database Syst Rev”[Journal:__jrid21711] Sort by: Most Recent | 421,910 |
| #10 | Search: ”clinical trial”[pt] OR “Random Allocation”[Mesh] OR randomized[tiab] OR randomised[tiab] OR placebo[tiab] OR randomly[tiab] OR trial[tiab] OR groups[tiab] OR (“group 1”[tiab] AND “group 2”[tiab]) OR “Clinical Trials as Topic”[Mesh] OR “Double‐Blind Method”[Mesh] OR “Single‐Blind Method”[Mesh] OR ((singl*[tiab] OR doubl*[tiab] OR trebl*[tiab] OR tripl*[tiab]) AND (mask*[tiab] OR blind*[tiab] OR dumm*[tiab])) OR “Cross‐Over Studies”[Mesh] OR ((crossover[tiab] OR “cross over”[tiab]) AND (study[tiab] OR studies[tiab] OR design*[tiab] OR method*[tiab] OR procedure[tiab] OR comparison[tiab])) Sort by: Most Recent | 3,484,152 |
| #9 | Search: #7 NOT #8 Sort by: Most Recent | 4,775 |
| #8 | Search: (rat[ti] OR rats[ti] OR mouse[ti] OR mice[ti] OR swine[ti] OR porcine[ti] OR murine[ti] OR sheep[ti] OR lambs[ti] OR pigs[ti] OR piglets[ti] OR rabbit[ti] OR rabbits[ti] OR cat[ti] OR cats[ti] OR dog[ti] OR dogs[ti] OR cattle[ti] OR bovine[ti] OR monkey[ti] OR monkeys[ti] OR trout[ti] OR marmoset*[ti]) Sort by: Most Recent | 2,010,568 |
| #7 | Search: #5 NOT #6 Sort by: Most Recent | 5,629 |
| #6 | Search: (“Animals”[Mesh] NOT (“Animals”[Mesh] AND “Humans”[Mesh])) Sort by: Most Recent | 4,711,847 |
| #5 | Search: #1 AND #3 AND #4 Sort by: Most Recent | 12,817 |
| #4 | Search: ”Fatty Acids”[Mesh:NoExp] OR “Fatty Acids, Unsaturated”[Mesh] OR “Fatty Acids, Essential”[Mesh] OR Fatty acid[tiab] OR fatty acids[tiab] OR FFA[tiab] OR FFAs[tiab] OR EFA[tiab] OR EFAs[tiab] OR PUFA[tiab] OR PUFAs[tiab] OR UFA[tiab] OR UFAs[tiab] OR Alpha linolenic acid[tiab] OR Alpha linolenic acids[tiab] OR Alphalinolenic acid[tiab] OR Alphalinolenic acids[tiab] OR Linoleic acid[tiab] OR Linoleic acids[tiab] OR Linolic acid[tiab] OR Linolic acids[tiab] OR linolate[tiab] OR linoleate[tiab] OR Linolenate[tiab] OR “omega 3”[tiab] OR “omega 6”[tiab] OR omega3[tiab] OR omega6[tiab] OR ((“n 3”[tiab] OR “n 6”[tiab]) AND (acid[tiab] OR acids[tiab])) OR “183ω3”[tiab] OR “18 3ω3”[tiab] OR “183omega3”[tiab] OR “18 3omega3”[tiab] OR ω3[tiab] OR ω6[tiab] Sort by: Most Recent | 435,798 |
| #3 | Search: ”Body Weight Changes”[Mesh] OR ((“adipose tissue”[tiab] OR fat[tiab] OR weight[tiab]) AND (decreas*[tiab] OR chang*[tiab] OR loss[tiab] OR losing[tiab] OR reduc*[tiab])) OR “body weight”[tiab] OR “body weights”[tiab] Sort by: Most Recent | 645,747 |
| #1 | Search: ”Adiposity”[Mesh] OR “Adipose Tissue”[Mesh] OR “Adipocytes”[Mesh] OR adipocyte*[tiab] OR Adipose tissue*[tiab] OR Adipose body[tiab] OR Abdominal fat[tiab] OR Body fat[tiab] OR Fat cell[tiab] OR Fat cells[tiab] OR Fat pad[tiab] OR Fat pads[tiab] OR Fat tissue*[tiab] OR Fatty tissue*[tiab] OR Intraabdominal fat[tiab] OR Subcutaneous fat[tiab] OR Visceral fat[tiab] OR Intraabdominal fats[tiab] OR Subcutaneous fats[tiab] OR Visceral fats[tiab] Sort by: Most Recent | 194,140 |
E.2. Range of weight loss when consuming total diet replacements for weight control (Q2)
Date of search: 02 June 2020
Embase
| Search | Query | Items identified |
|---|---|---|
| #10 | #9 AND [english]/lim | 3,547 |
| #9 | #7 NOT #8 | 3,685 |
| #8 | (rat:ti OR rats:ti OR mouse:ti OR mice:ti OR swine:ti OR porcine:ti OR murine:ti OR sheep:ti OR lambs:ti OR pigs:ti OR piglets:ti OR rabbit:ti OR rabbits:ti OR cat:ti OR cats:ti OR dog:ti OR dogs:ti OR cattle:ti OR bovine:ti OR monkey:ti OR monkeys:ti OR trout:ti OR marmoset*:ti) AND ’animal experiment’/de | 1,062,853 |
| #7 | #5 NOT #6 | 3,690 |
| #6 | ‘animal experiment’/de NOT (‘human experiment’/de OR ’human’/de) | 2,247,064 |
| #5 | #3 AND #4 | 3,943 |
| #4 | ‘clinical trial’/exp OR ’randomization’/exp OR randomized:ti,ab OR randomised:ti,ab OR placebo:ti,ab OR randomly:ti,ab OR trial:ti,ab OR groups:ti,ab OR ’clinical trial (topic)’/exp OR ’double blind procedure’/exp OR 'single blind procedure’/exp OR ’triple blind procedure’/exp OR (((singl* OR doubl* OR trebl* OR tripl*) NEAR/10 (mask* OR blind* OR dumm*)):ti,ab) OR ’crossover procedure’/exp OR (((crossoverOR ’cross over’) NEAR/10 (study OR studies OR design* OR method* OR procedure OR comparison)):ti,ab) OR ’meta analysis’/exp OR ’meta analysis (topic)’/exp OR 'systematic review’/exp OR 'systematic review (topic)’/exp OR ’biomedical technology assessment’/exp OR ((systematic* NEAR/3 (review* OR overview*)):ti,ab) OR ((methodologic* NEAR/3 (review* OR overview*)):ti,ab) OR ((quantitative NEAR/3 (review* OR overview* OR synthes*)):ti,ab) OR ((research NEAR/3 (integrati* OR overview*)):ti,ab) OR ((integrative NEAR/3 (review* OR overview*)):ti,ab) OR ((collaborative NEAR/3 (review* OR overview*)):ti,ab) OR ((pool* NEAR/3 analy*):ti,ab) OR ((data NEAR/1 (synthes* OR extraction* OR abstraction*)):ti,ab) OR handsearch*:ti,ab OR ’hand search’:ti,ab OR ’hand searches’:ti,ab OR ’hand searching’:ti,ab OR ’mantel haenszel’:ti,ab OR peto:ti,ab OR ’der simonian’:ti,ab OR dersimonian:ti,ab OR ’fixed effect’:ti,ab OR ’fixed effects’:ti,ab OR ’latin square’:ti,ab OR ’latin squares’:ti,ab OR ’meta analysis’:ti,ab OR ’meta analyses’:ti,ab OR ’met analysis’:ti,ab OR ’met analyses’:ti,ab OR metaanaly*:ti,ab OR metanaly*:ti,ab OR ’meta regression’:ti,ab OR ’meta regressions’:ti,ab OR metaregression*:ti,ab OR medline:ti,ab OR cochrane:ti,ab OR pubmed:ti,ab OR medlars:ti,ab OR embase:ti,ab OR cinahl:ti,ab OR cochrane:jt OR ’evidence report’:it OR ((comparativeNEAR/3 (efficacy OR effectiveness)):ti,ab) OR ’outcomes research’:ti,ab OR ’relative effectiveness’:ti,ab OR (((indirect OR ’indirect treatment’ OR ’mixed treatment’) NEAR/3 comparison):ti,ab) | 5,425,604 |
| #3 | #1 AND #2 | 7,629 |
| #2 | ‘body weight loss’/exp OR (((weight OR fat OR ’adipose tissue’) NEAR/3 (decreas* OR loss OR losing OR reduc*)):ti,ab,kw) OR ((weightNEAR/3 management):ti,ab,kw) OR ((chang* NEAR/3 (‘adipose tissue’ OR ’fat mass’ OR ’fat tissue’ OR weight)):ti,ab,kw) | 332,351 |
| #1 | ‘low calorie diet’/exp/mj OR ’very low calorie diet’/exp/mj OR ’elimination diet’/exp/mj OR ’liquid diet’/exp/mj OR ((low NEAR/3 (calori* OR energy OR elimination) NEAR/5 (diet OR diets)):ti,ab,kw) OR vlcd:ti,ab,kw OR vled:ti,ab,kw OR lcd:ti,ab,kw OR (((ketogenic OR replacementOR ’meal substitute’ OR liquid) NEAR/5 (diet OR diets)):ti,ab,kw) OR ’reducing diet’:ti,ab,kw OR ’reducing diets’:ti,ab,kw OR (((calori* OR energ*) NEAR/3 (reduc* OR restrict*) NEAR/5 (diet OR diets)):ti,ab,kw) | 25,963 |
PubMed
| Search | Query | Items identified |
|---|---|---|
| #14 | Search: #12 AND #13 Sort by: Most Recent | 2,806 |
| #13 | Search: ENGLISH[Language] Sort by: Most Recent | 26,345,924 |
| #12 | Search: #11 Sort by: Most Recent | 2,928 |
| #11 | Search: #10 and #7 Sort by: Most Recent | 2,928 |
| #10 | Search: #8 OR #9 Sort by: Most Recent | 3,717,566 |
| #9 | Search: Systematic[sb] OR meta‐analysis[pt] OR meta‐analysis as topic[Mesh] OR meta‐analysis[Mesh] OR meta analy*[tw] OR metanaly*[tw] OR metaanaly*[tw] OR met analy*[tw] OR integrative research[tiab] OR integrative review*[tiab] OR integrative overview*[tiab] OR research integration*[tiab] OR research overview*[tiab] OR collaborative review*[tiab] OR collaborative overview*[tiab] OR systematic review*[tiab] OR comparative efficacy[tiab] OR comparative effectiveness[tiab] OR outcomes research[tiab] OR indirect comparison*[tiab] OR Embase*[tiab] OR Cinahl*[tiab] OR systematic overview*[tiab] OR methodological overview*[tiab] OR methodologic overview*[tiab] OR methodological review*[tiab] OR methodologic review*[tiab] OR quantitative review*[tiab] OR quantitative overview*[tiab] OR quantitative synthes*[tiab] OR pooled analy*[tiab] OR Cochrane[tiab] OR Medline[tiab] OR Pubmed[tiab] OR Medlars[tiab] OR handsearch*[tiab] OR hand search*[tiab] OR meta‐regression*[tiab] OR metaregression*[tiab] OR data synthes*[tiab] OR data extraction[tiab] OR data abstraction*[tiab] OR mantel haenszel[tiab] OR peto[tiab] OR der‐simonian[tiab] OR dersimonian[tiab] OR fixed effect*[tiab] OR “Cochrane Database Syst Rev”[Journal:__jrid21711] Sort by: Most Recent | 417,908 |
| #8 | Search: ”clinical trial”[pt] OR “Random Allocation”[Mesh] OR randomized[tiab] OR randomised[tiab] OR placebo[tiab] OR randomly[tiab] OR trial[tiab] OR groups[tiab] OR “Clinical Trials as Topic”[Mesh] OR “Double‐Blind Method”[Mesh] OR “Single‐Blind Method”[Mesh] OR ((singl*[tiab] OR doubl*[tiab] OR trebl*[tiab] OR tripl*[tiab]) AND (mask*[tiab] OR blind*[tiab] OR dumm*[tiab])) OR “Cross‐Over Studies”[Mesh] OR ((crossover[tiab] OR “cross over”[tiab]) AND (study[tiab] OR studies[tiab] OR design*[tiab] OR method*[tiab] OR procedure[tiab] OR comparison[tiab])) Sort by: Most Recent | 3,456,468 |
| #7 | Search: #5 NOT #6 Sort by: Most Recent | 5,493 |
| #6 | Search: (rat[ti] OR rats[ti] OR mouse[ti] OR mice[ti] OR swine[ti] OR porcine[ti] OR murine[ti] OR sheep[ti] OR lambs[ti] OR pigs[ti] OR piglets[ti] OR rabbit[ti] OR rabbits[ti] OR cat[ti] OR cats[ti] OR dog[ti] OR dogs[ti] OR cattle[ti] OR bovine[ti] OR monkey[ti] OR monkeys[ti] OR trout[ti] OR marmoset*[ti]) Sort by: Most Recent | 2,006,904 |
| #5 | Search: #3 NOT #4 Sort by: Most Recent | 5,732 |
| #4 | Search: (“Animals”[Mesh] NOT (“Animals”[Mesh] AND “Humans”[Mesh])) Sort by: Most Recent | 4,704,526 |
| #3 | Search: (“Caloric Restriction”[Mesh] OR “Diet, Ketogenic”[Mesh] OR ((“caloric reduction”[tiab] OR “calorie reduction”[tiab] OR “calories reduction”[tiab] OR “caloric restriction”[tiab] OR “calorie restriction”[tiab] OR “calories restriction”[tiab] OR “energy reduction”[tiab] OR “energy restriction”[tiab] OR “low caloric”[tiab] OR “low calorie”[tiab] OR “low calories”[tiab] OR “low energy”[tiab] OR “meal replacement”[tiab] OR “meal substitute”[tiab] OR “total replacement”[tiab]) AND (diet[tiab] OR diets[tiab])) OR “diet replacement”[tiab] OR “ketogenic diet”[tiab] OR “ketogenic diets”[tiab] OR “liquid diet”[tiab] OR “liquid diets”[tiab] OR “reducing diet”[tiab] OR “reducing diets”[tiab] OR (“total diet”[tiab] AND replacement[tiab]) OR VLED[tiab] OR VLCD[tiab] OR LCD[tiab]) AND (“Body Weight Changes”[Mesh:NoExp] OR “Weight Loss”[Mesh] OR ((“adipose tissue”[tiab] OR fat[tiab] OR weight[tiab]) AND (decreas*[tiab] OR chang*[tiab] OR loss[tiab] OR losing[tiab] OR reduc*[tiab]))) Sort by: Most Recent | 7,949 |
| #2 | Search: ”Body Weight Changes”[Mesh:NoExp] OR “Weight Loss”[Mesh] OR ((“adipose tissue”[tiab] OR fat[tiab] OR weight[tiab]) AND (decreas*[tiab] OR chang*[tiab] OR loss[tiab] OR losing[tiab] OR reduc*[tiab])) Sort by: Most Recent | 553,343 |
| #1 | Search: ”Caloric Restriction”[Mesh] OR “Diet, Ketogenic”[Mesh] OR ((“caloric reduction”[tiab] OR “calorie reduction”[tiab] OR “calories reduction”[tiab] OR “caloric restriction”[tiab] OR “calorie restriction”[tiab] OR “calories restriction”[tiab] OR “energy reduction”[tiab] OR “energy restriction”[tiab] OR “low caloric”[tiab] OR “low calorie”[tiab] OR “low calories”[tiab] OR “low energy”[tiab] OR “meal replacement”[tiab] OR “meal substitute”[tiab] OR “total replacement”[tiab]) AND (diet[tiab] OR diets[tiab])) OR “diet replacement”[tiab] OR “ketogenic diet”[tiab] OR “ketogenic diets”[tiab] OR “liquid diet”[tiab] OR “liquid diets”[tiab] OR “reducing diet”[tiab] OR “reducing diets”[tiab] OR (“total diet”[tiab] AND replacement[tiab]) OR VLED[tiab] OR VLCD[tiab] OR LCD[tiab] Sort by: Most Recent | 20,854 |
E.3. Supplemental magnesium intake and risk of developing diarrhoea (Q3)
Date of search: 22 June 2020
Embase
| Search | Query | Items identified |
|---|---|---|
| #24 | #14 AND #22 AND [english]/lim | 5,340 |
| #23 | #14 AND #22 | 5,792 |
| #22 | #15 OR #16 OR #17 OR #18 OR #19 OR #20 OR #21 | 5,441,679 |
| #21 | ((data NEAR/1 (synthes* OR extraction* OR abstraction*)):ti,ab) OR handsearch*:ti,ab OR ’hand search’:ti,ab OR ’hand searches’:ti,ab OR ’hand searching’:ti,ab OR ’mantel haenszel’:ti,ab OR peto:ti,ab OR ’der simonian’:ti,ab OR dersimonian:ti,ab OR ’fixed effect’:ti,ab OR ’fixed effects’:ti,ab OR ’latin square’:ti,ab OR ’latin squares’:ti,ab OR ’meta analysis’:ti,ab OR ’meta analyses’:ti,ab OR ’met analysis’:ti,ab OR ’met analyses’:ti,ab OR metaanaly*:ti,ab OR metanaly*:ti,ab OR ’meta regression’:ti,ab OR ’meta regressions’:ti,ab OR metaregression*:ti,ab OR medline:ti,ab OR cochrane:ti,ab OR pubmed:ti,ab OR medlars:ti,ab OR embase:ti,ab OR cinahl:ti,ab OR cochrane:jt OR ’evidence report’:jt OR ((comparative NEAR/3 (efficacy OR effectiveness)):ti,ab) OR ’outcomes research’:ti,ab OR ’relative effectiveness’:ti,ab OR (((indirect OR ’indirect treatment’ OR ’mixed treatment’) NEAR/3 comparison):ti,ab) | 457,245 |
| #20 | ((systematic* NEAR/3 (review* OR overview*)):ti,ab) OR ((methodologic* NEAR/3 (review* OR overview*)):ti,ab) OR ((quantitative NEAR/3 (review* OR overview* OR synthes*)):ti,ab) OR ((research NEAR/3 (integrati* OR overview*)):ti,ab) OR ((integrative NEAR/3 (review* OR overview*)):ti,ab) OR ((collaborative NEAR/3 (review* OR overview*)):ti,ab) OR ((pool* NEAR/3 analy*):ti,ab) | 273,287 |
| #19 | ‘meta analysis’/exp OR ’meta analysis (topic)’/exp OR 'systematic review’/exp OR 'systematic review (topic)’/exp OR ’biomedical technology assessment’/exp | 402,087 |
| #18 | ‘crossover procedure’/exp OR (((crossover OR ’cross over’) NEAR/10 (study OR studies OR design* OR method* OR procedure OR comparison)):ti,ab) | 93,442 |
| #17 | ((singl* OR doubl* OR trebl* OR tripl*) NEAR/10 (mask* OR blind* OR dumm*)):ti,ab | 249,335 |
| #16 | ‘clinical trial (topic)’/exp OR ’double blind procedure’/exp OR 'single blind procedure’/exp OR ’triple blind procedure’/exp | 532,591 |
| #15 | ‘clinical trial’/exp OR ’randomization’/exp OR randomized:ti,ab OR randomised:ti,ab OR placebo:ti,ab OR randomly:ti,ab OR trial:ti,ab OR groups:ti,ab OR (group1:ti,ab AND group 2:ti,ab) | 4,864,364 |
| #14 | #12 NOT #13 | 16,546 |
| #13 | (rat:ti OR rats:ti OR mouse:ti OR mice:ti OR swine:ti OR porcine:ti OR murine:ti OR sheep:ti OR lambs:ti OR pigs:ti OR piglets:ti OR rabbit:ti OR rabbits:ti OR cat:ti OR cats:ti OR dog:ti OR dogs:ti OR cattle:ti OR bovine:ti OR monkey:ti OR monkeys:ti OR trout:ti OR marmoset*:ti) AND ’animal experiment’/de | 1,064,998 |
| #12 | #10 NOT #11 | 16,569 |
| #11 | ‘animal experiment’/de NOT (‘human experiment’/de OR ’human’/de) | 2,250,526 |
| #10 | #3 OR #6 OR #8 OR #9 | 18,100 |
| #9 | (‘magnesium’/exp OR ’magnesium salt’/exp OR magnesium:ti,ab,kw) AND (‘dietary supplement’/exp OR ’fortified food’/exp OR ’diet’/de) OR ((magnesium NEAR/3 (intak* OR supplement* OR therap* OR diet*;ti,ab,kw)):ti,ab,kw) OR ’mg supplement*’:ti,ab,kw OR ’mg fortified’:ti,ab,kw OR ’magnesium intake’/exp OR ’magnesium’/mj/dd_dt OR ’magnesium salt’/mj/dd_dt | 9,906 |
| #8 | #6 OR #7 | 6,767 |
| #7 | ‘magnesium’/exp/dd_ae,dd_to OR ’magnesium salt’/exp/dd_ae,dd_to | 1,092 |
| #6 | #4 AND #5 | 5,886 |
| #5 | ‘adverse event’/de OR ’adverse drug reaction’/exp OR ’intoxication’/de OR ’drug intoxication’/exp OR ’drug overdose’/exp OR ’toxicity’/exp OR ’contraindication’/exp OR ’risk’/de OR ’risk factor’/exp OR ’risk assessment’/exp OR 'safety’/de OR ’patient safety’/exp OR ’food safety’/exp OR ’drug safety’/exp OR adverse:ti,ab,kw OR (((undesirable OR harm* OR serious OR negative OR side OR unwanted OR untoward) NEAR/5 (effect* OR reaction* OR event* OR interaction* OR outcome* OR response* OR sequala* OR sequela*)):ti,ab,kw) OR intoxic*:ti,ab,kw OR toxic*:ti,ab,kw OR overdose*:ti,ab,kw OR ((risk* NEAR/5 (assessment* OR factor*)):ti,ab,kw) OR contraindication*:ti,ab,kw OR ’contra indication’:ti,ab,kw OR ’contra indications’:ti,ab,kw OR safe:ti,ab,kw OR safety:ti,ab,kw | 5,724,197 |
| #4 | ‘magnesium’/exp/mj OR ’magnesium salt’/exp/mj OR ’magnesium intake’/exp/mj OR magnesium:ti | 44,385 |
| #3 | #1 AND #2 | 4,041 |
| #2 | ‘tolerability’/exp OR ’diarrhea’/exp OR diarrhe*:ti,ab,kw OR diarrhoe*:ti,ab,kw OR dysenter*:ti,ab,kw OR ’feces’/exp OR feces:ti,ab,kw OR faec*:ti,ab,kw OR fecal:ti,ab,kw OR laxative:ti,ab,kw OR stool:ti,ab,kw OR stools:ti,ab,kw OR tolerab*:ti,ab,kw OR ((osmotic NEAR/3 (effect OR effects)):ti,ab,kw) | 636,059 |
| #1 | ‘magnesium’/exp OR ’magnesium intake’/exp OR ’magnesium salt’/exp OR magnesium:ti,ab,kw | 127,141 |
PubMed
| Search | Query | Items identified |
|---|---|---|
| #19 | Search: ”english”[Language] AND #18 Sort by: Most Recent | 4,751 |
| #18 | Search: #17 AND #14 Sort by: Most Recent | 5,231 |
| #17 | Search: #16 OR #15 Sort by: Most Recent | 3,731,983 |
| #16 | Search: systematic[sb] OR meta‐analysis[pt] OR meta‐analysis as topic[Mesh] OR meta‐analysis[Mesh] OR meta analy*[tw] OR metanaly*[tw] OR metaanaly*[tw] OR met analy*[tw] OR integrative research[tiab] OR integrative review*[tiab] OR integrative overview*[tiab] OR research integration*[tiab] OR research overview*[tiab] OR collaborative review*[tiab] OR collaborative overview*[tiab] OR systematic review*[tiab] OR comparative efficacy[tiab] OR comparative effectiveness[tiab] OR outcomes research[tiab] OR indirect comparison*[tiab] OR Embase*[tiab] OR Cinahl*[tiab] OR systematic overview*[tiab] OR methodological overview*[tiab] OR methodologic overview*[tiab] OR methodological review*[tiab] OR methodologic review*[tiab] OR quantitative review*[tiab] OR quantitative overview*[tiab] OR quantitative synthes*[tiab] OR pooled analy*[tiab] OR Cochrane[tiab] OR Medline[tiab] OR Pubmed[tiab] OR Medlars[tiab] OR handsearch*[tiab] OR hand search*[tiab] OR meta‐regression*[tiab] OR metaregression*[tiab] OR data synthes*[tiab] OR data extraction[tiab] OR data abstraction*[tiab] OR mantel haenszel[tiab] OR peto[tiab] OR der‐simonian[tiab] OR dersimonian[tiab] OR fixed effect*[tiab] OR “Cochrane Database Syst Rev”[Journal:__jrid21711] Sort by: Most Recent | 421,144 |
| #15 | Search: ”clinical trial”[pt] OR “Random Allocation”[Mesh] OR randomized[tiab] OR randomised[tiab] OR placebo[tiab] OR randomly[tiab] OR trial[tiab] OR groups[tiab] OR (group 1[tiab] AND group 2[tiab]) OR “Clinical Trials as Topic”[Mesh] OR “Double‐Blind Method”[Mesh] OR “Single‐Blind Method”[Mesh] OR ((singl*[tiab] OR doubl*[tiab] OR trebl*[tiab] OR tripl*[tiab]) AND (mask*[tiab] OR blind*[tiab] OR dumm*[tiab])) OR “Cross‐Over Studies”[Mesh] OR ((crossover[tiab] OR “cross over”[tiab]) AND (study[tiab] OR studies[tiab] OR design*[tiab] OR method*[tiab] OR procedure[tiab] OR comparison[tiab])) Sort by: Most Recent | 3,468,659 |
| #14 | Search: #12 NOT #13 Sort by: Most Recent | 16,416 |
| #13 | Search: (rat[ti] OR rats[ti] OR mouse[ti] OR mice[ti] OR swine[ti] OR porcine[ti] OR murine[ti] OR sheep[ti] OR lambs[ti] OR pigs[ti] OR piglets[ti] OR rabbit[ti] OR rabbits[ti] OR cat[ti] OR cats[ti] OR dog[ti] OR dogs[ti] OR cattle[ti] OR bovine[ti] OR monkey[ti] OR monkeys[ti] OR trout[ti] OR marmoset*[ti]) Sort by: Most Recent | 2,009,802 |
| #12 | Search: #10 NOT #11 Sort by: Most Recent | 16,693 |
| #11 | Search: (“Animals”[Mesh] NOT (“Animals”[Mesh] AND “Humans”[Mesh])) Sort by: Most Recent | 4,709,914 |
| #10 | Search: #3 OR #8 OR #9 Sort by: Most Recent | 21,965 |
| #9 | Search: ((“Magnesium”[Mesh] OR Magnesium[tiab]) AND (“Dietary Supplements”[Mesh:noexp] OR “Food, Fortified”[Mesh] OR “Diet”[Mesh:NoExp] OR diet*[tiab] OR intak*[tiab] OR supplement*[tiab] OR therap*[tiab])) OR “Mg supplement*”[tiab] OR “Mg fortified”[tiab] OR “Magnesium/therapeutic use”[Mesh] Sort by: Most Recent | 19,040 |
| #8 | Search: ((“Magnesium”[Majr] OR magnesium[ti]) AND (“Drug‐Related Side Effects and Adverse Reactions”[Mesh] OR “Poisoning”[Mesh] OR “Drug Hypersensitivity”[Mesh] OR “Drug Overdose”[Mesh] OR “Contraindications”[Mesh] OR “Risk”[Mesh] OR “Risk Factors”[Mesh] OR “Risk Assessment”[Mesh:NoExp] OR “Safety”[Mesh:NoExp] OR “Patient Safety”[Mesh] OR “Food Safety”[Mesh] OR adverse[tiab] OR contraindication*[tiab] OR “contra indication*”[tiab] OR safe[tiab] OR safety[tiab] OR risk assessment*[tiab] OR risk factor*[tiab] OR ((undesirable[tiab] OR harm*[tiab] OR serious[tiab] OR negative[tiab] OR side[tiab] OR unwanted[tiab] OR untoward[tiab]) AND (effect*[tiab] OR reaction*[tiab] OR event*[tiab] OR interaction*[tiab] OR outcome*[tiab] OR response*[tiab] OR sequala*[tiab] OR sequela*[tiab])))) OR (“magnesium/adverse effects”[MeSH Terms] OR “magnesium/poisoning”[MeSH Terms] OR “magnesium/toxicity”[MeSH Terms]) Sort by: Most Recent | 3,954 |
| #7 | Search: ”magnesium/adverse effects”[MeSH Terms] OR “magnesium/poisoning”[MeSH Terms] OR “magnesium/toxicity”[MeSH Terms] Sort by: Most Recent | 580 |
| #6 | Search: (“Magnesium”[Majr] OR magnesium[ti]) AND (“Drug‐Related Side Effects and Adverse Reactions”[Mesh] OR “Poisoning”[Mesh] OR “Drug Hypersensitivity”[Mesh] OR “Drug Overdose”[Mesh] OR “Contraindications”[Mesh] OR “Risk”[Mesh] OR “Risk Factors”[Mesh] OR “Risk Assessment”[Mesh:NoExp] OR “Safety”[Mesh:NoExp] OR “Patient Safety”[Mesh] OR “Food Safety”[Mesh] OR adverse[tiab] OR contraindication*[tiab] OR “contra indication*”[tiab] OR safe[tiab] OR safety[tiab] OR risk assessment*[tiab] OR risk factor*[tiab] OR ((undesirable[tiab] OR harm*[tiab] OR serious[tiab] OR negative[tiab] OR side[tiab] OR unwanted[tiab] OR untoward[tiab]) AND (effect*[tiab] OR reaction*[tiab] OR event*[tiab] OR interaction*[tiab] OR outcome*[tiab] OR response*[tiab] OR sequala*[tiab] OR sequela*[tiab]))) Sort by: Most Recent | 3,497 |
| #5 | Search: ”Drug‐Related Side Effects and Adverse Reactions”[Mesh] OR “Poisoning”[Mesh] OR “Drug Hypersensitivity”[Mesh] OR “Drug Overdose”[Mesh] OR “Contraindications”[Mesh] OR “Risk”[Mesh] OR “Risk Factors”[Mesh] OR “Risk Assessment”[Mesh:NoExp] OR “Safety”[Mesh:NoExp] OR “Patient Safety”[Mesh] OR “Food Safety”[Mesh] OR adverse[tiab] OR contraindication*[tiab] OR “contra indication*”[tiab] OR safe[tiab] OR safety[tiab] OR risk assessment*[tiab] OR risk factor*[tiab] OR ((undesirable[tiab] OR harm*[tiab] OR serious[tiab] OR negative[tiab] OR side[tiab] OR unwanted[tiab] OR untoward[tiab]) AND (effect*[tiab] OR reaction*[tiab] OR event*[tiab] OR interaction*[tiab] OR outcome*[tiab] OR response*[tiab] OR sequala*[tiab] OR sequela*[tiab])) Sort by: Most Recent | 3,758,191 |
| #4 | Search: ”Magnesium”[Majr] OR magnesium[ti] Sort by: Most Recent | 34,053 |
| #3 | Search: (“Magnesium”[Mesh] OR magnesium[tiab]) AND (“Diarrhea”[Mesh] OR diarrhe*[tiab] OR diarrho*[tiab] OR dysenter*[tiab]OR “Feces”[Mesh] OR feces[tiab] OR fecal[tiab] OR faec*[tiab] OR laxative[tiab] OR stool*[tiab] OR osmotic effect*[tiab] OR tolerab*[tiab]) Sort by: Most Recent | 1,978 |
| #2 | Search: ”Diarrhea”[Mesh] OR diarrhe*[tiab] OR diarrho*[tiab] OR dysenter*[tiab]OR “Feces”[Mesh] OR feces[tiab] OR fecal[tiab] OR faec*[tiab] OR laxative[tiab] OR stool*[tiab] OR osmotic effect*[tiab] OR tolerab*[tiab] Sort by: Most Recent | 370,900 |
| #1 | Search: ”Magnesium”[Mesh] OR magnesium[tiab] Sort by: Most Recent | 101,094 |
E.4. Fat content of energy‐restricted diets and risk of gallstone formation (Q4)
Date for search: 9 December 2020
Embase
| Search | Query | Items identified |
|---|---|---|
| #9 | #8 AND [2013‐2021]/py | 67 |
| #8 | #7 AND [english]/lim | 160 |
| #7 | #5 NOT #6 | 179 |
| #6 | (rat:ti OR rats:ti OR mouse:ti OR mice:ti OR swine:ti OR porcine:ti OR murine:ti OR sheep:ti OR lambs:ti OR pigs:ti OR piglets:ti OR rabbit:ti OR rabbits:ti OR cat:ti OR cats:ti OR dog:ti OR dogs:ti OR cattle:ti OR bovine:ti OR monkey:ti OR monkeys:ti OR trout:ti OR marmoset*:ti) AND ’animal experiment’/de | 1,089,880 |
| #5 | #3 NOT #4 | 178 |
| #4 | ‘animal experiment’/de NOT (‘human experiment’/de OR ’human’/de) | 2,294,858 |
| #3 | #1 AND #2 | 183 |
| #2 | ‘biliary sludge’/exp OR ‘cholelithiasis’/exp OR ‘gallbladder’/exp OR ‘gallbladder function’/exp OR (((bile OR biliary) NEAR/3 (calculus OR calculi OR sludge*)):ti,ab,kw) OR cholelith*:ti,ab,kw OR cholecystolithias*:ti,ab,kw OR gallbladder*:ti,ab,kw OR ‘gall bladder*’:ti,ab,kw OR gallsludge*:ti,ab,kw OR ‘gall sludge*’:ti,ab,kw OR gallstone*:ti,ab,kw OR ‘gall stone*’:ti,ab,kw OR ‘vesica biliaris’:ti,ab,kw OR ‘vesica fellea’:ti,ab,kw | 121,762 |
| #1 | ‘low calorie diet’/exp/mj OR ‘very low calorie diet’/exp/mj OR ‘elimination diet’/exp/mj OR ‘liquid diet’/exp/mj OR ((low NEAR/3 (calori* OR energy OR elimination) NEAR/5 (diet OR diets)):ti,ab,kw) OR vlcd:ti,ab,kw OR vled:ti,ab,kw OR lcd:ti,ab,kw OR (((ketogenic OR replacement OR ‘meal substitute’ OR liquid) NEAR/5 (diet OR diets)):ti,ab,kw) OR ‘reducing diet’:ti,ab,kw OR ‘reducing diets’:ti,ab,kw OR (((calori* OR energ*) NEAR/3 (reduc* OR restrict*) NEAR/5 (diet OR diets)):ti,ab,kw) | 26,839 |
Pubmed
| Search | Query | Items identified |
|---|---|---|
| #9 | (#8) AND ((“2014”[Date ‐ Publication]: “3000”[Date ‐ Publication])) | 14 |
| #8 | #7 AND ENGLISH[Language] | 56 |
| #7 | #5 NOT #6 | 69 |
| #6 | (rat[ti] OR rats[ti] OR mouse[ti] OR mice[ti] OR swine[ti] OR porcine[ti] OR murine[ti] OR sheep[ti] OR lambs[ti] OR pigs[ti] OR piglets[ti] OR rabbit[ti] OR rabbits[ti] OR cat[ti] OR cats[ti] OR dog[ti] OR dogs[ti] OR cattle[ti] OR bovine[ti] OR monkey[ti] OR monkeys[ti] OR trout[ti] OR marmoset*[ti]) | 2,307,004 |
| #5 | #3 NOT #4 | 69 |
| #4 | (“Animals”[Mesh] NOT (“Animals”[Mesh] AND “Humans”[Mesh])) | 4,762,683 |
| #3 | #1 AND #2 | 80 |
| #2 | “Cholecystolithiasis”[Mesh] OR “Gallbladder”[Mesh] OR “Gallbladder Emptying”[Mesh] OR “Gallstones”[Mesh] OR “bile duct calcul*”[tiab] OR “bile duct sludge*”[tiab] OR “bile calcul*”[tiab] OR “bile sludge*”[tiab] OR “biliary calcul*”[tiab] OR “biliary sludge”[tiab] OR “biliary system calcul*”[tiab] OR “biliary system sludge*”[tiab] OR cholelith*[tiab] OR cholecystolithias*[tiab] OR gallbladder*[tiab] OR “gall bladder*”[tiab] OR gallsludge[tiab] OR “gall sludge*”[tiab] OR gallstone*[tiab] OR “gall stone*”[tiab] OR “vesica biliaris”[tiab] OR “vesica fellea”[tiab] | 68,834 |
| #1 | “Caloric Restriction”[Mesh] OR “Diet, Ketogenic”[Mesh] OR ((“caloric reduction”[tiab] OR “calorie reduction”[tiab] OR “calories reduction”[tiab] OR “caloric restriction”[tiab] OR “calorie restriction”[tiab] OR “calories restriction”[tiab] OR “energy reduction”[tiab] OR “energy restriction”[tiab] OR “low caloric”[tiab] OR “low calorie”[tiab] OR “low calories”[tiab] OR “low energy”[tiab] OR “meal replacement”[tiab] OR “meal substitute”[tiab] OR “total replacement”[tiab]) AND (diet[tiab] OR diets[tiab])) OR “diet replacement”[tiab] OR “ketogenic diet”[tiab] OR “ketogenic diets”[tiab] OR “liquid diet”[tiab] OR “liquid diets”[tiab] OR “reducing diet”[tiab] OR “reducing diets”[tiab] OR (“total diet”[tiab] AND replacement[tiab]) OR VLED[tiab] OR VLCD[tiab] OR LCD[tiab] | 21,663 |
Suggested citation: EFSA NDA Panel (EFSA Panel on Nutrition, Novel Foods and Food Allergens) , Castenmiller J, de Henauw S, Hirsch‐Ernst K‐I, Kearney J, Knutsen HK, Mangelsdorf I, McArdle HJ, Naska A, Pelaez C, Pentieva K, Siani A, Thies F, Tsabouri S, Vinceti M, Titz A and Turck D, 2021. Statement on additional scientific evidence in relation to the essential composition of total diet replacement for weight control. EFSA Journal 2021;19(4):6494, 62 pp. 10.2903/j.efsa.2021.6494
Requestor: European Commission
Question number: EFSA‐Q‐2020‐00260
Panel members: Dominique Turck, Jacqueline Castenmiller, Stefaan De Henauw, Karen Ildico Hirsch‐Ernst, John Kearney, Helle Katrine Knutsen, Alexandre Maciuk, Inge Mangelsdorf, Harry J McArdle, Androniki Naska, Carmen Pelaez, Kristina Pentieva, Alfonso Siani, Frank Thies, Sophia Tsabouri and Marco Vinceti.
Declarations of interest: The declarations of interest of all scientific experts active in EFSA's work are available at https://ess.efsa.europa.eu/doi/doiweb/doisearch.
Acknowledgements: The Panel wishes to thank the following EFSA staff members for the support provided to this scientific output: Océane Albert, Fabio Alfieri, Carsten Behring, Janusz Ciok, Ester Artau Cortacans, José Cortiñas Abrahantes, Ionut Craciun, Céline Dumas, Lucia Fabiani, Estefania Noriega Fernandez, Irene Muñoz Guajardo, Tilemachos Goumperis, Leonard Matijevic, Charlotte Salgaard Nielsen, Gabriela Precup and Ruth Roldan.
Adopted: 24 February 2021
Notes
Commission Delegated Regulation (EU) 2017/1798 of 2 June 2017 supplementing Regulation (EU) No 609/2013 of the European Parliament and of the Council as regards the specific compositional and information requirements for total diet replacement for weight control.
Bork CS, Venø SK and Lundbye‐Christensen S, 2018. Adipose tissue content of alpha‐linolenic acid and the risk of ischemic stroke and ischemic stroke subtypes: a Danish case‐cohort study. PloSOne, 13, e0198927. 10.1371/journal.pone.0198927
Christensen P, Bliddal H and Riecke BF, 2011. Comparison of a low‐energy diet and a very low energy diet in sedentary obese individuals: a pragmatic randomised controlled trial. Clinical Obesity, 1, 31–40.
Christensen P, Meinert Larsen T and Westerterp‐Plantenga M, 2018. Men and women respond differently to rapid weight loss: metabolic outcomes of a multi‐centre intervention study after a low energy diet in 2500 overweight, individuals with pre‐diabetes (PREVIEW). Diabetes, Obesity & Metabolism, 20, 2840–2851.
Lean ME, Leslie WS and Barnes AC, 2017. Primary care‐led weight management for remission of type 2 diabetes (DiRECT): an open‐label, cluster‐randomised trial. Lancet, 391, 541–51.
Lefebvre P, Letois F and Sultan A, 2014. Nutrient deficiencies in patients with obesity considering bariatric surgery: a cross‐sectional study. Surg Obes Relat Dis, 10, 540–546. https://doi.org/10.1016/j.soard.2013.10.003. Epub 2013 Oct 14.
Venø SK, Bork CS and Jakobsen MU, 2018. Linoleic acid in adipose tissue and development of ischemic stroke: a Danish Case‐Cohort Study. Journal of American Heart Association, 7, pii: e009820. https://doi.org/10.1161/JAHA.118.009820
BMI ≥ 25 kg/m2.
Regulation (EU) No 609/2013 of the European Parliament and of the Council of 12 June 2013 on food intended for infants and young children, food for special medical purposes, and total diet replacement for weight control and repealing Council Directive 92/52/EEC, Commission Directives 96/8/EC, 1999/21/EC, 2006/125/EC and 2006/141/EC, Directive 2009/39/EC of the European Parliament and of the Council and Commission Regulations (EC) No 41/2009 and (EC) No 953/2009.
Commission Directive 96/8/EC of 26 February 1996 on foods intended for use in energy‐restricted diets for weight reduction.
i.e. the generation of volatile fatty acid methyl ester derivatives before fatty acid analysis by gas chromatography.
Three studies investigated two different TDRs with different macronutrient compositions.
Dietary Approaches to Stop Hypertension.
References
- Andersen LF, Solvoll K, Johansson LRK, Salminen I, Aro A and Drevon CA, 1999. Evaluation of a food frequency questionnaire with weighed records, fatty acids, and alpha‐tocopherol in adipose tissue and serum. American Journal of Epidemiology, 150, 75–87. [DOI] [PubMed] [Google Scholar]
- Behary P, Tharakan G, Alexiadou K, Johnson N, Wewer Albrechtsen NJ, Kenkre J, Cuenco J, Hope D, Anyiam O, Choudhury S, Alessimii H, Poddar A, Minnion J, Doyle C, Frost G, Le Roux C, Purkayastha S, Moorthy K, Dhillo W, Holst JJ, Ahmed AR, Prevost AT, Bloom SR and Tan TM, 2019. Combined GLP‐1, oxyntomodulin, and peptide YY improves body weight and glycemia in obesity and prediabetes/type 2 diabetes: a randomized, single‐blinded, placebo‐controlled study. Diabetes Care, 42, 1446–1453. 10.2337/dc19-0449 [DOI] [PubMed] [Google Scholar]
- Biong AS, Veierød MB, Ringstad J, Thelle DS and Pedersen JI, 2006. Intake of milk fat, reflected in adipose tissue fatty acids and risk of myocardial infarction: a case‐control study. European Journal of Clinical Nutrition, 60, 236–244. [DOI] [PubMed] [Google Scholar]
- Bolton‐Smith C, Woodward M and Tavendale R, 1997. Evidence for age‐related differences in the fatty acid composition of human adipose tissue, independent of diet. European Journal of Clinical Nutrition, 51, 619–624. [DOI] [PubMed] [Google Scholar]
- Bonnefont‐Rousselot D, Lepage S, Thérond P, Bastard JP, Hainque B, Turpin G, Legrand A, Delattre J and Bruckert E, 1999. Modifications of alpha‐tocopherol and fatty acid concentrations in blood and adipose tissue of obese patients during a weight loss programme. Nutrition, Metabolism, and Cardiovascular Diseases, 9, 25–32. [PubMed] [Google Scholar]
- Bork CS, Venø SK, Lundbye‐Christensen S, Jakobsen MU, Tjønneland A, Calder PC, Overvad K and Schmidt EB, 2018. Adipose tissue content of alpha‐linolenic acid and the risk of ischemic stroke and ischemic stroke subtypes: a Danish case‐cohort study. PLoS ONE, 13. 10.1371/journal.pone.0198927 [DOI] [PMC free article] [PubMed] [Google Scholar]
- Boué C, Combe N, Billeaud C, Mignerot C, Entressangles B, Thery G, Geoffrion H, Brun JL, Dallay D and Leng JJ, 2000. Trans fatty acids in adipose tissue of French women in relation to their dietary sources. Lipids, 35, 561–566. [DOI] [PubMed] [Google Scholar]
- Broomfield PH, Chopra R, Sheinbaum RC, Bonorris GG, Silverman A, Schoenfield LJ and Marks JW, 1988. Effects of ursodeoxycholic acid and aspirin on the formation of lithogenic bile and gallstones during loss of weight. The New England Journal of Medicine, 319, 1567–1572. 10.1056/NEJM198812153192403 [DOI] [PubMed] [Google Scholar]
- Calder PC, Harvey DJ, Pond CM and Newsholme EA, 1992. Site‐specific differences in the fatty acid composition of human adipose tissue. Lipids, 27, 716–720. [DOI] [PubMed] [Google Scholar]
- Cantwell MM, Gibney MJ, Cronin D, Younger KM, O'Neill JP, Hogan L and Flynn MAT, 2005. Development and validation of a food‐frequency questionnaire for the determination of detailed fatty acid intakes. Public Health Nutrition, 8, 97–107. [DOI] [PubMed] [Google Scholar]
- Cappuccio FP, Markandu ND, Beynon GW, Shore AC, Sampson B and MacGregor GA, 1985. Lack of effect of oral magnesium on high blood pressure: a double blind study. British Medical Journal (Clinical Research Ed.), 291, 235–238. 10.1136/bmj.291.6490.235 [DOI] [PMC free article] [PubMed] [Google Scholar]
- Christensen P, Bliddal H, Riecke BF, Leeds AR, Astrup A and Christensen R, 2011. Comparison of a low‐energy diet and a very low‐energy diet in sedentary obese individuals: a pragmatic randomized controlled trial. Clinical Obesity, 1, 31–40. 10.1111/j.1758-8111.2011.00006.x [DOI] [PubMed] [Google Scholar]
- Christensen P, Meinert Larsen T, Westerterp‐Plantenga M, Macdonald I, Martinez JA, Handjiev S, Poppitt S, Hansen S, Ritz C, Astrup A, Pastor‐Sanz L, Sandø‐Pedersen F, Pietiläinen KH, Sundvall J, Drummen M, Taylor MA, Navas‐Carretero S, Handjieva‐Darlenska T, Brodie S, Silvestre MP, Huttunen‐Lenz M, Brand‐Miller J, Fogelholm M and Raben A, 2018. Men and women respond differently to rapid weight loss: metabolic outcomes of a multi‐centre intervention study after a low‐energy diet in 2500 overweight, individuals with pre‐diabetes (PREVIEW). Diabetes, Obesity and Metabolism, 20, 2840–2851. 10.1111/dom.13466 [DOI] [PMC free article] [PubMed] [Google Scholar]
- Cosaro E, Bonafini S, Montagnana M, Danese E, Trettene MS, Minuz P, Delva P and Fava C, 2014. Effects of magnesium supplements on blood pressure, endothelial function and metabolic parameters in healthy young men with a family history of metabolic syndrome. Nutrition, Metabolism, and Cardiovascular Diseases, 24, 1213–1220. 10.1016/j.numecd.2014.05.010 [DOI] [PubMed] [Google Scholar]
- Cottet V, Vaysse C, Scherrer ML, Ortega‐Deballon P, Lakkis Z, Delhorme JB, Deguelte‐Lardière S, Combe N and Bonithon‐Kopp C, 2015. Fatty acid composition of adipose tissue and colorectal cancer: a case‐control study. American Journal of Clinical Nutrition, 101, 192–201. [DOI] [PubMed] [Google Scholar]
- Cruz ML, Evans K and Frayn KN, 2001. Postprandial lipid metabolism and insulin sensitivity in young Northern Europeans, South Asians and Latin Americans in the UK. Atherosclerosis, 159, 441–449. [DOI] [PubMed] [Google Scholar]
- Dahm CC, Gorst‐Rasmussen A, Jakobsen MU, Schmidt EB, Tjønneland A, Sørensen TIA and Overvad K, 2011. Adipose tissue fatty acid patterns and changes in anthropometry: a cohort study. PLoS ONE, 6. [DOI] [PMC free article] [PubMed] [Google Scholar]
- Danner SA, Wieling W and Havekes L, 1984. Effect of physical exercise on blood lipids and adipose tissue composition in young healthy men. Atherosclerosis, 53, 83–90. [DOI] [PubMed] [Google Scholar]
- Davies HJ, Baird IM, Fowler J, Mills IH, Baillie JE, Rattan S and Howard AN, 1989. Metabolic response to low‐ and very‐low‐calorie diets. American Journal of Clinical Nutrition, 49, 745–751. 10.1093/ajcn/49.5.745 [DOI] [PubMed] [Google Scholar]
- Dolberg MK, Nielsen LP and Dahl R, 2017. Pharmacokinetic Profile of Oral Magnesium Hydroxide. Basic & Clinical Pharmacology & Toxicology, 120, 264–269. 10.1111/bcpt.12642 [DOI] [PubMed] [Google Scholar]
- Due A, Larsen TM, Mu H, Hermansen K, Stender S and Astrup A, 2008. Comparison of 3 ad libitum diets for weight‐loss maintenance, risk of cardiovascular disease, and diabetes: a 6‐mo randomized, controlled trial. American Journal of Clinical Nutrition, 88, 1232–1241. 10.3945/ajcn.2007.25695 [DOI] [PubMed] [Google Scholar]
- EFSA (European Food Safety Authority), 2014. Guidance on Expert Knowledge Elicitation in Food and Feed Safety Risk Assessment. EFSA Journal 2014;12:3734. 10.2903/j.efsa.2014.3734 [DOI] [Google Scholar]
- EFSA NDA Panel (EFSA Panel on Dietetic Products, Nutrition and Allergies), 2010. Scientific Opinion on Dietary Reference Values for fats, including saturated fatty acids, polyunsaturated fatty acids, monounsaturated fatty acids, trans fatty acids, and cholesterol. EFSA Journal 2010;8(3):1461, 107 pp. 10.2903/j.efsa.2010.1461 Available online: https://www.efsa.europa.eu/en/efsajournal/pub/1461 [DOI] [Google Scholar]
- EFSA NDA Panel (EFSA Panel on Dietetic Products, Nutrition and Allergies), 2013. Scientific Opinion on Dietary Reference Values for energy. EFSA Journal 2013;11(1):3005, 112 pp. 10.2903/j.efsa.2013.3005 [DOI] [Google Scholar]
- EFSA NDA Panel (EFSA Panel on Dietetic Products Nutrition and Allergies), 2015a. Scientific Opinion on Dietary Reference Values for magnesium. EFSA Journal 2015;13(7):4186, 63 pp. 10.2903/j.efsa.2015.4186 Available online: https://efsa.onlinelibrary.wiley.com/doi/abs/10.2903/j.efsa.2015.4186 [DOI] [Google Scholar]
- EFSA NDA Panel (EFSA Panel on Dietetic Products Nutrition and Allergies), 2015b. Scientific Opinion on the essential composition of total diet replacements for weight control. EFSA Journal 2015;13(1):3957, 52 pp. 10.2903/j.efsa.2015.3957 Available online: https://efsa.onlinelibrary.wiley.com/doi/abs/10.2903/j.efsa.2015.3957 [DOI] [Google Scholar]
- EFSA Scientific Committee , Benford D, Halldorsson T, Jeger MJ, Knutsen HK, More S, Naegeli H, Noteborn H, Ockleford C, Ricci A, Rychen G, Schlatter JR, Silano V, Solecki R, Turck D, Younes M, Craig P, Hart A, Von Goetz N, Koutsoumanis K, Mortensen A, Ossendorp B, Martino L, Merten C, Mosbach‐Schulz O and Hardy A, 2018. Guidance on Uncertainty Analysis in Scientific Assessments. EFSA Journal 2018;16(1):5123, 39 pp. 10.2903/j.efsa.2018.5123issn.e05123 pp. Available online: https://efsa.onlinelibrary.wiley.com/doi/abs/10.2903/j.efsa.2018.5123 [DOI] [PMC free article] [PubMed] [Google Scholar]
- EFSA (European Food Safety Authority), Martino L, Aiassa E, Halldórsson T, Koutsoumanis P, Naegeli H, Baert K, Baldinelli F, Devos Y, Lodi F, Lostia A, Manini P, Merten C, Messens W, Rizzi V, Tarazona J, Titz A and Vos S, 2020. Draft framework for protocol development for EFSA's scientific assessments. EFSA Journal 2020;EN‐1843, 46 pp. 10.2903/sp.efsa.2020.EN-1843 Available online: https://efsa.onlinelibrary.wiley.com/doi/abs/10.2903/sp.efsa.2020.EN-1843 [DOI] [Google Scholar]
- Festi D, Colecchia A, Orsini M, Sangermano A, Sottili S, Simoni P, Mazzella G, Villanova N, Bazzoli F, Lapenna D, Petroni ML, Pavesi S, Neri M and Roda E, 1998. Gallbladder motility and gallstone formation in obese patients following very low calorie diets. Use it (fat) to lose it (well). International Journal of Obesity and Related Metabolic Disorders, 22, 592–600. 10.1038/sj.ijo.0800634 [DOI] [PubMed] [Google Scholar]
- Festi D, Colecchia A, Larocca A, Villanova N, Mazzella G, Petroni ML, Romano F and Roda E, 2000. Review: low caloric intake and gall‐bladder motor function. Alimentary Pharmacology and Therapeutics, 14(Suppl. 2), 51–53. 10.1046/j.1365-2036.2000.014s2051.x [DOI] [PubMed] [Google Scholar]
- Feunekes GIJ, Van Staveren WA, De Vries JHM, Burema J and Hautvast JGAJ, 1993. Relative and biomarker‐based validity of a food‐frequency questionnaire estimating intake of fats and cholesterol. American Journal of Clinical Nutrition, 58, 489–496. [DOI] [PubMed] [Google Scholar]
- Fine KD, Santa Ana CA and Fordtran JS, 1991a. Diagnosis of magnesium‐induced diarrhea. The New England Journal of Medicine, 324, 1012–1017. 10.1056/nejm199104113241502 [DOI] [PubMed] [Google Scholar]
- Fine KD, Santa Ana CA, Porter JL and Fordtran JS, 1991b. Intestinal absorption of magnesium from food and supplements. The Journal of Clinical Investigation, 88, 396–402. 10.1172/JCI115317 [DOI] [PMC free article] [PubMed] [Google Scholar]
- Garaulet M, Pérez‐Llamas F, Pérez‐Ayala M, Martínez P, Sánchez De Medina F, Tebar FJ and Zamora S, 2001. Site‐specific differences in the fatty acid composition of abdominal adipose tissue in an obese population from a mediterranean area: relation with dietary fatty acids, plasma lipid profile, serum insulin, and central obesity. American Journal of Clinical Nutrition, 74, 585–591. [DOI] [PubMed] [Google Scholar]
- Garaulet M, Hernandez‐Morante JJ, Tebar FJ and Zamora S, 2011. Relation between degree of obesity and site‐specific adipose tissue fatty acid composition in a Mediterranean population. Nutrition, 27, 170–176. [DOI] [PubMed] [Google Scholar]
- Gebhard RL, Prigge WF, Ansel HJ, Schlasner L, Ketover SR, Sande D, Holtmeier K and Peterson FJ, 1996. The role of gallbladder emptying in gallstone formation during diet‐induced rapid weight loss. Hepatology, 24, 544–548. 10.1002/hep.510240313 [DOI] [PubMed] [Google Scholar]
- Gils Contreras A, Bonada Sanjaume A, Montero Jaime M, Rabassa Soler A, Sabench Pereferrer F, Molina Lopez A, Becerra Tomas N, Del Castillo Dejardin D and Salas‐Salvado J, 2018. Effects of two preoperatory weight loss diets on hepatic volume, metabolic parameters, and surgical complications in morbid obese bariatric surgery candidates: a randomized clinical trial. Obesity Surgery, 28, 3756–3768. 10.1007/s11695-018-3413-7 [DOI] [PubMed] [Google Scholar]
- Guallar E, Aro A, Jiménez FJ, Martín‐Moreno JM, Salminen I, Van't Veer P, Kardinaal AFM, Gömez‐Aracena J, Martin BC, Kohlmeier L, Kark JD, Mazaev VP, Ringstad J, Guillén J, Riemersma RA, Huttunen JK, Thamm M and Kok FJ, 1999. Omega‐3 fatty acids in adipose tissue and risk of myocardial infarction: the EURAMIC study. Arteriosclerosis, Thrombosis, and Vascular Biology, 19, 1111–1118. [DOI] [PubMed] [Google Scholar]
- Halliwell KJ, Fielding BA, Samra JS, Humphreys SM and Frayn KN, 1996. Release of individual fatty acids from human adipose tissue in vivo after an overnight fast. Journal of Lipid Research, 37, 1842–1848. [PubMed] [Google Scholar]
- Heemskerk MM, Giera M, el Bouazzaoui F, Lips MA, Pijl H, van Dijk KW and van Harmelen V, 2015. Increased PUFA content and 5‐lipoxygenase pathway expression are associated with subcutaneous adipose tissue inflammation in obesewomen with type 2 diabetes. Nutrients, 7, 7676–7690. [DOI] [PMC free article] [PubMed] [Google Scholar]
- Hernandez‐Morante JJ, Cerezo D, Cruz RM, Larque E, Zamora S and Garaulet M, 2011. Dehydroepiandrosterone‐sulfate modifies human fatty acid composition of different adipose tissue depots. Obesity Surgery, 21, 102–111. [DOI] [PubMed] [Google Scholar]
- Hill JO, Sparling PB, Shields TW and Heller PA, 1987. Effects of exercise and food restriction on body composition and metabolic rate in obese women. American Journal of Clinical Nutrition, 46, 622–630. 10.1093/ajcn/46.4.622 [DOI] [PubMed] [Google Scholar]
- Hodson L, Harnden K, Banerjee R, Real B, Marinou K, Karpe F and Fielding BA, 2014. Lower resting and total energy expenditure in postmenopausal compared with premenopausal women matched for abdominal obesity. Journal of Nutritional Science, 3(e3), 2014. 10.1017/jns.2013.38.eCollection [DOI] [PMC free article] [PubMed] [Google Scholar]
- Iggman D, Ärnlöv J, Cederholm T and Risérus U, 2016. Association of adipose tissue fatty acids with cardiovascular and all‐cause mortality in elderly men. JAMA Cardiology, 1, 745–753. [DOI] [PubMed] [Google Scholar]
- Jiang J, Wolk A and Vessby B, 1999. Relation between the intake of milk fat and the occurrence of conjugated linoleic acid in human adipose tissue. American Journal of Clinical Nutrition, 70, 21–27. [DOI] [PubMed] [Google Scholar]
- Johansson K, Sundstrom J, Marcus C, Hemmingsson E and Neovius M, 2014. Risk of symptomatic gallstones and cholecystectomy after a very‐low‐calorie diet or low‐calorie diet in a commercial weight loss program: 1‐year matched cohort study. International Journal of Obesity (London), 38, 279–284. 10.1038/ijo.2013.83 [DOI] [PMC free article] [PubMed] [Google Scholar]
- Kaminskas A, Ziedén B, Elving B, Kristenson M, Abaravicius A, Bergdahl B, Olsson AG and Kucinskiene Z, 1999. Adipose tissue fatty acids in men from two populations with different cardiovascular risk: the LiVicordia study. Scandinavian Journal of Clinical and Laboratory Investigation, 59, 227–232. [DOI] [PubMed] [Google Scholar]
- Kato Y, Yamaguchi S, Yachiku S, Nakazono S, Hori J, Wada N and Hou K, 2004. Changes in urinary parameters after oral administration of potassium‐sodium citrate and magnesium oxide to prevent urolithiasis. Urology, 63, 7–11, discussion 11–12. 10.1016/j.urology.2003.09.057 [DOI] [PubMed] [Google Scholar]
- Kishimoto Y, Tani M, Uto‐Kondo H, Saita E, Iizuka M, Sone H, Yokota K and Kondo K, 2010. Effects of magnesium on postprandial serum lipid responses in healthy human subjects. British Journal of Nutrition, 103, 469–472. 10.1017/s0007114509992716 [DOI] [PubMed] [Google Scholar]
- Kotronen A, Seppänen‐Laakso T, Westerbacka J, Kiviluoto T, Arola J, Ruskeepää AL, Yki‐Järvinen H and Orešič M, 2010. Comparison of lipid and fatty acid composition of the liver, subcutaneous and intra‐abdominal adipose tissue, and serum. Obesity, 18, 937–944. [DOI] [PubMed] [Google Scholar]
- Kunešová M, Phinney S, Hainer V, Tvrzická E, Štich V, Parízková J, Žák A and Stunkard A, 2002. The responses of serum and adipose fatty acids to a one‐year weight reduction regimen in female obese monozygotic twins. Annals of the New York Academy of Sciences, 967, 311–323. [DOI] [PubMed] [Google Scholar]
- Kunešová M, Hlavatý P, Tvrzická E, Staňková B, Kalousková P, Viguerie N, Larsen TM, Van Baak MA, Jebb SA, Martinez JA, Pfeiffer AFH, Kafatos A, Handjieva‐Darlenska T, Hill M, Langin D, Žák A, Astrup A and Saris WHM, 2012. Fatty acid composition of adipose tissue triafter weight loss and weight maintenance: the DIOGENES study. Physiological Research, 61, 597–607. [DOI] [PMC free article] [PubMed] [Google Scholar]
- Kunešová M, Sedláčková B, Bradnová O, Tvrzická E, Staňková B, Šrámková P, DoleŽalová K, Kalousková P, Hlavatý P, Hill M, Bendlová B, Fried M, Hainer V and Vrbíková J, 2015. Fatty acid composition of adipose tissue triglycerides in obese diabetic women after bariatric surgery: a 2‐year follow up. Physiological research/Academia Scientiarum Bohemoslovaca, 64, S155–S166. [DOI] [PubMed] [Google Scholar]
- Lean MEJ, Leslie WS, Barnes AC, Brosnahan N, Thom G, McCombie L, Peters C, Zhyzhneuskaya S, Al‐Mrabeh A, Hollingsworth KG, Rodrigues AM, Rehackova L, Adamson AJ, Sniehotta FF, Mathers JC, Ross HM, McIlvenna Y, Stefanetti R, Trenell M, Welsh P, Kean S, Ford I, McConnachie A, Sattar N and Taylor R, 2018. Primary care‐led weight management for remission of type 2 diabetes (DiRECT): an open‐label, cluster‐randomised trial. The Lancet, 391, 541–551. 10.1016/S0140-6736(17)33102-1 [DOI] [PubMed] [Google Scholar]
- Lee TA, Li Z, Zerlin A and Heber D, 2010. Effects of dihydrocapsiate on adaptive and diet‐induced thermogenesis with a high protein very low calorie diet: a randomized control trial. Nutrition and Metabolism (London), 7, 78. 10.1186/1743-7075-7-78 [DOI] [PMC free article] [PubMed] [Google Scholar]
- Leichsenring M, Hardenack M and Laryea MD, 1992. The fatty acid composition of subcutaneous fat in German adults. Zeitschrift fur Ernahrungswissenschaft, 31, 130–137. [DOI] [PubMed] [Google Scholar]
- Liddle RA, Goldstein RB and Saxton J, 1989. Gallstone formation during weight‐reduction dieting. Archives of Internal Medicine, 149, 1750–1753. [PubMed] [Google Scholar]
- Lissner L, Kroon UB, Bjorntorp P, Blosk S, Wilhelmsen L and Silverstolpe G, 1993. Adipose tissue fatty acids and dietary fat sources in relation to endometrial cancer. A retrospective study of cases in remission, and population‐based controls. Acta Obstetricia et Gynecologica Scandinavica, 72, 481–487. [DOI] [PubMed] [Google Scholar]
- Lopes C, Aro A, Azevedo A, Ramos E and Barros H, 2007. Intake and adipose tissue composition of fatty acids and risk of myocardial infarction in a male Portuguese community sample. Journal of the American Dietetic Association, 107, 276–286. [DOI] [PubMed] [Google Scholar]
- Lundbom J, Hakkarainen A, Fielding B, Söderlund S, Westerbacka J, Taskinen MR and Lundbom N, 2010. Characterizing human adipose tissue lipids by long echo time 1H‐MRS in vivo at 1.5 Tesla: validation by gas chromatography. NMR in Biomedicine, 23, 466–472. [DOI] [PubMed] [Google Scholar]
- Mamalakis G, Kafatos A, Tornaritis M and Alevizos B, 1998. Anxiety and adipose essential fatty acid precursors for prostaglandin E1 and E2. Journal of the American College of Nutrition, 17, 239–243. [DOI] [PubMed] [Google Scholar]
- Mamalakis G, Kafatos A, Kalogeropoulos N, Andrikopoulos N, Daskalopulos G and Kranidis A, 2002a. Prostate cancer vs hyperplasia: relationships with prostatic and adipose tissue fatty acid composition. Prostaglandins Leukotrienes and Essential Fatty Acids, 66, 467–477. [DOI] [PubMed] [Google Scholar]
- Mamalakis G, Tornaritis M and Kafatos A, 2002b. Depression and adipose essential polyunsaturated fatty acids. Prostaglandins, Leukotrienes & Essential Fatty Acids, 67, 311–318. 10.1054/plef.2002.0435 [DOI] [PubMed] [Google Scholar]
- Mamalakis G, Kiriakakis M, Tsibinos G and Kafatos A, 2004. Depression and adipose polyunsaturated fatty acids in the survivors of the seven countries study population of crete. Prostaglandins, Leukotrienes & Essential Fatty Acids, 70, 495–501. 10.1016/j.plefa.2003.10.005 [DOI] [PubMed] [Google Scholar]
- Mamalakis G, Kalogeropoulos N, Andrikopoulos N, Hatzis C, Kromhout D, Moschandreas J and Kafatos A, 2006. Depression and long chain n‐3 fatty acids in adipose tissue in adults from Crete. European Journal of Clinical Nutrition, 60, 882–888. 10.1038/sj.ejcn.1602394 Epub 2006 Feb 8. [DOI] [PubMed] [Google Scholar]
- Mamalakis G, Kiriakakis M, Tsibinos G, Jansen E, Cremers H, Strien C, Hatzis C, Moschandreas J, Linardakis M, Kromhout D and Kafatos A, 2008. Lack of an association of depression with n‐3 polyunsaturated fatty acids in adipose tissue and serum phospholipids in healthy adults. Pharmacology Biochemistry & Behavior, 89, 6–10. 10.1016/j.pbb.2007.10.015 Epub 2007 Oct 30. [DOI] [PubMed] [Google Scholar]
- Mamalakis G, Hatzis C, De Bree E, Sanidas E, Tsiftsis DD, Askoxylakis J, Daskalakis M, Tsibinos G and Kafatos A, 2009. Adipose tissue fatty acids in breast cancer patients versus healthy control women from crete. Annals of Nutrition and Metabolism, 54, 275–282. [DOI] [PubMed] [Google Scholar]
- Marken PA, Weart CW, Carson DS, Gums JG and Lopes‐Virella MF, 1989. Effects of magnesium oxide on the lipid profile of healthy volunteers. Atherosclerosis, 77, 37–42. 10.1016/0021-9150(89)90007-5 [DOI] [PubMed] [Google Scholar]
- Navarrete‐Cortes A, Ble‐Castillo JL, Guerrero‐Romero F, Cordova‐Uscanga R, Juárez‐Rojop IE, Aguilar‐Mariscal H, Tovilla‐Zarate CA and Lopez‐Guevara Mdel R, 2014. No effect of magnesium supplementation on metabolic control and insulin sensitivity in type 2 diabetic patients with normomagnesemia. Magnesium Research, 27, 48–56. 10.1684/mrh.2014.0361 [DOI] [PubMed] [Google Scholar]
- Nikolakakis N, Kounali D, Tornaritis M, Anastassou A, Papadakis E, Kassotakis G and Kafatos A, 1999. Adipose tissue fatty acid composition, serum lipids, and serum α‐tocopherol in continuous ambulatory peritoneal dialysis patients living on the island of Crete. Peritoneal Dialysis International, 19, 154–159. [PubMed] [Google Scholar]
- Ohrvall M, Tengblad S and Vessby B, 1994. Tocopherol concentrations in adipose tissue. Relationships of tocopherol concentrations and fatty acid composition in serum in a reference population of Swedish men and women. European Journal of Clinical Nutrition, 48, 212–218. [PubMed] [Google Scholar]
- Pedersen JI, Ringstad J, Almendingen K, Haugen TS, Stensvold I and Thelle DS, 2000. Adipose tissue fatty acids and risk of myocardial infarction ‐ a case‐control study. European Journal of Clinical Nutrition, 54, 618–625. [DOI] [PubMed] [Google Scholar]
- Petrova S, Dimitrov P, Willett WC and Campos H, 2011. The global availability of n‐3 fatty acids. Public Health Nutrition, 14, 1157–1164. 10.1017/S1368980010003678 Epub 2011 Mar 31. [DOI] [PMC free article] [PubMed] [Google Scholar]
- Petrus P, Edholm D, Rosqvist F, Dahlman I, Sundbom M, Arner P, Rydén M and Risérus U, 2017. Depot‐specific differences in fatty acid composition and distinct associations with lipogenic gene expression in abdominal adipose tissue of obese women. International Journal of Obesity, 41, 1295–1298. [DOI] [PMC free article] [PubMed] [Google Scholar]
- Phinney SD, LaGrange BM, O'Connell M and Danforth E Jr, 1988. Effects of aerobic exercise on energy expenditure and nitrogen balance during very low calorie dieting. Metabolism, 37, 758–765. 10.1016/0026-0495(88)90011-x [DOI] [PubMed] [Google Scholar]
- Phinney SD, Tang AB, Johnson SB and Holman RT, 1990. Reduced adipose 18∶3ω3 with weight loss by very low calorie dieting. Lipids, 25, 798–806. 10.1007/BF02535900 [DOI] [PubMed] [Google Scholar]
- Pinnick KE, Neville MJ, Fielding BA, Frayn KN, Karpe F and Hodson L, 2012. Gluteofemoral adipose tissue plays a major role in production of the lipokine palmitoleate in humans. Diabetes, 61, 1399–1403. [DOI] [PMC free article] [PubMed] [Google Scholar]
- Popp‐Snijders C and Blonk MC, 1995. Omega‐3 fatty acids in adipose tissue of obese patients with non‐insulin‐ dependent diabetes mellitus reflect long‐term dietary intake of eicosapentaenoic and docosahexaenoic acid. American Journal of Clinical Nutrition, 61, 360–365. [DOI] [PubMed] [Google Scholar]
- Purvis JR, Cummings DM, Landsman P, Carroll R, Barakat H, Bray J, Whitley C and Horner RD, 1994. Effect of oral magnesium supplementation on selected cardiovascular risk factors in non‐insulin‐dependent diabetics. Archives of Family Medicine, 3, 503–508. 10.1001/archfami.3.6.503 [DOI] [PubMed] [Google Scholar]
- Roberts TL, Wood DA, Riemersma RA, Gallagher PJ and Lampe FC, 1993. Linoleic acid and risk of sudden cardiac death. British Heart Journal, 70, 524–529. [DOI] [PMC free article] [PubMed] [Google Scholar]
- Ruiz‐Gutierrez V, Montero E and Villar J, 1992. Determination of fatty acid and triacylglycerol composition of human adipose tissue. Journal of Chromatography ‐ Biomedical Applications, 581, 171–178. [DOI] [PubMed] [Google Scholar]
- Sanders TA, Ellis FR and Dickerson JW, 1978. Studies of vegans: the fatty acid composition of plasma choline phosphoglycerides, erythrocytes, adipose tissue, and breast milk, and some indicators of susceptibility to ischemic heart disease in vegans and omnivore controls. American Journal of Clinical Nutrition, 31, 805–813. 10.1093/ajcn/31.5.805 [DOI] [PubMed] [Google Scholar]
- Scazzocchio B, Varì R, Silenzi A, Giammarioli S, Masotti A, Baldassarre A, Santangelo C, Archivio M, Giovannini C, Del Cornò M, Conti L, Gessani S and Masella R, 2020. Dietary habits affect fatty acid composition of visceral adipose tissue in subjects with colorectal cancer or obesity. European Journal of Nutrition, 59, 1463–1472. [DOI] [PubMed] [Google Scholar]
- SCF , 2001. Opinion of the scientific committee on food on the tolerable upper intake level of magnesium. 16 pp.
- Schäfer L and Overvad K, 1990. Subcutaneous adipose‐tissue fatty acids and vitamin E in humans: relation to diet and sampling site. American Journal of Clinical Nutrition, 52, 486–490. [DOI] [PubMed] [Google Scholar]
- Schäfer L, Overvad K, Thorling EB and Velander G, 1989. Adipose tissue levels of fatty acids and tocopherol in young and old women. Annals of Nutrition and Metabolism, 33, 315–322. [DOI] [PubMed] [Google Scholar]
- Seidelin KN, 1995. Fatty acid composition of adipose tissue in humans. Implications for the dietary fat‐serum cholesterol‐CHD issue. Progress in Lipid Research, 34, 199–217. 10.1016/0163-7827(95)00004-j [DOI] [PubMed] [Google Scholar]
- Shechter M, Saad T, Shechter A, Koren‐Morag N, Silver BB and Matetzky S, 2012. Comparison of magnesium status using X‐ray dispersion analysis following magnesium oxide and magnesium citrate treatment of healthy subjects. Magnesium Research, 25, 28–39. 10.1684/mrh.2012.0305 [DOI] [PubMed] [Google Scholar]
- Shiffman ML, Kaplan GD, Brinkman‐Kaplan V and Vickers FF, 1995. Prophylaxis against gallstone formation with ursodeoxycholic acid in patients participating in a very‐low‐calorie diet program. Annals of Internal Medicine, 122, 899–905. 10.7326/0003-4819-122-12-199506150-00002 [DOI] [PubMed] [Google Scholar]
- Sikorska‐Wisniewska M, Mika A, Sledzinski T, Czaplinska M, Malgorzewicz S, Debska‐Slizien A and Chmielewski M, 2020. Disorders of serum polyunsaturated fatty acids in renal transplant patients. Transplantation Proceedings, 52, 2324–2330. [DOI] [PubMed] [Google Scholar]
- Simonsen N, Van't Veer P, Strain JJ, Martin‐Moreno JM, Huttunen JK, Navajas JFC, Martin BC, Thamm M, Kardinaal AFM, Kok FJ and Kohlmeier L, 1998. Adipose tissue omega‐3 and omega‐6 fatty acid content and breast cancer in the euramic study. American Journal of Epidemiology, 147, 342–352. [DOI] [PubMed] [Google Scholar]
- Sjögren P, Sierra‐Johnson J, Kallings LV, Cederholm T, Kolak M, Halldin M, Brismar K, De Faire U, Hellénius ML and Fisher RM, 2012. Functional changes in adipose tissue in a randomised controlled trial of physical activity. Lipids in Health and Disease, 11, 80. [DOI] [PMC free article] [PubMed] [Google Scholar]
- Sledzinski T, Mika A, Stepnowski P, Proczko‐Markuszewska M, Kaska L, Stefaniak T and Swierczynski J, 2013. Identification of cyclopropaneoctanoic acid 2‐hexyl in human adipose tissue and serum. Lipids, 48, 839–848. [DOI] [PMC free article] [PubMed] [Google Scholar]
- Stanko RT, Tietze DL and Arch JE, 1992a. Body composition, energy utilization, and nitrogen metabolism with a 4.25‐MJ/d low‐energy diet supplemented with pyruvate. American Journal of Clinical Nutrition, 56, 630–635. 10.1093/ajcn/56.4.630 [DOI] [PubMed] [Google Scholar]
- Stanko RT, Tietze DL and Arch JE, 1992b. Body composition, nitrogen metabolism, and energy utilization with feeding of mildly restricted (4.2 MJ/d) and severely restricted (2.1 MJ/d) isonitrogenous diets. American Journal of Clinical Nutrition, 56, 636–640. 10.1093/ajcn/56.4.636 [DOI] [PubMed] [Google Scholar]
- Stone BG, Ansel HJ, Peterson FJ and Gebhard RL, 1992. Gallbladder emptying stimuli in obese and normal‐weight subjects. Hepatology, 15, 795–798. 10.1002/hep.1840150508 [DOI] [PubMed] [Google Scholar]
- Tang AB, Nishimura KY and Phinney SD, 1993. Preferential reduction in adipose tissue α‐linolenic acid (18∶3ω3) during very low calorie dieting despite supplementation with 18∶3ω3. Lipids, 28, 987–993. 10.1007/BF02537119 [DOI] [PubMed] [Google Scholar]
- Thomas EL, Taylor‐Robinson SD, Barnard ML, Frost G, Sargentoni J, Davidson BR, Cunnane SC and Bell JD, 1997. Changes in adipose tissue composition in malnourished patients before and after liver transplantation: a carbon‐13 magnetic resonance spectroscopy and gas‐liquid chromatography study. Hepatology, 25, 178–183. [DOI] [PubMed] [Google Scholar]
- Tjonneland A, Overvad K, Thorling E and Ewertz M, 1993. Adipose tissue fatty acids as biomarkers of dietary exposure in Danish men and women. American Journal of Clinical Nutrition, 57, 629–633. [DOI] [PubMed] [Google Scholar]
- Van Dale D, Saris WH, Schoffelen PF and Ten Hoor F, 1987. Does exercise give an additional effect in weight reduction regimens? International Journal of Obesity (London), 11, 367–375. [PubMed] [Google Scholar]
- Vazquez JA and Kazi U, 1994. Lipolysis and gluconeogenesis from glycerol during weight reduction with very‐low‐calorie diets. Metabolism, 43, 1293–1299. 10.1016/0026-0495(94)90225-9 [DOI] [PubMed] [Google Scholar]
- Venø SK, Nielsen MRS, Lundbye‐Christensen S, Schmidt EB and Handberg A, 2013. The effect of low‐dose marine n‐3 fatty acids on plasma levels of sCD36 in overweight subjects: a randomized, double‐blind, placebo‐controlled trial. Marine Drugs, 11, 3324–3334. [DOI] [PMC free article] [PubMed] [Google Scholar]
- Venø SK, Bork CS, Jakobsen MU, Lundbye‐Christensen S, Bach FW, Overvad K and Schmidt EB, 2018. Linoleic acid in adipose tissue and development of ischemic stroke: a Danish case‐cohort study. Journal of the American Heart Association, 7. 10.1161/jaha.118.009820 [DOI] [PMC free article] [PubMed] [Google Scholar]
- Vezina WC, Grace DM, Hutton LC, Alfieri MH, Colby PR, Downey DB, Vanderwerf RJ, White NF and Ward RP, 1998. Similarity in gallstone formation from 900 kcal/day diets containing 16 g vs 30 g of daily fat (evidence that fat restriction is not the main culprit of cholelithiasis during rapid weight reduction). Digestive Diseases and Sciences, 43, 554–561. 10.1023/A:1018863108262 [DOI] [PubMed] [Google Scholar]
- VKM , 2016. Risk assessment of magnesium in food supplements. Opinion of the Panel On Nutrition, Dietetic Products, Novel Food and Allergy of the Norwegian Scientific Committee for Food Safety. 978–82‐8259-205‐5, 47 pp. [Google Scholar]
- Vu MK, Nouwens MA, Biemond I, Lamers CB and Masclee AA, 2000. The osmotic laxative magnesium sulphate activates the ileal brake. Alimentary Pharmacology and Therapeutics, 14, 587–595. 10.1046/j.1365-2036.2000.00746.x [DOI] [PubMed] [Google Scholar]
- Walker CG, Browning LM, Stecher L, West AL, Madden J, Jebb SA and Calder PC, 2015. Fatty acid profile of plasma NEFA does not reflect adipose tissue fatty acid profile. British Journal of Nutrition, 114, 756–762. 10.1017/s0007114515002251 [DOI] [PubMed] [Google Scholar]
- Widman L, Wester PO, Stegmayr BK and Wirell M, 1993. The dose‐dependent reduction in blood pressure through administration of magnesium. A double blind placebo controlled cross‐over study. American Journal of Hypertension, 6, 41–45. 10.1093/ajh/6.1.41 [DOI] [PubMed] [Google Scholar]
- Wing RR, Vazquez JA and Ryan CM, 1995. Cognitive effects of ketogenic weight‐reducing diets. International Journal of Obesity and Related Metabolic Disorders, 19, 811–816. [PubMed] [Google Scholar]
- Witt PM, Christensen JH, Ewertz M, Aardestrup IV and Schmidt EB, 2010. The incorporation of marine n‐3 PUFA into platelets and adipose tissue in pre‐ and postmenopausal women: a randomised, double‐blind, placebo‐controlled trial. British Journal of Nutrition, 104, 318–325. [DOI] [PubMed] [Google Scholar]
- Yang MU, Barbosa‐Saldivar JL, Pi‐Sunyer FX and Van Itallie TB, 1981. Metabolic effects of substituting carbohydrate for protein in a low‐calorie diet: a prolonged study in obese patients. International Journal of Obesity (London), 5, 231–236. [PubMed] [Google Scholar]
- Yang H, Petersen GM, Roth MP, Schoenfield LJ and Marks JW, 1992. Risk factors for gallstone formation during rapid loss of weight. Digestive Diseases and Sciences, 37, 912–918. 10.1007/BF01300390 [DOI] [PubMed] [Google Scholar]
- Zatońska K, Campos H, Ilow R, Janik‐Koncewicz K, Rózańska D, Regulska‐Ilow B, Połtyn‐Zaradna K, Szuba A and Zatoński WA, 2012. Dietary intake and adipose tissue level of specific fatty acids in a selected group from the Lower Silesia population. Annals of Agricultural and Environmental Medicine, 19, 389–394. [PubMed] [Google Scholar]


