

Abstract
Aryl‐ether‐free anion‐exchange ionomers (AEIs) and membranes (AEMs) have become an important benchmark to address the insufficient durability and power‐density issues associated with AEM fuel cells (AEMFCs). Here, we present aliphatic chain‐containing poly(diphenyl‐terphenyl piperidinium) (PDTP) copolymers to reduce the phenyl content and adsorption of AEIs and to increase the mechanical properties of AEMs. Specifically, PDTP AEMs possess excellent mechanical properties (storage modulus>1800 MPa, tensile strength>70 MPa), H2 fuel‐barrier properties (<10 Barrer), good ion conductivity, and ex‐situ stability. Meanwhile, PDTP AEIs with low phenyl content and high‐water permeability display excellent peak power densities (PPDs). The present AEMFCs reach outstanding PPDs of 2.58 W cm−2 (>7.6 A cm−2 current density) and 1.38 W cm−2 at 80 °C in H2/O2 and H2/air, respectively, along with a specific power (PPD/catalyst loading) over 8 W mg−1, which is the highest record for Pt‐based AEMFCs so far.
Keywords: anion exchange ionomers, anion exchange membranes, fuel cells, peak power density, poly(alkyl terphenyl piperidinium)
Poly(alkyl‐terphenyl piperidinium) membranes and ionomers display outstanding hydrogen‐barrier properties and mechanical properties as well as excellent hydroxide‐ion conductivity that results in an excellent power density of 2.58 W cm−2 and 1.38 W cm−2 at 80 °C in H2/O2 and H2/air, respectively, along with a new, outstanding specific power in alkaline‐exchange‐membrane fuel cells.
Introduction
Anion exchange membrane fuel cells (AEMFCs) have recently received a widespread attention from the fuel cell community and US Department of Energy (DOE) because of their promising power density and prominent cost advantage in utilization of platinum group metal (PGM)‐free catalysts. These properties suggest them as candidates to replace expensive fluoropolymer‐based proton exchange membrane (PEM) fuel cells (PEMFCs).[ 1 , 2 , 3 , 4 , 5 ] However, several fundamental issues associated with AEMFCs have not been well resolved so far, particularly in terms of durability and power density.[ 6 , 7 , 8 , 9 ] Specifically, AEMFC performance is eventually determined by their key but scarce materials—anion exchange polyelectrolytes (AEPs) that can be used as anion exchange ionomers (AEIs) and/or anion exchange membranes (AEMs). AEPs consist of hydrophilic cationic groups and hydrophobic polymer backbones, which are responsible for conduction of anions (e.g., OH−) and maintaining dimensional stability, respectively.[ 10 , 11 , 12 , 13 , 14 , 15 ] Although numerous cationic groups (ammonium, imidazolium, phosphonium, sulfonium, and organometallic cations)[ 16 , 17 , 18 , 19 , 20 , 21 ] and polymer backbones (polyether ether ketone (PEEK), polysulfone (PSF), polyphenyl ether (PPO), polybenzimidazole (PBI), polyphenylene (PP), polyolefins, poly(norbornene) (PNB), and Troger's base (TB))[ 22 , 23 , 24 , 25 , 26 , 27 , 28 , 29 ] have been explored in AEPs, a majority of AEPs displayed insufficient ion conductivity and durability under alkaline conditions. That is, AEMFCs in the presence of OH− ions have several inherent drawbacks compared to PEMFCs. For instance, AEMs possess lower OH− conductivity than the H+ conductivity of PEMs due to the lower diffusion coefficient of the larger OH− ions. Meanwhile, most cationic groups and polymer backbones have been documented to be vulnerable and prone to degrade under harsh alkaline conditions.[ 30 , 31 ]
Encouragingly, AEMs have seen great progress in the past four years, resulting in tremendous advances in AEMFCs. One example is the discovery of aryl ether‐free polymer backbones and highly stable ammonium groups.[ 14 , 15 , 28 , 29 , 32 , 33 , 34 , 35 , 36 , 37 ] Years of study have revealed that aryl ether‐free AEPs possess superior durability, ion conductivity, and power density compared to aryl ether AEPs. Many early stage issues associated with AEMs, such as low ion conductivity and detrimental trade‐off between ion exchange capability (IEC) and dimensional stability, have been well addressed in recent years. The state‐of‐the‐art AEMs have exhibited promising power density and durability for AEMFCs, such as benzyl trimethylammonium‐functionalized high‐density polyethylene (BTMA‐HDPE), [14] polytetrafluoroethylene (PTFE)‐reinforced PNB,[ 28 , 29 ] and N‐heterocyclic and alkyl ammonium‐based polyphenylene.[ 34 , 35 , 36 , 37 ]
However, the overall performance of AEMs must be further improved to realize future development, especially in durability and mechanical stability. Moreover, many remaining issues should be recognized in current AEMFCs. For instance, most big jumps in current AEMFCs are based on somewhat unrealistic and uneconomic conditions, such as high gas flow rate (over 1000 mL min−1), high noble catalyst loading (≈0.7 mg cm−2), and water‐saturated operating conditions.[ 28 , 29 , 34 , 35 , 36 , 37 ] Effective and stable AEIs are lacking to date. Such AEIs should show minimal adsorption on catalysts and high oxidative stability, while most aryl AEIs display high phenyl adsorption, such as alkyl ammonium polyphenylene and poly(aryl piperidinium) (PAP) homopolymer ionomers.[ 37 , 38 , 39 , 40 ] Although only a few AEIs exhibit promising electrochemical properties, such as BTMA‐type poly(ethylene‐co‐tetrafluoroethylene) (BTMA‐ETFE) [14] and alkyl ammonium polyfluorene ionomers, [36] an important insight into AEIs still has not been well defined, such as the effects of water vapor permeability and phenyl content of AEIs.
Here, we present a series of 1,2‐diphenylethane (DP)‐containing poly(aryl piperidinium)s (PAP) for AEIs and AEMs. We propose incorporation of an aliphatic chain in the PAP backbone, intending to decrease the phenyl content of AEIs to naturally relieve phenyl adsorption issues and enhance the mechanical properties of PAP‐type AEMs. Rigid poly(fluorenyl‐co‐biphenyl piperidinium) (PFBP) was used as an AEI for comparison. [23] Different poly(diphenylethane‐co‐terphenyl piperidinium) (PDTP) AEPs were prepared for AEMs and AEIs. The IEC, water transport behavior, phenyl content, and single cell performance of PDTP‐based AEPs were systematically investigated to reveal their structure‐property relationships.
Results and Discussion
Polymer Synthesis and Characterization
Ratio of DP and terphenylene (TP) was controlled to synthesize poly(diphenyl‐terphenyl N,N‐dimethyl piperidinium) (PDTP‐x) by super acid condensation (see Figure 1), where x denotes the ratio of DP in PDTP‐x. The fluorine (FLN) ratio in poly(fluorenyl‐co‐biphenyl N,N‐dimethyl piperidinium) (PFBP) was fixed at 14 %. A detailed description of PFBP will be presented in our separate publication. [23] 1H NMR spectra of copolymers are presented in Figures S1 to S9, along with the detailed analysis. All PDTP‐x copolymers were obtained at high yield greater than 90 %. PDTP‐x copolymers exhibited a very high intrinsic viscosity ([η]) over 4.5 dL g−1 (see Table S1), indicating that PDTP‐x copolymers possess high molecular weight. Notably, compared to reported PAPs, only few polymers showed [η] values over 4 dL g−1. Accordingly, the present PDTP‐based AEMs display preferable mechanical toughness, film‐forming property, and low swelling ratio and thus can easily be fabricated into large‐area thin and transparent membranes (Figure S10).
Figure 1.

The synthesis routes of aliphatic chain and fluorine containing poly(aryl piperidinium)s.
Water and Gas Transport Behavior
Water transport behavior of AEIs and AEMs is crucial for water management in AEMFCs. The anode is likely to flood due to electrochemical water generation, while the cathode is inclined to dry‐out because of the electrochemical water consumption (Figure 2 a). Table S1 shows that a high DP ratio (or x) in PDTP‐x AEMs results in high IEC, liquid water uptake (WU), swelling ratio (SR), and hydration number (λ). PDTP‐x AEMs display significant difference in WU, SR, and λ. For example, the PDTP‐75 membrane exhibits large WU and λ (>179), while the PDTP‐25 membrane displays a moderate WU (≈121 %) and a low SR (≈30 %) at 80 °C. Dynamic vapor sorption (DVS) data revealed that the water sorption of swollen PDTP‐x membranes at low relative humidity (RH) was much lower than liquid WU values (Figure S11a), implying that AEPs with a large liquid WU still have possibility to use as AEIs. Water diffusivity of PDTP‐x membranes calculated from DVS is provided in Table S2.
Figure 2.

a) Schematic diagram of MEA with detailed three‐phase boundaries, b) H2 permeability, c) water vapor permeability of PDTP‐x and PFBP [23] AEMs in I− form at different RHs at 60 °C, and d) OH− conductivity of PDTP‐x at different RH values (0 %, ≈25 %, ≈50 %, ≈75 %, ≈100 %) at 60 °C.
In fact, three molecules‐H2, O2, and water‐are involved in the electrode reaction in AEMFCs. The gas permeability of PDTP‐x copolymers was systematically investigated at different RHs at 60 °C using a custom made gas permeability testing system and employing Barrer (where 1 Barrer=10−10 cm3(STP) cm cm−2 s−1 cm Hg−1) as the well‐known unit for permeability in the gas separation community.[ 41 , 42 ] Figure 2 b shows that the H2 permeability of PDTP‐x tends to decrease with increasing DP content. Humidified PDTP‐25 and PDTP‐50 membranes displayed lower H2 permeabilities (<10 Barrer) than those of commercial FAA‐3–50 (≈13 Barrer) and pristine PTP AEMs (≈10 Barrer), implying excellent fuel gas (H2) barrier properties, which ensure that they are gas tight during fuel cell operation. The H2 permeabilities of all membranes decreased at 18 % RH because water molecules blocked the micropores in the membranes. Thus, H2 permeability tended to increase with RH due to membrane swelling. This is a typical plasticization phenomenon in polymer membranes for gas transport. On the other hand, Figure 2 c indicates that the water permeability of PDTP‐x series (20 000–35 000 Barrer) increases with DP content, and this phenomenon is consistent with the water sorption and diffusion behavior in Figure S11a and Table S2. FLN‐containing PFBP exhibited higher water vapor permeability (>60 000 Barrer) than those of PDTP‐x series. Figure 2 d indicates that the ion‐conducting behavior of PDTP‐x AEMs at different RH values is similar to the water behavior.
Dynamic Mechanical, Morphological, and Ionic Conductivity Behaviors
PDTP‐x AEMs exhibited excellent tensile strength (TS) of 60–76 MPa and elongation at break (EB, 22–32 %) (Figure 3 a), and the values were higher than those of pristine PTP AEMs (TS: 59 MPa, EB: 29 %), indicating that the DP block enhances the strength of PAP AEMs. Also, the mechanical properties of PDTP‐x AEMs were much higher than those of the commercial FAA‐3–20 membrane (TS: 32 MPa, EB: ≈27 %), as expected. The PDTP‐50 membrane exhibited the highest TS (76 MPa) but a lower EB (22 %) compared to PDTP‐25 and PTP AEMs. However, PDTP‐50 membrane showed excessive WU and SR in OH− form, indicating that it is not suitable for AEMFC applications. The PDTP‐25 (TS: 61 MPa, EB: 32 %) had excellent dimensional stability and mechanical properties and was easily formed into a strong and thin membrane (Figure 3 b), making it a good candidate for AEMs. Dynamic mechanical analysis (DMA) revealed that PDTM‐x membranes exhibited a high storage modulus (E′) over 1900 MPa at 80 °C (Figure 3 c–f), indicating excellent dynamic mechanical properties. Meanwhile, the glass‐transition temperature (T g) of PDTM‐x membranes decreased with increasing DP content. The PDTM‐25, PDTM‐50, and PDTM‐75 membranes showed two T gs (T g1 at 270–290 °C and T g2 at 320–354 °C), and T g2 increasing with DP content. The PTP AEM only exhibited one T g. In PDTM membranes, T g1 likely is be due to the presence of the DP segment, while T g2 stems from the TP segment in the copolymers. Table 1 summarizes the thermal and mechanical properties of the representative AEMs in current research, showing that PDTP‐25 AEMs displayed outstanding tensile strength and storage modulus among current AEMs.[ 14 , 17 , 28 , 29 , 34 , 43 , 44 , 45 , 46 , 47 , 48 ]
Figure 3.

a) Mechanical properties of PDTP‐x (I− form) and commercial FAA‐3–20 (Cl− form) AEMs at wet state. b) Photograph of a transparent and strong PDTP‐25 membrane with a thickness of 25 μm. The storage modulus and tan δ c) PTM, d) PDTM‐25, e) PDTM‐50, and f) PDTM‐75 membranes.
Table 1.
Mechanical properties, storage modulus and T g of representative AEMs.
|
AEMs |
TS [MPa] |
EB [%] |
E′ [MPa] |
T g [°C] |
Refs |
|---|---|---|---|---|---|
|
PTP |
59 |
29 |
2200 |
394 |
✓ |
|
PDTP‐25 |
61 |
32 |
1980 |
295 |
✓ |
|
PDTP‐50 |
76 |
21 |
2500 |
284/348 |
✓ |
|
PDTP‐75 |
50 |
22 |
2000 |
274/323 |
✓ |
|
BTMA‐LDPE |
23 |
69 |
– |
– |
|
|
BTMA‐HDPE |
35 |
283 |
– |
– |
|
|
PTFE‐reinforced PNB |
– |
– |
553 |
– |
|
|
PAP‐TP‐85 |
67 |
117 |
– |
– |
|
|
QAPPT (OH−) |
≈35 |
≈40 |
– |
– |
|
|
m‐TPN |
≈30 |
≈35 |
– |
– |
|
|
XL100‐SEBS‐C5‐TMA‐0.8 |
7 |
≈350 |
– |
– |
|
|
PMP‐TMA‐41 |
≈3 |
≈46 |
– |
– |
|
|
PAImEE (Cl−) |
≈64 |
≈29 |
– |
– |
|
|
OBImPPO‐2.1 |
5.8 |
172 |
– |
– |
|
|
SPEEK‐S8 |
≈25 |
≈29 |
– |
– |
|
|
FAA‐3‐20 |
32 |
27 |
– |
– |
✓ |
–: not provided, ✓: this work.
Importantly, atomic force microscopic (AFM) images in Figure 4 a–d demonstrate that DP segments significantly improve the microphase separation of PDTP‐x AEMs. Dark regions in the AFM images denote ammonium and water‐containing hydrophilic phases, while the light‐yellow regions indicate polymer backbone‐aggregated hydrophobic phases. Notably, the hydrophilic phase width of PDTP‐x AEMs increased from 5.3 nm to 16.3 nm with increasing DP content. Combining T g behavior and morphology results, we conclude that PDTP‐75 and PDTP‐50 copolymers with two T g temperatures displayed larger hydrophilic channel width due to better microphase separation compared with PTP and PDTP‐25 copolymers.
Figure 4.

AFM images of PDTP‐x AEMs in I− form in the dry state: a) PTP, b) PDTP‐25, c) PDTP‐50, d) PDTP‐75. e) SEM images of a cross‐section of PDTP‐25 membrane. f) PDTP‐75 and PFBP ionomer solutions in IPA/DI water (10:1). g) A photograph of a PDTP‐based membrane electrode assembly (MEA).
Interestingly, the ion conductivity of PDTP‐x AEMs showed a similar phenomenon to the T g and microphase‐separated morphology behaviors. The OH− and HCO3 − conductivities of PDTP‐x AEMs tend to increase with increasing DP content at low RH and temperature, and these are much higher than that of pristine PTP AEMs (Figure 2 d and Figure S11b,c). This is attributed to higher IEC values and preferable microphase separation of PDTP‐x copolymers. The PDTP‐75 AEMs displayed the highest OH− conductivity of 158 mS cm−1 at 60 °C at 100 % RH (Figure 2 d), and the PDTP‐50 AEMs showed the highest HCO3 − conductivity of 118 mS cm−1 at 80 °C among these AEMs (Figure S11c). The activation energy (E) of PDTP‐x AEMs tends to decrease with increasing DP content, implying that the PDTP‐x AEMs possess the lower ion‐conducting barrier than PTP AEMs (Figure S11d). However, when the ratio of the DP segment is higher than 50 %, the PDTP‐75 AEMs exhibited excessive WU and SR which are detrimental to their ion conductivity. Consequently, the PDTP‐25 AEMs with excellent mechanical properties and reasonable SR (≈30 %) displayed a OH− conductivity of 166 mS cm−1 at 80 °C in liquid water, implying that PDTP‐25 is an excellent candidate for AEM applications. Thermogravimetric analysis (TGA) (Figure S12) indicated that these PDTP‐x copolymers (in I− form) are thermally stable below 190 °C.
Fuel‐Cell Performance
Ionomer effect: As noted above, water behavior is crucial for AEMFCs, and the anode and cathode experience a water imbalance. A thin PDTP‐25 membrane (25±3 μm, Figure 4 e) with excellent mechanical properties and dimensional stability was selected as an AEM, while three copolymers (PDTP‐25, PDTP‐75, and PFBP) with different water transport behaviors, IEC values, and phenyl contents were used as AEIs. For convenience, AEMFCs with different anode (A) and cathode (C) AEIs were labeled as “A/C AEIs”. All AEIs were soluble in isopropanol (IPA)/deionized (DI) water solution (Figure 4 f). A typical membrane electrode assembly (MEA) of PDTP‐x AEM with ionomer is shown in Figure 4 g.
As shown in Figure 5 a, PFBP/PDTP‐75 A/C AEIs exhibited the highest PPD of 0.97 W cm−2 at 80 °C without back pressure among the present cells. The PPD of PFBP/PDTP‐75 A/C AEIs was close to that of PFBP/PFBP A/C AEIs (0.96 W cm−2) but was significantly higher than the PDTP‐75/PDTP‐75 (0.72 W cm−2) and PDTP‐25/PDTP‐25 (0.7 W cm−2) A/C AEIs. On the other hand, PFBP/PDTP‐75 AEIs A/C AEIs displayed outstanding PPDs over 1.7 W cm−2 at 2.0/2.0 bar A/C back pressure (Figure 5 b). PFBP exhibited excellent cell performance for anode due to its high‐water permeability, while PDTP‐75 ionomer exhibited outstanding PPDs in the cathode because its large WU and low phenyl contents avoid the drying problem related to the cathode and decrease ionomer adsorption. On the other hand, PDTP‐25 and PDTP‐75 ionomers showed limited PPDs when used in the anode, and PDTP‐25 with low water vapor permeability, was detrimental to water back diffusion. In addition, PDTP‐75 ionomer with excessive WU was also not a good choice for the anode due to water flooding issues. [32] These results revealed that different properties of AEIs in the anode and/or cathode should be considered for optimizing the electrochemical reaction in AEMFCs.
Figure 5.
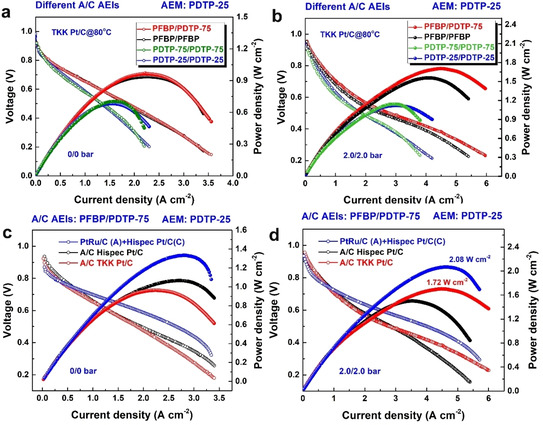
AEMFC performance with different A/C ionomers based on PDTP‐25 membrane (25±3 μm) at 80 °C at a 1000/1000 A/C H2/O2 flow rate and different A/C catalysts ((the composition of AEIs: total carbon: metal is 1:2:1.33 in Hipsec Pt/C‐based slurry, 1:1.78:1.55 in TKK Pt/C‐based slurry, and 1:1.33:2 in PtRu/C‐based slurry). a) A/C 0.26 mg cm−2 loading of TKK Pt/C, 0/0 bar A/C back pressure. b) A/C 0.26 mg cm−2 loading of TKK Pt/C, 0/0 bar A/C back pressure. 2.0/2.0 bar A/C back pressure. c) A/C PFBP/PDTP‐75 ionomers, 0/0 A/C back pressure, three types of A/C catalysts with 0.26 mg cm−2 catalyst loading: Pt‐Ru/C anode and Hispect Pt/C cathode, A/C Hispec Pt/C anode, and A/C TKK Pt/C. d) A/C PFBP/PDTP‐75 ionomers, 2.0/2.0 bar A/C back pressure, three types of A/C catalysts with 0.26 mg cm−2 catalyst loading: Pt‐Ru/C anode and Hispect Pt/C cathode, A/C Hispec Pt/C anode, and A/C TKK Pt/C.
Moreover, commercial FAA‐3–20 membrane and Fumion ionomer were used for comparison (Figure S13). Based on FAA‐3–20, PDTP‐75 and PFBP AEIs in the anode and cathode basically showed similar cell performance (PPDs: ≈0.8 W cm−2), while PDTP‐25/PDTP‐25 A/C AEIs exhibited limited PPDs (≈0.6 W cm−2) due to their low water permeability. On the other hand, these PFBP or PDTP‐x AEIs exhibited much higher PPDs than commercial Fumion ionomers (≈0.45 W cm−2).
AEMFC optimization: In light of the previously mentioned ionomer research, the RH effect on cell performance was systematically investigated (Figure S14) based on A/C TKK Pt/C catalysts without back pressure. Conditions of 75 %/100 % A/C RH were optimum for PFBP/PDTP‐75‐based fuel cells, which is not well matching with recent discovery due to different AEMs and AEIs.[ 15 , 50 ] On the other hand, PFBP/PDTP‐75 cells were more sensitive to gas flow rate compared to PFBP/PFBP fuel cells due to the large WU and SR of PDTP‐75 ionomer (Figure S15).
The effect of different catalyst species (Pt‐Ru/C, Hispec Pt/C, and TKK Pt/C) on the power density of PFBP/PDTP‐75 cells was investigated. Figure 5 c and d indicate that AEMFCs with a Pt‐Ru/C anode displayed outstanding PPDs compared with Pt/C‐containing fuel cells due to lower phenyl adsorption effects and a faster hydrogen oxidation reaction (HOR). [51] As shown in Figure S16, compared to Hispec Pt/C anode, TKK Pt/C anode shows limited PPDs without back pressure, but comparable or even higher PPDs after applying back pressure. We thought the difference between two types of Pt/C is related with their different carbon supports which impact the anode flooding. [35] The PPDs of Pt‐Ru/C‐based cells reached ≈1.4 W cm−2 and 2.08 W cm−2 with 0/0 bar and 2.0/2.0 bar A/C back pressure at 80 °C with a 0.26 mg cm−2 Pt‐Ru/C anode and a 0.26 mg cm−2 Pt/C cathode under H2‐O2 conditions, respectively. Pt‐Ru/C, Hispec Pt/C, and TKK Pt/C‐based fuel cells showed ≈54 %, 34 %, and 77 % improvement in PPDs after applying back pressure, respectively.
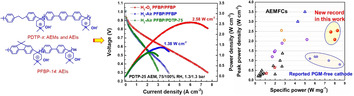
Importantly, the PPDs of the present AEMFCs were further improved to 2.58 W cm−2 at a limiting current density over 7.6 A cm−2 at 80 °C after increasing Pt‐Ru/C loading to 0.39 mg cm−2 and adjusting the ratio of AEIs, carbon, and metal catalyst, as shown in Figure 6 a. Moreover, the same AEMFCs reached a PPD of 1.38 W cm−2 under H2‐air (CO2 free) conditions. The present PPDs and limiting current densities reported here are the new record in current AEMs that are made without reinforcing support. Although few PTFE‐reinforced PNB membrane‐based AEMFCs can achieve PPDs higher than 3 W cm−2, these cells actually rely on high catalyst loadings greater than 0.7 mg cm−2, which increase their cost.
Figure 6.

a) AEMFC performance based on PDTP‐25 membrane (22±3 μm) and different A/C AEIs. Testing conditions: 0.39 mg cm−2 Pt‐Ru/C in the anode along with additional carbon powder (the ratio of AEIs: total carbon: Pt‐Ru is 1:2.33:2), 0.26 mg cm−2 Hispec Pt/C in the cathode (the ratio of AEIs: total carbon: metal is 1:2:1.33), 1000/1000 mL min−1 H2‐O2 flow rate, 1000/2000 mL min−1 H2‐air (CO2 free) flow rate, 1.3/1.3 bar back pressure. b) comparison of specific power and PPDs of present AEMFCs and current AEMFCs with A/C PGM catalysts. The specific power of reported AEMFCs with PGM‐free cathode was plotted for comparison. Red pentagon symbols denote the present work based on PDTP‐x and PFBP AEPs, red star symbols are commercial Fumion ionomer in this work, blue triangle symbols are PNB AEMs,[ 15 , 28 , 29 ] yellow hexagon symbols are polyethylene‐based AEMs,[ 13 , 14 ] violet pentagon symbols are polyphenylene and PAP AEMs,[ 34 , 35 , 36 , 37 , 43 , 49 ] black triangle symbols are other AEMs, including PPO, PSF, PBI, SEBS,[ 13 , 14 , 15 , 16 , 17 , 18 , 19 , 20 ] and blue star symbols are AEMFCs based on PGM‐free cathode.[ 6 , 11 , 52 , 53 ]
Figure 6 b summarizes the PPDs and specific power (S, S=PPD/the loading of PGM catalyst, W mg−1) of our cells compared to state‐of‐the‐art AEMFCs.[ 13 , 14 , 15 , 16 , 17 , 18 , 19 , 20 , 27 , 28 , 29 , 34 , 35 , 36 , 37 , 38 , 43 , 49 ] The specific power of the present AEMFCs (7.1 to 8.2 W mg−1) is significantly higher than that of current AEMFCs (≈5 W cm−1) based on A/C PGM catalysts. Moreover, compared to the state‐of‐the‐art AEMFCs with PGM‐free cathode, the present AEMFCs also exhibit comparable or even higher specific power, allowing the present AEIs and AEMs to achieve much higher AEMFC power with lower PGM catalyst loadings, indicating them as excellent candidates for future applications of low‐cost AEMFCs.
Ex‐Situ and In‐Situ Durability
The ex‐situ durability of the PDTP‐25 membrane was systematically investigated by monitoring the variation in chemical structure after alkaline exposure via 1H NMR spectroscopy. Figure S17 indicates no degradation of the PDTP‐25 membrane after alkaline treatment in 1 M NaOH at 80 °C over 1500 h. This implies that PDTP‐25 has excellent ex‐situ stability, contributed from the presence of highly‐stable dimethyl piperidinium (DMP) groups and an aryl ether‐free polymer backbone. However, DMP groups are sensitive to highly alkaline solution, and degradation of 19.2 % and 75.9 % of the DMP groups was observed in 5 M and 10 M NaOH at 80 °C after 1536 h, respectively (Figure S18 and Figure S19). The change in Br− conductivity of PDTP‐x AEMs during ex‐situ durability testing is shown in Figure S20.
Testing of in situ durability of PDTP‐x‐based fuel cells was performed under H2‐O2 conditions. Figure 7 a shows a slight voltage loss in the fuel cells in the initial 100 h under a 0.4 A cm−2 current density at 80 °C with a 200/200 mL min−1 H2‐O2 flow rate. In comparison, the commercial FAA‐3–20 membrane exhibited a rapid loss in cell voltage within 40 h under a 0.2 A cm−2 current density at 60 °C. We conducted an autopsy of MEA after in situ durability testing for 100 h and analyzed the chemical structures of AEMs and AEIs to study the relationship between ex‐situ and in situ durability. Figure 7 b indicates no degradation in DMP groups in the 1H NMR spectrum in the membrane from the anatomy of MEA, implying that the present AEMFCs possess promising durability for future applications. Some unidentified peaks around 4 ppm and 5 ppm belong to impurities. According to recent discoveries, the in situ durability of MEA is strongly dependent upon water management and fuel cell system optimization, and the cell voltage can be recovered after refreshing the MEA. Ongoing work is focusing on the long‐term durability of AEMFCs, and insight into in situ durability.
Figure 7.

a) In‐situ durability of PDTP‐25 membrane‐based cells under 0.4 A cm−2 current density at 80 °C, 200/200 mL min−1 flow rate, and 0.33 mg cm−2 loading of Hispec Pt/C, and in situ durability of commercial FAA‐3‐20 membrane‐based cells under a 0.2 A cm−2 current density at 60 °C with the same flow rate and catalysts with PDTP cells. b) 1H NMR spectra of PDTP‐25 membrane and PFBP/PDTP‐25 ionomers from the anatomy of MEA after in situ durability testing for 100 h. An 1H NMR spectrum of PDTP‐25 membrane before testing is presented for comparison.
Conclusion
In summary, we present a series of aliphatic chain‐containing PDTP‐x AEIs and AEMs for AEMFC applications. We found that PDTP‐75 with low phenyl content and high WU displayed outstanding PPDs when used as ionomers in the cathode, mainly due to the releasing of the dry‐out problems and ionomer adsorption issues. On the other hand, PDTP‐25 membranes exhibited excellent dimensional stability (SR≈30 %), gas barrier properties (H2 permeability <10 Barrier), good mechanical properties (TS>60 MPa, E′>1900 MPa), and high ion conductivity (>160 mS cm−1), indicating it as a good candidate for AEM applications. Combining optimum PDTP‐x AEIs and AEMs, the present AEMFCs showed PPDs of 2.58 W cm−2 and 1.38 W cm−2 under H2‐O2 and H2‐air (CO2 free), respectively, at 80 °C with a low catalyst loading (0.39 mg cm−2) after optimizing the fuel cell conditions. These PPD values are the highest so far among current AEMs without reinforecement. Importantly, the specific power (over 8 W mg−1) in this work is the highest record among current PGM‐based AEMFCs, exhibiting outstanding power and low‐cost advantages. The durability test reveals that PDTP‐25 AEM was stable in 1 M NaOH at 80 °C over 1500 h, and its H2‐O2 AEMFCs were almost stable under 0.4 A cm−2 at 80 °C over 100 h. Structural analysis of the anatomy of MEA after in situ durability testing indicated that the voltage loss of fuel cells was not due to degradation of AEIs or AEMs, but to undiagnosed water management. We believe that the present work timely contributes to current AEM and AEI research to promote development of AEMFCs.
Conflict of interest
The authors declare no conflict of interest.
Supporting information
As a service to our authors and readers, this journal provides supporting information supplied by the authors. Such materials are peer reviewed and may be re‐organized for online delivery, but are not copy‐edited or typeset. Technical support issues arising from supporting information (other than missing files) should be addressed to the authors.
Supplementary
Acknowledgements
This research was supported by the Technology Development Program to Solve Climate Change through the National Research Foundation of Korea (NRF) funded by the Ministry of Science and ICT (NRF‐2018M1A2A2061979) and by the Technology Innovation Program (20010955, Development of fuel cell module technology using polymer electrolyte membrane for hydrocarbon‐based fuel cell) funded by the Ministry of Trade, Industry & Energy (MOTIE) of South Korea.
N. Chen, C. Hu, H. H. Wang, S. P. Kim, H. M. Kim, W. H. Lee, J. Y. Bae, J. H. Park, Y. M. Lee, Angew. Chem. Int. Ed. 2021, 60, 7710.
References
- 1. Thompson S. T., Peterson D., Ho D., Papageorgopoulos D., J. Electrochem. Soc. 2020, 167, 084514. [Google Scholar]
- 2. Mustain W. E., Chatenet M., Page M., Kim Y. S., Energy Environ. Sci. 2020, 13, 2805–2838. [Google Scholar]
- 3. Park C. H., Lee S. Y., Hwang D. S., Shin D. W., Cho D. H., Lee K. H., Kim T. W., Kim T. W., Lee M., Kim D. S., Doherty C. M., Thornton A. W., Hill A. J., Guiver M. D., Lee Y. M., Nature 2016, 532, 480–483. [DOI] [PubMed] [Google Scholar]
- 4. Lee Y. M., Nat. Energy 2016, 1, 16136. [Google Scholar]
- 5. Zheng Y., Omasta T. J., Peng X., Wang L., Varcoe J. R., Pivovar B. S., Mustain W. E., Energy Environ. Sci. 2019, 12, 2806–2819. [Google Scholar]
- 6. Peng X., Omasta T. J., Magliocca E., Wang L., Varcoe J. R., Mustain W. E., Angew. Chem. Int. Ed. 2019, 58, 1046–1051; [DOI] [PMC free article] [PubMed] [Google Scholar]; Angew. Chem. 2019, 131, 1058–1063. [Google Scholar]
- 7. Meek K. M., Antunes C. M., Strasser D., Owczarczyka Z. R., Neyerlin A., and Pivovar B. S., ECS Trans. 2019, 92, 723–731. [Google Scholar]
- 8. Kim Y., Wang Y., France-Lanord A., Wang Y., Wu Y. M., Lin S., Li Y., Grossman J. C., Swager T. M., J. Am. Chem. Soc. 2019, 141, 18152–18159. [DOI] [PubMed] [Google Scholar]
- 9. Chen N. J., Lee Y. M., Prog. Polym. Sci. 2021, 113, 101345. [Google Scholar]
- 10. Lee K. H., Cho D. H., Kim Y. M., Moon S. J., Seong J. G., Shin D. W., Sohn J.-Y., Kim J. F., Lee Y. M., Energy Environ. Sci. 2017, 10, 275–285. [Google Scholar]
- 11. Miller H. A., Lavacchi A., Vizza F., Marelli M., Di Benedetto F., D'Acapito F., Paska Y., Page M., Dekel D. R., Angew. Chem. Int. Ed. 2016, 55, 6004–6007; [DOI] [PubMed] [Google Scholar]; Angew. Chem. 2016, 128, 6108–6111. [Google Scholar]
- 12. Shin D. W., Guiver M. D., Lee Y. M., Chem. Rev. 2017, 117, 4759–4805. [DOI] [PubMed] [Google Scholar]
- 13. Wang L., Brink J. J., Liu Y., Herring A. M., Ponce-González J., Whelligan D. K., Varcoe J. R., Energy Environ. Sci. 2017, 10, 2154–2167. [Google Scholar]
- 14. Wang L., Peng X., Mustain W. E., Varcoe J. R., Energy Environ. Sci. 2019, 12, 1575–1579. [Google Scholar]
- 15. Ul Hassan N., Mandal M., Huang G., Firouzjaie H. A., Kohl P. A., Mustain W. E., Adv. Energy Mater. 2020, 10, 2001986. [Google Scholar]
- 16. Chen N., Long C., Li Y., Lu C., Zhu H., ACS Appl. Mater. Interfaces 2018, 10, 15720–15732. [DOI] [PubMed] [Google Scholar]
- 17. Fan J., Willdorf-Cohen S., Schibli E. M., Paula Z., Li W., Skalski T. J. G., Sergeenko A. T., Hohenadel A., Frisken B. J., Magliocca E., Mustain W. E., Diesendruck C. E., Dekel D. R., Holdcroft S., Nat. Commun. 2019, 10, 2306. [DOI] [PMC free article] [PubMed] [Google Scholar]
- 18. Gu S., Cai R., Luo T., Chen Z., Sun M., Liu Y., He G., Yan Y., Angew. Chem. Int. Ed. 2009, 48, 6499–6502; [DOI] [PubMed] [Google Scholar]; Angew. Chem. 2009, 121, 6621–6624. [Google Scholar]
- 19. Zhang B., Gu S., Wang J., Liu Y., Herring A. M., Yan Y., RSC Adv. 2012, 2, 12683–12685. [Google Scholar]
- 20. Chen N., Zhu H., Chu Y., Li R., Liu Y., Wang F., Polym. Chem. 2017, 8, 1381–1392. [Google Scholar]
- 21. Zhu T., Xu S., Rahman A., Dogdibegovic E., Yang P., Pageni P., Kabir M. P., Zhou X. D., Tang C., Angew. Chem. Int. Ed. 2018, 57, 2388–2392; [DOI] [PubMed] [Google Scholar]; Angew. Chem. 2018, 130, 2412–2416. [Google Scholar]
- 22. You W., Padgett E., MacMillan S. N., Muller D. A., Coates G. W., Proc. Natl. Acad. Sci. USA 2019, 116, 9729–9734. [DOI] [PMC free article] [PubMed] [Google Scholar]
- 23.N. J. Chen, H. H. Wang, S. P. Kim, H. M. Kim, W. H. Lee, C. Hu, J. Y. Bae, E. S. Sim, Y-C Chung, J-H Jang, S. J. Yoo, Y. B. Zhuang, Y. M. Lee, Nat. Commun. 2021, submitted. [DOI] [PMC free article] [PubMed]
- 24. Olsson J. S., Pham T. H., Jannasch P., Adv. Funct. Mater. 2018, 28, 1702758. [Google Scholar]
- 25. Yang Z., Guo R., Malpass-Evans R., Carta M., McKeown N. B., Guiver M. D., Wu L., Xu T., Angew. Chem. Int. Ed. 2016, 55, 11499–11502; [DOI] [PubMed] [Google Scholar]; Angew. Chem. 2016, 128, 11671–11674. [Google Scholar]
- 26. Hu C., Zhang Q., Lin C., Lin Z., Li L., Soyekwo F., Zhu A., Liu Q., J. Mater. Chem. A 2018, 6, 13302–13311. [Google Scholar]
- 27. Gao X., Yu H., Qin B., Jia J., Hao J., Xie F., Shao Z., Polym. Chem. 2019, 10, 1894–1903. [Google Scholar]
- 28. Mandal M., Huang G., Hassan N. U., Peng X., Gu T., Brooks-Starks A. H., Bahar B., Mustain W. E., Kohl P. A., J. Electrochem. Soc. 2020, 167, 054501. [Google Scholar]
- 29. Huang G., Mandal M., Peng X., Yang-Neyerlin A. C., Pivovar B. S., Mustain W. E., Kohl P. A., J. Electrochem. Soc. 2019, 166, F637–F644. [Google Scholar]
- 30. Marino M. G., Kreuer K. D., ChemSusChem 2015, 8, 513–523. [DOI] [PubMed] [Google Scholar]
- 31. Fujimoto C., Kim D.-S., Hibbs M., Wrobleski D., Kim Y. S., J. Membr. Sci. 2012, 423–424, 438–449. [Google Scholar]
- 32. Peng X., Kulkarni D., Huang Y., Omasta T. J., Ng B., Zheng Y., Wang L., LaManna J. M., Hussey D. S., Varcoe J. R., Zenyuk I. V., Mustain W. E., Nat. Commun. 2020, 11, 3561. [DOI] [PMC free article] [PubMed] [Google Scholar]
- 33. Omasta T. J., Park A. M., LaManna J. M., Zhang Y., Peng X., Wang L., Jacobson D. L., Varcoe J. R., Hussey D. S., Pivovar B. S., Mustain W. E., Energy Environ. Sci. 2018, 11, 551–558. [Google Scholar]
- 34. Wang J., Zhao Y., Setzler B. P., Rojas-Carbonell S., Ben Yehuda C., Amel A., Page M., Wang L., Hu K., Shi L., Gottesfeld S., Xu B., Yan Y., Nat. Energy 2019, 4, 392–398. [Google Scholar]
- 35. Wang T., Shi L., Wang J., Zhao Y., Setzler B. P., Rojas-Carbonell S., Yan Y., J. Electrochem. Soc. 2019, 166, F3305–F3310. [Google Scholar]
- 36. Lee W.-H., Mohanty A. D., Bae C., ACS Macro Lett. 2015, 4, 453—457. [DOI] [PubMed] [Google Scholar]
- 37. Maurya S., Noh S., Matanovic I., Park E. J., Narvaez Villarrubia C., Martinez U., Han J., Bae C., Kim Y. S., Energy Environ. Sci. 2018, 11, 3283–3291. [Google Scholar]
- 38. Park E. J., Maurya S., Lee A. S., Leonard D. P., Li D., Jeon J. Y., Bae C., Kim Y. S., J. Mater. Chem. A 2019, 7, 25040–25046. [Google Scholar]
- 39. Maurya S., Lee A. S., Li D., Park E. J., Leonard D. P., Noh S., Bae C., Kim Y. S., J. Power Sources 2019, 436, 226866. [Google Scholar]
- 40. Li D., Park E. J., Zhu W., Shi Q., Zhou Y., Tian H., Lin Y., Serov A., Zulevi B., Baca E. D., Fujimoto C., Chung H. T., Kim Y. S., Nat. Energy 2020, 5, 378–385. [Google Scholar]
- 41. Choi J., Kim M.-H., Han J. Y., Chae J. E., Lee W. H., Lee Y. M., Lee S. Y., Jang J. H., Kim J. Y., Henkensmeier D., Yoo S. J., Sung Y.-E., Kim H.-J., J. Membr. Sci. 2018, 568, 67–75. [Google Scholar]
- 42. Kim S., Lee Y. M., Prog. Polym. Sci. 2015, 43, 1–32. [Google Scholar]
- 43. Peng H., Li Q., Hu M., Xiao L., Lu J., Zhuang L., J. Power Sources 2018, 390, 165–167. [Google Scholar]
- 44. Lee W.-H., Park E. J., Han J., Shin D. W., Kim Y. S., Bae C., ACS Macro Lett. 2017, 6, 566–570. [DOI] [PubMed] [Google Scholar]
- 45. Jeon J. Y., Park S., Han J., Maurya S., Mohanty A. D., Tian D., Saikia N., Hickner M. A., Ryu C. Y., Tuckerman M. E., Paddison S. J., Kim Y. S., Bae C., Macromolecules 2019, 52, 2139–2147. [Google Scholar]
- 46. Zhang M., Shan C., Liu L., Liao J., Chen Q., Zhu M., Wang Y., An L., Li N., ACS Appl. Mater. Interfaces 2016, 8, 23321–23330. [DOI] [PubMed] [Google Scholar]
- 47. Zhu Y., Ding L., Liang X., Shehzad M. A., Wang L., Ge X., He Y., Wu L., Varcoe J. R., Xu T., Energy Environ. Sci. 2018, 11, 3472–3479. [Google Scholar]
- 48. Han J., Wu Y., Pan J., Peng Y., Wang Y., Chen C., Pan Q., Xie B., Zhao N., Wang Y., Lu J., Xiao L., Zhuang L., Electrochim. Acta 2018, 291, 353–361. [Google Scholar]
- 49. Li Q., Peng H., Wang Y., Xiao L., Lu J., Zhuang L., Angew. Chem. Int. Ed. 2019, 58, 1442–1446; [DOI] [PubMed] [Google Scholar]; Angew. Chem. 2019, 131, 1456–1460. [Google Scholar]
- 50. Leonard D. P., Maurya S., Park E. J., Manriquez L. D., Noh S., Wang X., Bae C., Baca E. D., Fujimotoc C., Kim Y. S., J. Mater. Chem. A 2020, 8, 14135–14144. [Google Scholar]
- 51. Matanovic I., Chung H. T., Kim Y. S., J. Phys. Chem. Lett. 2017, 8, 4918–4924. [DOI] [PubMed] [Google Scholar]
- 52. Omasta T. J., Zhang Y., Park A. M., Peng X., Pivovar B., Varcoe J. R., Mustain W. E., J. Electrochem. Soc. 2018, 165, F710–F717. [Google Scholar]
- 53. Yang Y., Peng H., Xiong Y., Li Q., Lu J., Xiao L., DiSalvo F. J., Zhuang L., Abruña H. D., ACS Energy Lett. 2019, 4, 1251–1257. [Google Scholar]
Associated Data
This section collects any data citations, data availability statements, or supplementary materials included in this article.
Supplementary Materials
As a service to our authors and readers, this journal provides supporting information supplied by the authors. Such materials are peer reviewed and may be re‐organized for online delivery, but are not copy‐edited or typeset. Technical support issues arising from supporting information (other than missing files) should be addressed to the authors.
Supplementary