

Abstract
Objective
In an ongoing effort to identify the genetic variation that contributes to obesity in American Indians, known Bardet–Biedl syndrome (BBS) genes were analyzed for an effect on BMI and leptin signaling.
Methods
Potentially deleterious variants (Combined Annotation Dependent Depletion score > 20) in BBS genes were identified in whole‐exome sequence data from 6,851 American Indians informative for BMI. Common variants (detected in ≥ 10 individuals) were analyzed for association with BMI; rare variants (detected in < 10 individuals) were analyzed for mean BMI of carriers. Functional assessment of variants’ effect on signal transducer and activator of transcription 3 (STAT3) activity was performed in vitro.
Results
One common variant, rs59252892 (Thr549Ile) in BBS9, was associated with BMI (P = 0.0008, β = 25% increase per risk allele). Among rare variants for which carriers had severe obesity (mean BMI > 40 kg/m2), four were in BBS9. In vitro analysis of BBS9 found the Ile allele at Thr549Ile had a 20% increase in STAT3 activity compared with the Thr allele (P = 0.01). Western blot analysis showed the Ile allele had a 15% increase in STAT3 phosphorylation (P = 0.006). Comparable functional results were observed with Ser545Gly and Val209Leu but not Leu665Phe and Lys810Glu.
Conclusions
Potentially functional variants in BBS genes in American Indians are reported. However, functional evidence supporting a causal role for BBS9 in obesity is inconclusive.
Study Importance.
What is already known?
-
►
American Indians are disproportionally affected by obesity, and obesity has a genetic component.
-
►
Variants in several genes known to cause rare forms of monogenic disease have also been shown to contribute to polygenic obesity, such as the genes known to contribute to Bardet–Biedl syndrome (BBS).
What does this study add?
-
►
This study provides information on potentially functional BBS variants detected in whole‐exome sequence data on 6,851 American Indians, with several rare variants found only among individuals with the most severe obesity.
-
►
Among the common variants, only rs59252892 in BBS9 showed a statistical association with BMI, and in vitro assessment indicated that the effect on BMI may be explained by altered leptin signaling.
How might these results change the direction of research?
-
►
Overall, variants in known BBS genes are not a major contributor to obesity among American Indians; however, variation in BBS9 may have a very modest effect.
-
►
Our in vitro studies indicate that the relationship between the chronic effects of BBS impairment (leptin transport to the cell surface and subsequent signaling) and the development of obesity may be complicated, and future in vivo mouse models of impaired BBS9 should be pursued.
Introduction
American Indians living in the Southwestern United States suffer from a high prevalence of obesity (1), yet much of what is known about the genetic underpinnings of obesity has come from the Genetic Investigation of ANthropometric Traits (GIANT) (https://portals.broadinstitute.org/collaboration/giant) and UK Biobank (https://www.ukbiobank.ac.uk/) databases, which do not include this ethnic group. Although obesity in American Indians, as in other ethnic groups, is typically polygenic in nature, we are systematically analyzing the possible contribution of known monogenic obesity genes. For example, missense variation in the melanocortin‐4 receptor gene (MC4R) is the most common cause of monogenic obesity in humans, yet we have previously found that 2.4% of an American Indian community in Arizona carries one of several rare functional coding mutations in MC4R (2). The leptin‐melanocortin pathway is critical for the hypothalamic control of food intake, where MC4R mutations have led to hyperphagia and obesity (3, 4). Bardet–Biedl syndrome (BBS) is another well‐characterized monogenic disease with at least 21 causal genes that all function in primary cilia (5), and some can play a role in the leptin‐melanocortin pathway. Obesity is the predominant clinical feature of BBS, and individuals manifesting the full syndrome through recessive inheritance can also present with polydactyly, rod‐cone dystrophy, kidney abnormalities, and developmental delay (6). However, heterozygous carriers of BBS mutations have an increased risk of developing obesity but typically lack the other syndromic characteristics (7). Therefore, it is possible that variation in BBS genes may similarly contribute to polygenic obesity in this American Indian population. The leading mechanism by which BBS mutations can lead to obesity is through altered localization of key metabolic receptors in hypothalamic neurons. Multiple BBS proteins (BBS1, BBS2, BBS4, BBS5, BBS7, BBS8, BBS9, and BBS18) compose a complex called the BBSome, which mediates protein trafficking to the cilia surface (8). Both the leptin receptor (LEPR) and neuropeptide Y receptor type 2, which contribute to anorexigenic signaling, are shuttled to the cell surface by the BBSome (8, 9, 10). Therefore, the objective of this study was to (1) identify variants in known BBS genes that are likely to be functional and to statistically associate with BMI or, if rare, that occur in individuals with severe obesity and (2) assess the impact of these variants on an obesity‐related pathway.
Methods
Participants
Participants were from two research protocols of health among American Indians conducted by the National Institute of Diabetes and Digestive and Kidney Diseases (NIDDK) in Phoenix, Arizona. One of these studies was a community‐based, longitudinal study (conducted from 1965 to 2007) of American Indians (11), and the other study is an ongoing study (2011 to the present) of American Indians living in urban Phoenix (12). For participants with longitudinal clinical and anthropometric measures, we defined BMI as the participant’s maximum BMI recorded at an examination at age ≥ 15 years. For the urban Indian cohort, maximum BMI at age ≥ 15 years was self‐reported. In total 6,851 participants had whole‐exome sequence (WES) data and were informative for BMI (6,002 from the longitudinal, community‐based cohort and 849 from the urban American Indian study; combined participants were 43.0% male, mean [SD] age at maximum BMI = 32.5 [12.8] years; mean [SD] maximum BMI = 36.4 [8.8] kg/m2). Given that the population BMI average is high, we used the Centers for Disease Control and Prevention severe obesity definition of BMI ≥ 40 as a cutoff to focus on variation that may have the greatest genetic penetrance. All participants gave written informed consent before participation in the study. The study protocols were approved by the review board of the NIDDK and/or by the Phoenix Area Indian Health Service Institutional Review Board.
Whole‐Exome Sequencing
WES was performed by the Regeneron Genetics Center (Tarrytown, New York) as previously described (13). Sequence data were aligned to the reference human genome (hg38), and > 85% of target regions had 20× coverage.
Statistical analysis
Statistical analysis was performed using SAS version 9.4 (SAS Institute Inc., Cary, North Carolina) and SOLAR (Sequential Oligogenic Linkage Analysis Routines, University of Maryland, Baltimore, Maryland) for variants with a Combined Annotation Dependent Depletion (CADD) score > 20 and ≥ 10 carriers out of the 6,851 samples. For the longitudinal protocol participants, BMI association was analyzed by a linear mixed model fitted with a variance components covariance structure to account for genetic relatedness among individuals to avoid bias. The genetic relatedness matrix was estimated as the proportion of the genome shared identical by descent as previously described (14). BMI association from the self‐reported data was analyzed by linear regression, and genomic control was used to account for population structure (15). Meta‐analysis across both data sets using a fixed‐effects inverse variance method was performed for the final BMI association results. P values were adjusted for age, sex, birth year, and the first five genetic principal components. The resulting individual variants across all BBS genes from the meta‐analysis were considered significant after Bonferroni correction (P < 0.05/N deleterious variants). To identify a gene‐level association with BMI, the Meta‐Analysis of Gene‐level Association (MAGA) software was used with Sequence Kernel Association Test statistics (16).
Functional analyses of five nonsynonymous BBS9 variants
Expression vectors containing full‐length human myc‐DDK‐tagged LEPR and BBS9 were obtained from Origene (Rockville, Maryland). The QuikChange Lightning Site‐Directed Mutagenesis Kit (Agilent Technologies, Santa Clara, California) was used to create five different BBS9 (NM_198428) constructs with the following amino acid substitutions: exon7:c.G625T:p.V209L, exon16:c.A1633G:p.S545G, exon16:c.C1646T:p.T549I, exon19:c.C1993T:p.L665F, and exon21:c.A2428G:p.K810E. All constructs were confirmed by sequencing.
HEK‐293 (American Type Culture Collection, Manassas, Virginia) and mouse N42 hypothalamus cell lines (Cellutions Biosystems Inc., Burlington, North Carolina) were each maintained in Dulbecco’s modified Eagle's medium (DMEM; Gibco, Gaithersburg, Maryland) containing 4.5 g/L of glucose, 1.5 g/L of sodium bicarbonate, 10% fetal bovine serum (FBS), and 1% penicillin‐streptomycin in 5% CO2 and 95% air atmosphere at 37°C. To assess the effects of BBS9 variants on LEPR, cells were cotransfected with 500 ng of a BBS9 construct, 500 ng of LEPR, and 500 ng of the reporter mixture of signal transducer and activator of transcription 3 (STAT3)‐mediated firefly luciferase construct and constitutively expressed Renilla luciferase construct (40:1) (Qiagen, Hilden, Germany) using Lipofectamine LTX (Invitrogen, Carlsbad, California). Twenty‐four hours following transfection, cells were serum starved for 6 hours in Opti‐MEM (Thermo Fisher, Waltham, Massachusetts) with 0.5% FBS, then 100 ng/mL of recombinant human leptin (L4146; Sigma Aldrich, St. Louis, Missouri) was added to the medium for 18 hours prior to harvest. For total protein harvest, cells were serum starved 30 hours following transfection in Opti‐MEM with 0.5% FBS for 18 hours, then 100 ng/mL of recombinant human leptin (L4146) was added to the medium for 30 minutes prior to harvest.
Luciferase activity was measured in duplicate on a TD‐20/20 luminometer (Turner BioSystems, Sunnyvale, California) using the Dual‐Luciferase assay kit (Promega, Madison, Wisconsin) per manufacturer’s instructions. Relative luciferase activity was calculated as a ratio of the firefly to Renilla luciferase activity to control for transfection efficiency and further normalized to the leptin‐treated transfection containing the BBS9 wild‐type (WT) vector. The data from four (N42 cells) or five (HEK‐293 cells) separate transfections were averaged and then normalized to the BBS9 WT. The difference in activity was compared with the BBS9 WT using a one‐sample t test.
To further confirm the effects of BBS9 variants on LEPR‐mediated STAT3 phosphorylation, Western blot analysis was performed to detect pSTAT3 using phospho‐STAT3 (Tyr705) antibody (Cell Signaling, Danvers, Massachusetts) and normalized to total STAT3 (124H6) (Cell Signaling). The signal intensity was scanned on a ChemiDoc Touch Imaging System (Bio‐Rad, Hercules, California) and quantified using Image Lab software (version 5.2.1, Bio‐Rad). Data from three (HEK‐293 cells) independent experiments were averaged and then normalized to the BBS9 WT. The difference in activity was compared with the BBS9 WT using a one‐sample t test.
Serum leptin measures
Serum leptin was measured using the Human Leptin Quantikine ELISA Kit (R&D Systems, Minneapolis, Minnesota) per the manufacturer’s instructions.
Results
Association analysis of potentially damaging BBS variants
Analysis of WES data identified 1,308 variants (Supporting Information Table S1) in the 21 BBS genes (ADP ribosylation factor like GTPase 6 [ARL6], BBSome interacting protein 1 [BBIP1], BBS1, BBS10, BBS12, BBS2, BBS4, BBS5, BBS7, BBS9, chromosome 8 open reading frame 37 [C8orf37], centrosomal protein 290 [CEP290], intraflagellar transport 172 [IFT172], intraflagellar transport 27 [IFT27], leucine zipper transcription factor like 1 [LZTFL1], McKusick‐Kaufman syndrome [MKKS], Meckel syndrome type 1 [MKS1], serologically defined colon cancer antigen 8 [SDCCAG8], tripartite motif containing 32 [TRIM32], tetratricopeptide repeat domain 8 [TTC8], and WD repeat containing planar cell polarity effector [WDPCP]), of which 235 variants had a CADD score > 20 (top 1% most likely to be deleterious). Among these potentially deleterious variants which had ≥ 10 carriers (N = 50; Supporting Information Table S2) in the 6,851 participants, only the Thr549Ile (rs59252892) variant in BBS9 significantly associated with BMI (significance requires a Bonferroni‐corrected P < 0.001). For this variant, the mean BMI of the 13 Ile‐allele carriers was 42.8 (SD 12.6) kg/m2 versus 36.3 (SD 8.8) kg/m2 for noncarriers (P = 0.0008, β = 0.23 on loge scale, which corresponds to a 25% increase in BMI per copy of the risk allele; Figure 1).
Figure 1.
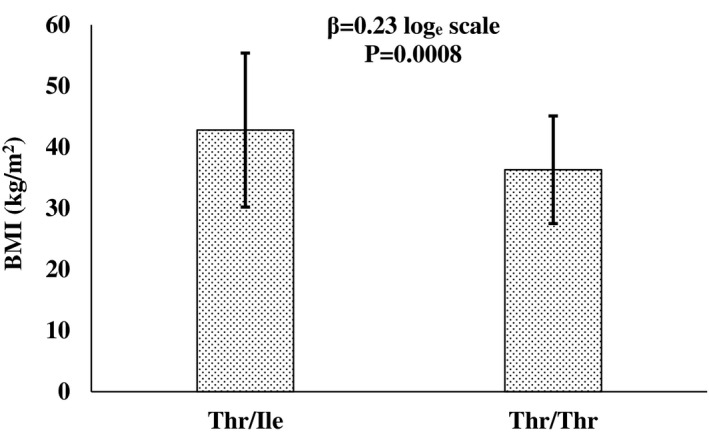
Association of BBS9 variant rs59252892 (Thr549Ile) and BMI. Bars represent the mean ± SD for the 13 Thr/Ile heterozygotes and 6,838 Thr/Thr homozygotes. The beta (β) loge scale corresponds to a 25% increase in BMI per copy of the risk allele. P values were adjusted for age, sex, birth year, and the first five genetic principal components.
Characterization of carriers with uncommon potentially damaging BBS variants
A total of 185 variants were detected that had a CADD > 20 but occurred in < 10 carriers. Because these variants are too rare to provide robust statistical analysis, we identified those variants that were restricted to participants who met criteria for severe obesity (defined as a mean BMI for the variant carriers [e.g., 1‐9 carriers] of ≥ 40 kg/m2). Information on these 39 variants is given in Table 1; all carriers were heterozygous. Among these variants, no individual was homozygous or was a compound heterozygote. One individual with a rare variant in a BBS gene also carried a I269N variant in their MC4R gene; this individual was excluded from Table 1 because of confounding effects of MC4R on severe obesity status.
TABLE 1.
Rare variants with a CADD score > 20 in known BBS genes, in which the mean BMI of carriers meets the threshold for severe obesity (≥ 40 kg/m2)
| Gene | Position | Variant ID | Ref/Alt | Variation type | Carriers (n) | Carrier mean BMI (kg/m2) | CADD score |
|---|---|---|---|---|---|---|---|
| BBS9 | chr7:33534083 | novel | A/G | K810E | 3 | 51.0 ± 10.6 | 26.6 |
| chr7:33388022 | rs116262072 | C/T | L665F | 5 | 43.1 ± 6.5 | 25.0 | |
| chr7:33264297 | novel | G/T | V209L | 6 | 43.2 ± 3.8 | 25.0 | |
| chr7:33357935 | novel | A/G | S545G | 1 | 41.0 ± 0 | 21.8 | |
| BBS12 | chr4:122742092 | rs767546051 | G/A | G67E | 1 | 42.2 ± 0 | 25.2 |
| chr4:122742965 | novel | T/C | L358P | 1 | 40.3 ± 0 | 26.8 | |
| IFT172 | chr2:27465860 | rs764302265 | C/T | R572Q | 1 | 59.0 ± 0 | 26.2 |
| chr2:27453711 | rs755179952 | C/T | R1247H | 1 | 45.0 ± 0 | 25.7 | |
| chr2:27457715 | novel | T/C | H1051R | 1 | 42.0 ± 0 | 25.7 | |
| chr2:27478063 | rs755816980 | G/A | R367C | 1 | 48.0 ± 0 | 23.2 | |
| chr2:27471067 | rs375640327 | G/C | S518C | 1 | 45.0 ± 0 | 23.4 | |
| chr2:27461450 | novel | T/C | E754G | 4 | 40.0 ± 7.9 | 23.3 | |
| chr2:27470935 | rs61743977 | G/C | T562S | 9 | 40.3 ± 8.9 | 21.7 | |
| chr2:27481109 | novel | C/T | R241Q | 1 | 40.3 ± 0 | 23.5 | |
| TTC8 | chr14:88872339 | novel | G/T | D412Y | 1 | 50.0 ± 0 | 29.9 |
| CEP290 | chr12:88130283 | rs863225185 | A/C | Stopgain | 2 | 40.7 ± 2.5 | 36.0 |
| chr12:88087886 | rs188502327 | C/T | R1363Q | 1 | 58.2 ± 0 | 26.6 | |
| chr12:88060900 | rs191613017 | A/G | L2151S | 5 | 44.3 ± 7.1 | 28.2 | |
| chr12:88114508 | novel | A/C | L655W | 2 | 48.6 ± 14.6 | 27.2 | |
| chr12:88093829 | rs372918770 | G/C | R1084G | 3 | 50.0 ± 12.0 | 32.0 | |
| chr12:88080352 | rs377143954 | C/T | E1686K | 1 | 42.3 ± 0 | 21.2 | |
| chr12:88093829 | rs372918770 | G/C | R1084G | 3 | 45.4 ± 4.9 | 22.9 | |
| chr12:88141277 | rs185939120 | T/C | M11V | 1 | 43.7 ± 0 | 23.2 | |
| BBS4 | chr15:72709757 | novel | G/A | R45Q | 1 | 48.3 ± 0 | 22.7 |
| chr15:72731341 | rs34620165 | G/A | G250R | 1 | 49.7 ± 0 | 24.0 | |
| WDPCP | chr2:63487446 | rs187135801 | C/T | Splice donor | 1 | 52.0 ± 0 | 33.0 |
| chr2:63259334 | rs760742250 | C/T | D471N | 2 | 41.0 ± 6.5 | 24.7 | |
| chr2:63404381 | rs769112221 | G/A | R368C | 1 | 50.0 ± 0 | 23.5 | |
| chr2:63439871 | rs191796211 | G/C | L129V | 1 | 56.0 ± 0 | 22.0 | |
| chr3:97788082 | rs148745414 | T/G | C148G | 1 | 66.9 ± 0 | 20.8 | |
| TRIM32 | chr9:116699580 | rs199704873 | G/A | R613Q | 2 | 43.0 ± 6.2 | 22.8 |
| BBS1 | chr11:66514413 | novel | T/C | V56A | 2 | 48.6 ± 3.2 | 24.5 |
| chr11:66514544 | rs769949890 | C/T | R100W | 1 | 40.4 ± 0 | 26.6 | |
| chr11:66530954 | rs369653969 | C/A | R512S | 1 | 40.4 ± 0 | 20.4 | |
| IFT27 | chr22:36762906 | rs780844069 | C/T | V154M | 1 | 42.0 ± 0 | 31 |
| chr22:36775708 | rs143443220 | G/A | 5’UTR | 1 | 58.2 ± 0 | 20.9 | |
| BBS2 | chr16:56485706 | rs758343294 | T/C | Y648C | 2 | 47.2 ± 16.4 | 24.8 |
| BBS5 | chr2:169493769 | rs137853921 | A/G | N184S | 4 | 40.2 ± 8.8 | 25.7 |
“Carriers (n)” represents the number of heterozygous carriers for the alternative allele. Because of longitudinal measures of BMI for most participants, BMI is defined as the maximum BMI measured at an examination at age ≥ 15 years.
CADD, Combined Annotation Dependent Depletion score; Ref/Alt, reference and alternative alleles.
BBS9 is prioritized for further study
Among the common variation detected in the BBS genes, only the Thr594Ile variant in BBS9 provided statistical evidence for an effect on BMI. BBS9 also had four uncommon variants detected solely in individuals with severe obesity (Table 1). Therefore, only BBS9 was further studied both functionally and statistically for a potential role in obesity.
BMI and serum leptin levels in pedigrees informative for Thr594Ile in BBS9
Pedigree information was available for 8 of the 13 Ile‐allele carriers for the Thr594Ile variant in BBS9 (Figure 2). Among full or half siblings, BMI values appeared to segregate by genotype of Thr549Ile, such that Ile carriers had a higher maximum BMI compared with their noncarrier sibling. For example, in Family A, the second‐generation Ile carriers had BMI of 41 or 35 kg/m2, whereas the noncarrier sibling had BMI of 22 kg/m2. Furthermore, serum leptin was measured in available Ile‐allele carrier and noncarrier family members. Although women typically have higher leptin levels than men, all Ile‐allele carriers had elevated leptin levels compared with their noncarrier siblings when adjusted by age and sex (P = 0.028, β = 17.7 ng/mL higher in the risk allele carriers). In Figure 2, this can be best observed in the second generation of Family B, in which male and female Ile‐allele carriers all had leptin levels > 20 ng/mL compared with noncarriers that had < 10 ng/mL.
Figure 2.
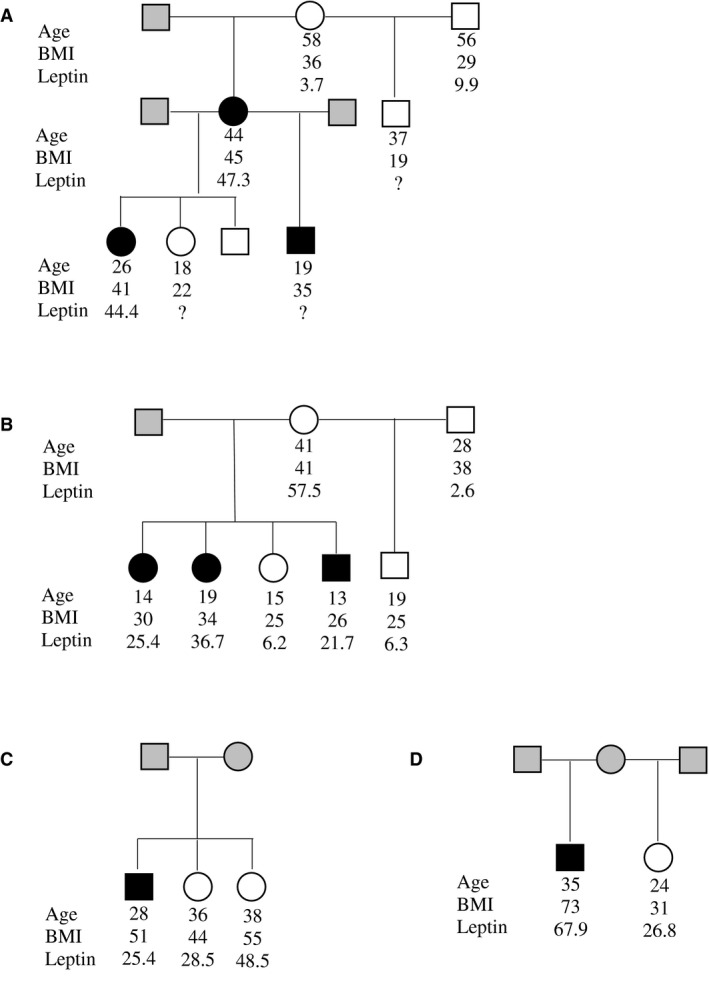
BBS9 Thr549Ile carrier pedigrees. The black symbols in the pedigrees are heterozygous carriers at Thr549Ile; the white symbols are homozygous at Thr549Thr; the gray symbols are genotype unknown. Maximum BMI (kg/m2), age at maximum BMI, and serum leptin (ng/mL) measures are shown for each participant, if known.
BBS9 variants alter STAT3 activity in leptin signaling
The Thr549Ile and four rare nonsynonymous variants in BBS9 listed in Table 1 were studied for an effect on leptin signaling using a luciferase reporter assay to detect STAT3 transcriptional activity (Figure 3). In HEK‐293 cells, the obesity risk allele (Ile) at Thr549Ile had a 20% increase in leptin signaling activity compared with the nonrisk Thr allele (P = 0.01). Similarly, the obesity risk allele (Gly) at Ser545Gly had a 24% increase in leptin signaling activity compared with the nonrisk Ser allele (P = 0.02). A slightly more subtle change was identified for the Val209Leu variant, in which there was a 13% increase in signaling for the obesity risk allele (Leu) compared with the nonrisk Val allele (P = 0.004). No significant changes were identified for the Leu665Phe and Lys810Glu variants in BBS9. The luciferase reporter assay was repeated in the N42 hypothalamus cell line, and a similar trend was observed for all variants, but only Thr549Ile showed a significant difference (P = 0.01) between the two alleles. Western blot analyses to detect the phosphorylated STAT3 mediated by leptin signaling were conducted for both the Thr549Ile and Ser545Gly variants because they each presented a ≥ 20% change in luciferase activity between alleles. Results for both showed a similar increase in leptin signaling in which the Ile allele at Thr549Ile had a 15% increase in STAT3 phosphorylation compared with the Thr allele (P = 0.006) and the Gly allele at Ser545Gly had an 18% increase in STAT3 phosphorylation compared with the Ser allele (P = 0.07) (Figure 4).
Figure 3.
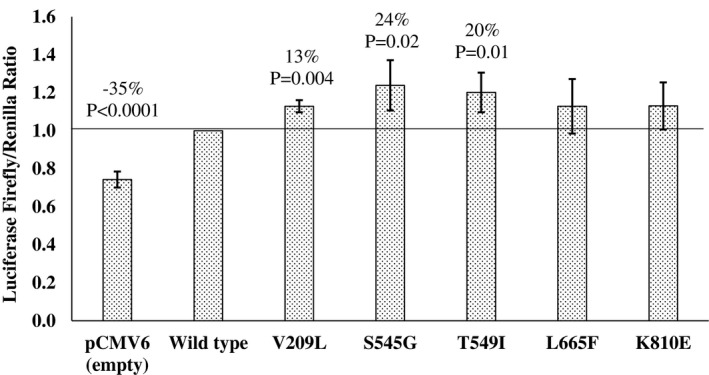
The effect of the BBS9 variants on STAT3 transcription in HEK293 cells by an in vitro luciferase activity assay. Each bar represents the mean ± SD of luciferase activity, normalized to the leptin‐treated (100 ng/mL) BBS9 WT from five independent experiments. Significant changes (%) in activity from the BBS9 WT were determined by a one‐sample t test. WT, wild type.
Figure 4.
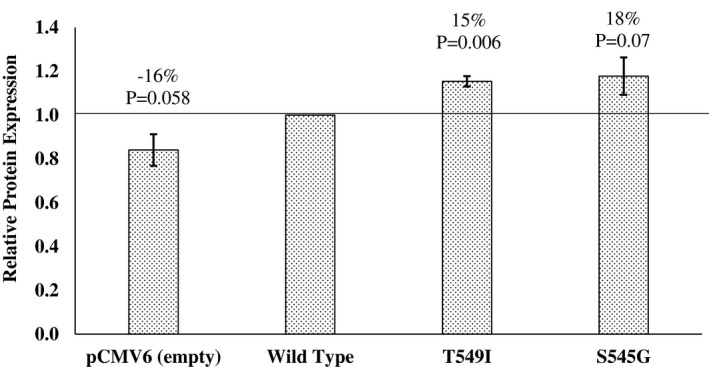
The effect of the BBS9 variants on STAT3 phosphorylation in HEK293 cells by Western blot analyses. Each bar represents the mean ± SD of signal intensity normalized to the leptin‐treated BBS9 WT; derived from three independent experiments. Significant changes (%) in activity from the BBS9 WT were determined by a one‐sample t test. WT, wild type.
BBS9 gene‐level analysis
Two rare variants, Ser545Gly and a Val209Leu (with only one and six carriers, respectively), in our WES sample provided some experimental evidence of affecting leptin levels. Therefore, we sought to determine whether a gene‐based association test of all potentially damaging uncommon variants could lend statistical support for BBS9 having a role in determining BMI. All 26 variants in BBS9 with a CADD > 20 and a minor allele frequency (MAF) < 0.05 were analyzed using a gene‐based meta‐analysis (variants shown in bold in Supporting Information Table S1). However, a Sequence Kernel Association Test analysis did not provide statistical support that multiple rare variants in BBS9 affect obesity (P = 0.3).
Discussion
BBS gene variants have previously been linked to obesity (17, 18). More recently, studies have shown that obesity can arise through the loss of BBSome subunits, which impairs LEPR trafficking and leads to leptin resistance (8). The present study identified a Thr549Ile variant (rs59252892) in BBS9 that significantly associated with BMI (P = 0.0008). Although the allele frequency of rs59252892 was uncommon in our study of American Indians (MAF = 0.001), it is much rarer in individuals of European descent (MAF = 0.00008 in the Exome Aggregation Consortium; http://exac.broadinstitute.org). Therefore, it was unexpected that this Thr549Ile variant was detected in one individual in a prior WES study of only 30 Caucasian individuals, but this may be explained by the fact that all of the 30 Caucasians had extreme obesity (18). This prior study also concluded that Thr549Ile was contributing to the obesity in this individual. Our result, as well as this prior finding, support the hypothesis that BBS9, the central component of the BBSome, could affect the transporting capabilities of the protein that may play a role in development of obesity (19).
Our in vitro functional analyses of five BBS9 variants indicate that the BMI risk alleles at Val209Leu, Ser545Gly, and Thr549Ile appear to increase leptin signaling, possibly because of increased LEPR shuttling to the cell surface. The findings of increased leptin signaling in obesity seem to contradict the conventional mechanism of LEPR deficiency causing obesity. However, several studies have been focused on balanced leptin signaling for normal function (20, 21, 22). Zhao et al. had performed a transgenic manipulation of leptin production in obese mice on a high‐fat diet and had shown that (1) a subtle reduction of circulating leptin reduced body fat, (2) near‐complete absence of leptin increased body fat, and (3) overexpression of leptin increased body fat (22). In a study by Gamber et al., overexpression of LEPR in mice led to increased food intake and weight gain under a high‐fat diet (21). Furthermore, these mice became resistant to STAT3 activation and had increased suppressor of cytokine signaling 3 (Socs3) expression levels. It is proposed that increased LEPR at the surface causes overactivity of the signaling pathway, leading to leptin resistance. Here, our study has found increased leptin signaling for obesity‐associated BBS9 variants. Therefore, it is conceivable to suggest that these BBS9 variants cause a subtle increase in the shuttling of LEPR to the plasma membrane, which, over time, leads to leptin resistance.
The relationship between leptin levels and body weight may also vary over time. For example, a recently published study assessed the effect of hyperleptinemia at various developmental stages on the body weight of mice (23). They found that mice with leptin overexpression at birth initially displayed reduced body weight but that they were more prone to high‐fat‐diet‐induced obesity at later developmental stages than the control littermates. Therefore, our population of American Indians, who on average have high BMI in adulthood, may be showing a similar effect.
Our in vitro reporter assay enabled sensitive detection for a subtle change. However, we acknowledge potential limitations. First, cell lines were useful in identifying alterations in leptin signaling from BBS9 variants in an acute state. But to fully investigate whether these variants directly link to leptin resistance, a mouse model may provide more insight into the chronic impact. Second, our study assessed the downstream effects of leptin signaling but did not directly quantify surface LEPR levels. Therefore, additional studies are required to further confirm long‐term mechanistic effects of BBS9 variants on LEPR surface levels. In conclusion, we have used WES data in a longitudinally studied American Indian community to identify potentially functional missense variants in BBS genes that potentially contribute to obesity. BBS variants have been recognized along with LEPR/proopiomelanocortin (POMC) deficiencies as rare genetic disorders of obesity and have been included in a clinical trial (NCT03013543) using an MC4R agonist developed to restore impaired pathway function. These developments suggest an important role of BBS gene function in the leptin‐melanocortin pathway. However, we did not find conclusive functional evidence that supports BBS9 variants as a contributor to polygenic obesity in this American Indian population, warranting further studies.
Funding agencies
This work was supported by the intramural research program of the National Institute of Diabetes and Digestive and Kidney Diseases, National Institutes of Health.
Disclosure
The authors declared no conflict of interest.
Supporting information
Table S1
Table S2
Acknowledgments
We thank the clinical staff of the Phoenix Epidemiology and Clinical Research Branch, NIDDK, for collecting data for use in this study. We also thank all study participants. This study used the computational resources of the Biowulf system at the National Institutes of Health, Bethesda, MD. The opinions expressed in this paper are those of the authors and do not necessarily reflect the views of the Indian Health Service.
References
- 1. Knowler WC, Pettitt DJ, Saad MF, et al. Obesity in the Pima Indians: its magnitude and relationship with diabetes. Am J Clin Nutr 1991;53:1543S‐1551S. [DOI] [PubMed] [Google Scholar]
- 2. Thearle MS, Muller YL, Hanson RL, et al. Greater impact of melanocortin‐4 receptor deficiency on rates of growth and risk of type 2 diabetes during childhood compared with adulthood in Pima Indians. Diabetes 2012;61:250‐257. [DOI] [PMC free article] [PubMed] [Google Scholar]
- 3. Huvenne H, Dubern B, Clement K, Poitou C. Rare genetic forms of obesity: clinical approach and current treatments in 2016. Obes Facts 2016;9:158‐173. [DOI] [PMC free article] [PubMed] [Google Scholar]
- 4. Stutzmann F, Tan K, Vatin V, et al. Prevalence of melanocortin‐4 receptor deficiency in Europeans and their age‐dependent penetrance in multigenerational pedigrees. Diabetes 2008;57:2511‐2518. [DOI] [PMC free article] [PubMed] [Google Scholar]
- 5. Vaisse C, Reiter JF, Berbari NF. Cilia and obesity. Cold Spring Harb Perspect Biol 2017;9:a028217. doi: 10.1101/cshperspect.a028217 [DOI] [PMC free article] [PubMed] [Google Scholar]
- 6. Forsythe E, Gunay‐Aygun M. Bardet‐Biedl syndrome overview. In: Adam MP, Ardinger HH, Pagon RA, et al, eds. GeneReviews. University of Washington; 1993. ‐2021. https://www.ncbi.nlm.nih.gov/books/NBK1363/ [Google Scholar]
- 7. Stryjecki C, Alyass A, Meyre D. Ethnic and population differences in the genetic predisposition to human obesity. Obes Rev 2018;19:62‐80. [DOI] [PubMed] [Google Scholar]
- 8. Guo D‐F, Cui H, Zhang Q, et al. The BBSome controls energy homeostasis by mediating the transport of the leptin receptor to the plasma membrane. PLoS Genet 2016;12:e1005890. doi: 10.1371/journal.pgen.1005890 [DOI] [PMC free article] [PubMed] [Google Scholar]
- 9. Loktev AV, Jackson PK. Neuropeptide Y family receptors traffic via the Bardet‐Biedl syndrome pathway to signal in neuronal primary cilia. Cell Rep 2013;5:1316‐1329. [DOI] [PubMed] [Google Scholar]
- 10. Guo D‐F, Lin Z, Wu Y, et al. The BBSome in POMC and AgRP neurons is necessary for body weight regulation and sorting of metabolic receptors. Diabetes 2019;68:1591‐1603. [DOI] [PMC free article] [PubMed] [Google Scholar]
- 11. Knowler WC, Bennett PH, Hamman RF, Miller M. Diabetes incidence and prevalence in Pima Indians: a 19‐fold greater incidence than in Rochester, Minnesota. Am J Epidemiol 1978;108:497‐505. [DOI] [PubMed] [Google Scholar]
- 12. Olaiya MT, Hanson RL, Kavena KG, et al. Use of graded Semmes Weinstein monofilament testing for ascertaining peripheral neuropathy in people with and without diabetes. Diabetes Res Clin Pract 2019;151:1‐10. [DOI] [PMC free article] [PubMed] [Google Scholar]
- 13. Williams RC, Knowler WC, Shuldiner AR, et al. Next generation sequencing and the classical HLA loci in full heritage Pima Indians of Arizona: defining the core HLA variation for North American Paleo‐Indians. Hum Immunol 2019;80:955‐965. [DOI] [PubMed] [Google Scholar]
- 14. Hsueh W‐C, Nair AK, Kobes S, et al. Identity‐by‐descent mapping identifies major locus for serum triglycerides in Amerindians largely explained by an APOC3 founder mutation. Circ Cardiovasc Genet 2017;10:e001809. doi: 10.1161/CIRCGENETICS.117.001809 [DOI] [PMC free article] [PubMed] [Google Scholar]
- 15. Devlin B, Bacanu SA, Roeder K. Genomic control to the extreme. Nat Genet 2004;36:1129‐1130. [DOI] [PubMed] [Google Scholar]
- 16. Hu Y‐J, Berndt S, Gustafsson S, et al. Meta‐analysis of gene‐level associations for rare variants based on single‐variant statistics. Am J Hum Genet 2013;93:236‐248. [DOI] [PMC free article] [PubMed] [Google Scholar]
- 17. Khan SA, Muhammad N, Khan MA, Kamal A, Rehman ZU, Khan S. Genetics of human Bardet‐Biedl syndrome, an updates. Clin Genet 2016;90:3‐15. [DOI] [PubMed] [Google Scholar]
- 18. Mariman ECM, Vink RG, Roumans NJT, et al. The cilium: a cellular antenna with an influence on obesity risk. Br J Nutr 2016;116:576‐592. [DOI] [PubMed] [Google Scholar]
- 19. Klink BU, Zent E, Juneja P, Kuhlee A, Raunser S, Wittinghofer A. A recombinant BBSome core complex and how it interacts with ciliary cargo. Elife 2017;6:e27434. doi: 10.7554/eLife.27434 [DOI] [PMC free article] [PubMed] [Google Scholar]
- 20. LeDuc CA, Leibel RL. Auto‐regulation of leptin neurobiology. Cell Metab 2019;30:614‐616. [DOI] [PMC free article] [PubMed] [Google Scholar]
- 21. Gamber KM, Huo L, Ha S, Hairston JE, Greeley S, Bjorbaek C. Over‐expression of leptin receptors in hypothalamic POMC neurons increases susceptibility to diet‐induced obesity. PLoS One 2012;7:e30485. doi: 10.1371/journal.pone.0030485 [DOI] [PMC free article] [PubMed] [Google Scholar]
- 22. Zhao S, Zhu YI, Schultz RD, et al. Partial leptin reduction as an insulin sensitization and weight loss strategy. Cell Metab 2019;30:706‐719.e706. [DOI] [PMC free article] [PubMed] [Google Scholar]
- 23. Skowronski AA, LeDuc CA, Foo KS, et al. Physiological consequences of transient hyperleptinemia during discrete developmental periods on body weight in mice. Sci Transl Med 2020;12:eaax6629. doi: 10.1126/scitranslmed.aax6629 [DOI] [PMC free article] [PubMed] [Google Scholar]
Associated Data
This section collects any data citations, data availability statements, or supplementary materials included in this article.
Supplementary Materials
Table S1
Table S2