

Abstract
Objective
To use unbiased, data‐driven, principal component (PC) and cluster analysis to identify patient phenotypes of rheumatoid arthritis (RA) that might exhibit distinct trajectories of disease progression, response to treatment, and risk for adverse events.
Methods
Patient demographic, socioeconomic, health, and disease characteristics recorded at entry into a large, single‐center, prospective observational registry cohort, the Brigham and Women’s Rheumatoid Arthritis Sequential Study (BRASS), were harmonized using PC analysis to reduce dimensionality and collinearity. The number of PCs was established by eigenvalue >1, cumulative variance, and interpretability. The resulting PCs were used to cluster patients using a K‐means approach. Longitudinal clinical outcomes were compared between the clusters over 2 years.
Results
Analysis of 142 variables from 1,443 patients identified 41 PCs that accounted for 77% of the cumulative variance in the data set. Cluster analysis distinguished 5 patient clusters: 1) less RA disease activity/multimorbidity, shorter RA duration, lower incidence of comorbidities; 2) less RA disease activity/multimorbidity, longer RA duration, more infections, psychiatric comorbidities, health care utilization; 3) moderate RA disease activity/multimorbidity, more neurologic comorbidity; 4) more RA disease activity/multimorbidity, shorter RA duration, more metabolic comorbidity, higher body mass index; 5) more RA disease activity/multimorbidity, longer RA duration, more hepatic, orthopedic comorbidity and RA‐related surgeries. The clusters exhibited differences in clinical outcomes over 2 years of follow‐up.
Conclusion
Data‐driven analysis of the BRASS registry identified 5 distinct phenotypes of RA. These results illustrate the potential of data‐driven patient profiling as a tool to support personalized medicine in RA. Validation in an independent data set is ongoing.
INTRODUCTION
The identification of each patient’s needs and how best to meet them is a prerequisite for giving the right treatment to the right patient. Recognizing how individual needs fit into identifiable patient subgroups can help clinicians better personalize treatment decisions for each patient. In rheumatoid arthritis (RA), evolving classification by expert consensus has enabled development of treatment progression algorithms informed by disease duration, disease activity, and prior response to therapies (1, 2). Further advances in identifying patient subgroups with predictable disease and treatment response trajectories are needed to achieve goals of precision medicine in RA, such as personalized treatment sequencing and personalized strategies to achieve and maintain disease remission (3).
SIGNIFICANCE & INNOVATIONS.
Data‐driven principal component (PC) and cluster analysis has the potential to identify previously unrecognized patient phenotypes to help establish prognosis, predict disease trajectory, and inform treatment in rheumatoid arthritis (RA).
Five patient clusters identified by PC and cluster analysis of variables recorded on entry into an RA registry showed distinct patterns of clinical outcome over 2 years of follow‐up.
The results suggest that the clusters represent clinically meaningful phenotypes of RA and illustrate the potential of data‐driven patient profiling as a tool to support personalized medicine in RA.
Emerging techniques of cluster analysis permit the empirical exploration of large, complex data sets without imposition of bias and allow a quasi‐agnostic selection of variables to be considered in determining unrecognized patient subgroups who may subsequently share commonality in trajectories of disease progression, response to therapy, or risk of adverse events (4). These data‐driven approaches can identify previously unrecognized patterns in data sets, with the potential to inform prognosis and treatment decisions (5).
In RA, data‐driven approaches have been used to classify patients using a range of data sources, including synovial gene expression and histologic features (6, 7, 8), whole blood gene expression (9), and electronic medical records (10, 11). A similar approach has been used to interrogate a registry of patients with RA with linkage to administrative data to identify predictors for hospitalization and cost outcomes (12).
In this study, we used unbiased, data‐driven, empirical techniques of principal component (PC) and cluster analysis to support the classification of patients and investigate longitudinal clinical outcomes over 2 years of follow‐up in a large, single‐center, prospective observational registry cohort, the Brigham and Women’s Rheumatoid Arthritis Sequential Study (BRASS; NCT01793103). The aim was to identify previously unrecognized patient phenotypes that may have different trajectories of disease progression, different responses to treatment, and different risks for adverse events.
MATERIALS AND METHODS
The BRASS registry is a single‐center, prospective observational cohort of patients with RA attending the Brigham and Women’s Arthritis Center in Boston, Massachusetts (13). Patients were screened for eligibility using the International Classification of Diseases, Ninth Revision, followed by rheumatologist diagnosis, and met the American College of Rheumatology RA classification criteria current at the time. Eligible patients were sent an invitation to participate by mail, and their rheumatologists repeated the invitation during a clinic visit. The study protocol was developed according to the principles of the Declaration of Helsinki and approved by the Partners Institutional Review Board at Brigham and Women’s Hospital. All patients provided written informed consent. Patient data were collected from self‐administered patient questionnaires, physician reports, radiographs, and blood samples, as described previously (13). Data were not collected from electronic health records or administrative records. Patients in BRASS are followed in the clinic at least annually and are sent questionnaires 6 months into the intervening period.
PCs analysis (PCA)
PCA aims to reduce the dimensionality of large data sets by identifying factors (i.e., PCs) that underlie observed variables to facilitate interpretability of the data, while preserving as much information as possible (14, 15). Each PC represents a set of weighted (loaded) variables, with a patient’s score for that PC being the sum of each constituent weighted variable (5). PCA is conducted stepwise such that the first PC accounts for maximal variability in the data set, and each succeeding PC accounts for maximal remaining variability and is uncorrelated (i.e., orthogonal) to previous PCs (16). To optimize interpretability, PCs were rotated using the varimax method, which reduces the number of variables represented in each PC and more evenly distributes the share of variance between PCs (14).
PCA was applied to baseline (enrollment) data for all patients enrolled in BRASS. Administrative (e.g., initials of the doctor completing the physician form), free text, highly missing, and redundant variables were removed. New variables were aggregated from relevant fields; e.g., the variable “metabolic comorbidity ever” was aggregated from the BRASS fields “non‐RA medicine” and “ever disease” using the medication terms glipizide, glyburide, insulin, and metformin, and disease terms including diabetes mellitus, obesity, and hyperlipidemia. Methods for data preprocessing and imputation are provided in Supplementary Appendix A, available on the Arthritis Care & Research website at http://onlinelibrary.wiley.com/doi/10.1002/acr.24471/abstract. PCA was conducted using SAS, version 9.4. To optimize the number of variables, the analysis was performed iteratively by excluding variables with loading values <0.30 and repeating the process with a slightly higher cutoff each time until all variables had loading of ~0.40 or greater. The final number of PCs was determined according to eigenvalue >1, cumulative variance ≥0.70, and interpretability; in general, each variable was allowed to load onto a single PC only.
Cluster analysis
The final PCs were used to identify patient clusters by K‐means clustering using SAS (17). The minimum cluster size was 5% of the population. Multiple random initial centroids were run to find convergence (maximum iteration 100), and the distance of centroids was determined by Euclidean distance and minimized sum of squared error, with initial distance (radius) of centroids (r = 2). The final number of clusters was determined based on 2 different measures of between‐cluster variance: pseudo F (the ratio of between‐cluster variance to within‐cluster variance) and cubic clustering criterion (CCC). Visual inspection of these 2 measures graphed across different numbers of clusters was used to identify the optimal confluence (agreement) between the measures. Confluence at relatively low cluster number was preferred to high cluster number to avoid potential overfitting. The average value of each PC (PC score) was calculated for each cluster, representing the cluster’s center along that PC’s axis.
Longitudinal outcomes
All patients with ≥1 postbaseline assessment were included in longitudinal outcomes analyses. Mean scores were calculated as observed cases, without imputation for missing values, for annual physician‐assessed scores of the Clinical Disease Activity Index (CDAI), the Disease Activity Score in 28 joints using the C‐reactive protein level (DAS28‐CRP), the Simplified Disease Activity Index (SDAI), the Rheumatoid Arthritis Disease Activity Index (RADAI), swollen joint count, tender joint count, patient self‐reported (questionnaire) number of flares, the 5‐item Mental Health Index, the Multidimensional Health Assessment Questionnaire (MDHAQ), and the global status question of the MDHAQ. Arthritis Pain Today (0–10 visual analog scale) was used for the patient global assessment component in CDAI, SDAI, and DAS28‐CRP scores. Kaplan‐Meier plots were used for time to events for biannual patient questionnaire outcomes of infection (“Have you experienced an infection requiring antibiotics in the past 6 months?”) and change in RA medication.
RESULTS
Study population
All 1,443 patients enrolled in BRASS as of November 13, 2015 were included in the PC and cluster analysis. Median age at entry into BRASS was 57.0 years (range 18–91 years), 82% of patients were women, median duration of RA was 8.5 years (range 0–65 years), mean ± SD CDAI score was 19.6 ± 16.6, and mean ± SD DAS28‐CRP score was 3.7 ± 1.7. In total, 862 patients (60%) were recruited from 2003 to 2004, and 581 patients (40%) were recruited from 2005 to 2015. Demographic, RA disease, and RA treatment characteristics are provided in the last column of Table 1, and general health and socioeconomic characteristics in the last column of Table 2.
Table 1.
Demographic, rheumatoid arthritis (RA) disease, and RA treatment characteristics at entry into the Brigham and Women’s Rheumatoid Arthritis Sequential Study (BRASS)*
| Characteristic |
Cluster 1 (n = 691) |
Cluster 2 (n = 280) |
Cluster 3 (n = 174) |
Cluster 4 (n = 108) |
Cluster 5 (n = 190) |
Overall BRASS population (n = 1,443) |
|---|---|---|---|---|---|---|
| RA disease activity/multimorbidity† | Less | Less | Moderate | More | More | |
| RA duration† | Shorter | Longer | Moderate | Shorter | Longer | |
| Median age (range), years | 55 (20–86) | 57 (22–89) | 55 (18–86) | 60 (18–84) | 64 (23–91) | 57 (18–91) |
| Female | 548 (79) | 231 (83) | 157 (90) | 87 (81) | 165 (87) | 1,188 (82) |
| Race | ||||||
| Asian | 2 (<1) | 4 (1) | 2 (1) | 1 (1) | 2 (1) | 11 (1) |
| African American | 26 (4) | 12 (4) | 7 (4) | 19 (18) | 6 (3) | 70 (5) |
| White | 632 (91) | 261 (93) | 163 (94) | 85 (79) | 177 (93) | 1,318 (91) |
| Other | 31 (4) | 3 (1) | 2 (1) | 3 (3) | 5 (3) | 44 (3) |
| Median duration of RA (IQR), years | 5 (12) | 11 (18) | 9 (14) | 8 (17) | 22 (20) | 8.5 (20) |
| CDAI score, mean ± SD | 18.1 ± 16.0 | 17.2 ± 16.3 | 21.8 ± 16.7 | 23.0 ± 17.5 | 25.2 ± 16.7 | 19.6 ± 16.6 |
| CDAI score ≤2.8 (remission)‡ | 111 (16) | 49 (18) | 13 (7) | 8 (7) | 10 (5) | 191 (13) |
| CDAI score ≤10 (low disease activity)‡ | 298 (43) | 130 (46) | 63 (36) | 30 (28) | 45 (24) | 566 (39) |
| DAS28‐CRP score, mean ± SD | 3.5 ± 1.6 | 3.5 ± 1.7 | 3.8 ± 1.6 | 4.0 ± 1.6 | 4.2 ± 1.6 | 3.7 ± 1.7 |
| Subcutaneous nodules in last year | 105 (15) | 47 (17) | 32 (18) | 22 (20) | 66 (35) | 272 (19) |
| Sjögren’s syndrome in last year | 48 (7) | 42 (15) | 26 (15) | 8 (7) | 41 (22) | 165 (11) |
| Current RA medications | ||||||
| NSAIDs§ | 387 (56.0) | 178 (63.6) | 106 (60.9) | 66 (61.1) | 121 (63.7) | 858 (59.5) |
| csDMARDs§ | 503 (72.8) | 199 (71.1) | 123 (70.7) | 71 (65.7) | 134 (70.5) | 1,030 (71.4) |
| TNF inhibitors§ | 253 (36.6) | 87 (31.1) | 59 (33.9) | 35 (32.4) | 79 (41.6) | 513 (35.6) |
| Non‐TNF bDMARDs§ | 6 (0.9) | 22 (7.9) | 6 (3.4) | 3 (2.8) | 3 (1.6) | 40 (2.8) |
| Steroids | 190 (27.5) | 85 (30.4) | 56 (32.2) | 31 (28.7) | 72 (37.9) | 434 (30.1) |
| Opioids | 47 (6.8) | 38 (13.6) | 34 (19.5) | 27 (25) | 29 (15.3) | 175 (12.1) |
Values are the number (%) unless indicated otherwise. bDMARD = biologic and targeted disease‐modifying antirheumatic drug; CDAI = Clinical Disease Activity Index; csDMARD = conventional synthetic DMARD; DAS28‐CRP = Disease Activity Score in 28 joints using the C‐reactive protein level; IQR = interquartile range; NSAID = nonsteroidal antiinflammatory drug; TNF = tumor necrosis factor.
RA disease activity/multimorbidity relative to BRASS cohort average; RA duration relative to the cluster with matching RA disease activity/multimorbidity.
Percentage based on number of patients with assessment.
RA medication categories are defined in Supplementary Table 7, available on the Arthritis Care & Research website at http://onlinelibrary.wiley.com/doi/10.1002/acr.24471/abstract.
Table 2.
Health and socioeconomic characteristics at entry into the Brigham and Women’s Rheumatoid Arthritis Sequential Study (BRASS)*
| Characteristic |
Cluster 1 (n = 691) |
Cluster 2 (n = 280) |
Cluster 3 (n = 174) |
Cluster 4 (n = 108) |
Cluster 5 (n = 190) |
Overall BRASS population (n = 1,443) |
|---|---|---|---|---|---|---|
| RA disease activity/multimorbidity† | Less | Less | Moderate | More | More | |
| RA duration† | Shorter | Longer | Moderate | Shorter | Longer | |
| BMI | 26.5 ± 5.3 | 26.1 ± 4.8 | 26.3 ± 5.8 | 32.0 ± 7.6 | 26.6 ± 5.6 | 26.8 ± 5.6 |
| Charlson Comorbidity Index | 1.60 ± 0.93 | 1.85 ± 1.06 | 2.02 ± 1.12 | 3.26 ± 1.54 | 2.46 ± 1.55 | 1.94 ± 1.22 |
| CV comorbidity (ever), no. (%) | 324 (47) | 158 (56) | 93 (53) | 91 (84) | 129 (68) | 795 (55) |
| Metabolic comorbidity (ever), no. (%) | 3 (<1) | 1 (<1) | 3 (2) | 108 (100) | 2 (1) | 117 (8) |
| Orthopedic comorbidity (ever), no. (%) | 38 (5) | 14 (5) | 33 (19) | 22 (20) | 167 (88) | 274 (19) |
| Neurologic comorbidity (ever), no. (%) | 40 (6) | 24 (9) | 174 (100) | 27 (25) | 15 (8) | 280 (19) |
| Current smoker, no. (%) | 44 (6) | 17 (6) | 21 (12) | 9 (8) | 12 (6) | 103 (7) |
| Pack‐years‡ | 29.3 ± 20.3 | 32.9 ± 22.5 | 20.9 ± 13.2 | 22.4 ± 18.5 | 33.9 ± 17.1 | 28.1 ± 19.2 |
| Ever smoker, no. (%) | 283 (41) | 115 (41) | 75 (43) | 51 (47) | 89 (47) | 613 (42) |
| Exercise, hours per week | 2.0 ± 2.8 | 2.6 ± 3.4 | 1.9 ± 2.5 | 1.4 ± 2.3 | 1.6 ± 2.3 | 2.0 ± 2.8 |
| Income, thousands USD | 61 | 58 | 57 | 49 | 51 | 58 |
| Married, no. (%)§ | 479 (69) | 177 (63) | 110 (63) | 58 (54) | 117 (62) | 941 (65) |
| Support from friends/relatives per week | 5.9 ± 5.4 | 4.1 ± 5.0 | 5.3 ± 5.5 | 5.1 ± 5.5 | 6.1 ± 5.2 | 5.5 ± 5.4 |
| Number of doctor visits in last 6 months¶ | ||||||
| PCP | 0.30 ± 0.71 | 0.74 ± 0.97 | 0.45 ± 0.84 | 0.52 ± 0.88 | 0.18 ± 0.57 | 0.40 ± 0.80 |
| Rheumatologist | 0.45 ± 0.84 | 0.88 ± 0.99 | 0.53 ± 0.88 | 0.63 ± 0.93 | 0.24 ± 0.65 | 0.53 ± 0.88 |
Values are the mean ± SD unless indicated otherwise. BMI = body mass index; CV = cardiovascular; PCP = primary care physician; RA = rheumatoid arthritis; USD = US dollars.
RA disease activity/multimorbidity relative to BRASS cohort average; RA duration relative to the cluster with matching RA disease activity/multimorbidity.
Pack = 20 cigarettes.
Living with spouse or significant other.
Not counting the enrollment visit.
Results of PCA
From the 2,105 variables obtainable at enrollment, 1,428 administrative, free text, highly missing, or redundant variables were removed. The remaining set of 677 variables was reduced to 167 by aggregating related variables (see Supplementary Table 1, available on the Arthritis Care & Research website at http://onlinelibrary.wiley.com/doi/10.1002/acr.24471/abstract). These 167 variables were entered into the PCA process, which produced 49 PCs with eigenvalue >1 in the first run. During the iterative exclusion of low‐loading variables, further refinement was driven by selecting a loading threshold informed by MDHAQ functionality score. This feature of the data was selected as the reference because in past studies it typically correlated with RA disease trajectories (18). Its loading value on the first PC fluctuated around 0.40. The final number of PCs was 41, all with eigenvalue >1.0, collectively incorporating 142 variables, each with loading ≥0.39, including MDHAQ score, which had loading 0.39 in the final analysis (see Supplementary Figure 1A and Supplementary Table 2, available on the Arthritis Care & Research website at http://onlinelibrary.wiley.com/doi/10.1002/acr.24471/abstract). The 41 PC constructs together accounted for 77% of the cumulative variance in the data set. Variables with insufficient loading for inclusion in the final set of PCs included age, sex, CRP level, and employment status (see Supplementary Table 3, available on the Arthritis Care & Research website at http://onlinelibrary.wiley.com/doi/10.1002/acr.24471/abstract). On investigating the omission of these variables by forcing their inclusion, we found that the cumulative variance accounted for declined from 77% to 76%, owing to the numerator (variance explained) not increasing as much as the denominator (total variance). The interpretation of these variables’ omission in the data‐driven process is that these variables (loading <0.39) might be meaningful in separating patients with RA as standalone variables, but their contribution was overshadowed by related variables. For example, CRP level as a standalone variable was below the threshold for inclusion because its effects were already included in the PC disease activity, which included CRP level in the DAS28‐CRP score. Similarly, the contribution of age and sex as standalone variables was attenuated because of the incorporation of other variables correlated with age and sex already included in PCs. Generally, each PC identified related characteristics, with some exceptions (see Supplementary Table 2, available on the Arthritis Care & Research website at http://onlinelibrary.wiley.com/doi/10.1002/acr.24471/abstract; PC 3: number of doctor visits, community groups, and family history of myocardial infarction). For brevity, PC 3 is hereafter designated “health care utilization.”
Results of cluster analysis
Cluster analysis distinguished 5 patient clusters at a pseudo F of 28.45 and CCC of 24.26 (see Supplementary Figure 1B, available on the Arthritis Care & Research website at http://onlinelibrary.wiley.com/doi/10.1002/acr.24471/abstract). The clusters were well separated (see Supplementary Figure 2 and Supplementary Table 4, available at http://onlinelibrary.wiley.com/doi/10.1002/acr.24471/abstract), and each reflected a distinctive profile of PCs (Figure 1). Owing to the introduction of new biologic therapies in 2010 during the BRASS enrollment period, subanalyses were conducted for patients enrolled before and after 2010. These showed negligible effect on cluster identification. Variables related to time had only a marginal role in defining clusters.
Figure 1.
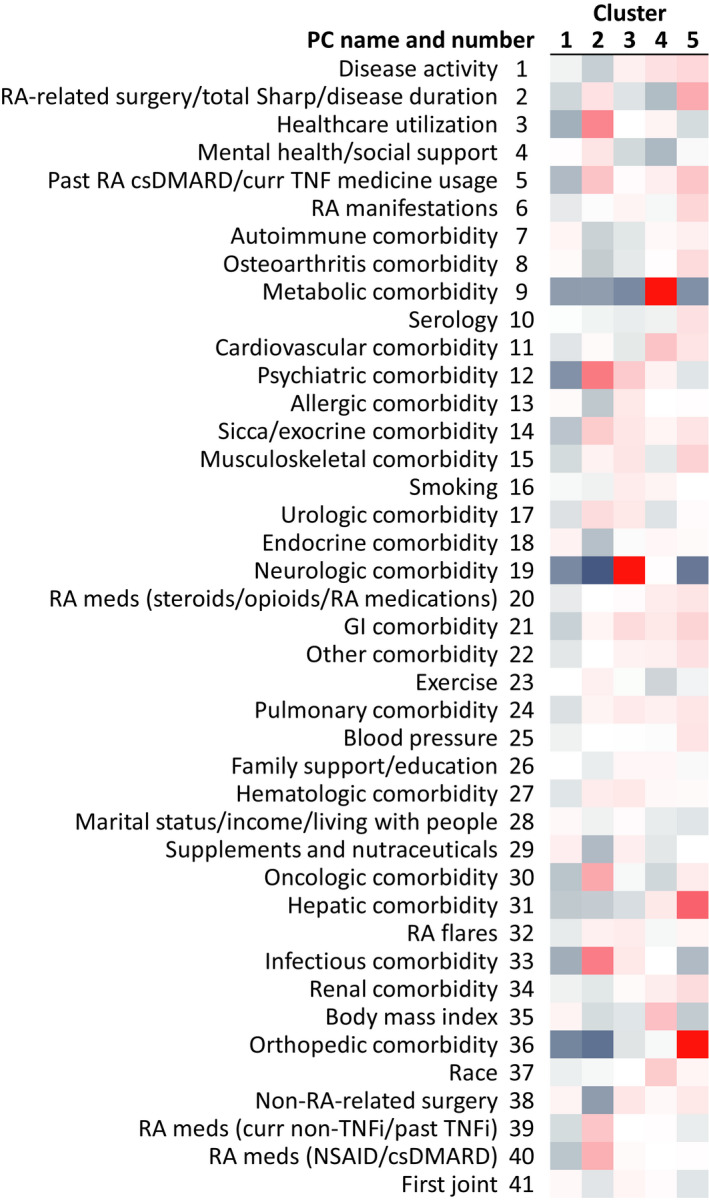
Heatmap of principal component (PC) scores across the clusters, showing variation relative to overall Brigham and Women’s Rheumatoid Arthritis Sequential Study average. PCs are ranked by variance explained. Positive scores appear in red, negative scores in blue. csDMARD = conventional synthetic disease‐modifying antirheumatic drug; curr = current; GI = gastrointestinal; NSAID = nonsteroidal antiinflammatory drug; RA = rheumatoid arthritis; TNFi = tumor necrosis factor inhibitor.
Differences between clusters for the parameters shown in Tables 1 and 2 were formally tested using an analysis of variance (ANOVA) F‐test and pairwise comparisons (see Supplementary Table 5, available on the Arthritis Care & Research website at http://onlinelibrary.wiley.com/doi/10.1002/acr.24471/abstract). All parameters showed significant differences between clusters by ANOVA F‐test, except smoking, current medication use, and Asian race. Pairwise comparison between clusters indicated that specific clusters were driving significance for some characteristics, with cluster 1 showing lower current opioid use, cluster 2 showing higher use of non–tumor necrosis factor (TNF) treatments, and cluster 4 showing higher metabolic comorbidities and body mass index (BMI).
The 5 clusters were distributed along a spectrum of RA disease activity (Table 1). The 2 clusters with the lowest RA disease activity also exhibited the lowest prevalence of comorbidities but differed in RA duration (Tables 1 and 2). Similarly, the 2 clusters with the highest RA disease activity also exhibited the highest prevalence of comorbidities but differed in RA duration. The clusters were named according to RA disease activity/multimorbidity, RA duration, and distinguishing PC(s). Cluster PC scores and mean values of each component variable are provided in Supplementary Table 6, available on the Arthritis Care & Research website at http://onlinelibrary.wiley.com/doi/10.1002/acr.24471/abstract. Cluster PC scores represent the distance in SDs of the cluster mean from the overall BRASS population mean for that PC. In the overall BRASS population, each PC has a score of 0, with SD of 1 (see Supplementary Table 6).
Cluster characteristics
Cluster 1 (less RA disease activity/multimorbidity, shorter RA duration, lower incidence of comorbidities) was notable in having low incidence of comorbidities relative to the other clusters, illustrated by negative PC scores for most comorbidities (Figure 1). The lowest PC score in cluster 1 was –0.29 for psychiatric comorbidity, which reflects 11% prevalence of psychiatric comorbidity ever, compared with 27% in the overall BRASS population (see Supplementary Table 6, available on the Arthritis Care & Research website at http://onlinelibrary.wiley.com/doi/10.1002/acr.24471/abstract). Cluster 1 also had the lowest PC scores across clusters for health care utilization (–0.21; reflected by mean 0.30 primary care physician [PCP] visits in the last 6 months, compared with 0.40 in BRASS overall) (Table 2).
Cluster 2 (less RA disease activity/multimorbidity, longer RA duration, more infections, psychiatric comorbidities, health care utilization) had the lowest disease activity PC score (–0.13, illustrated by mean CDAI score of 17.2, compared with 19.6 in the overall BRASS cohort). Cluster 2 had longer duration of RA than cluster 1 (median 11 versus 5 years, respectively [Table 1], reflected in higher PC score for RA‐related surgery/total Sharp score/disease duration: +0.12 versus –0.10, respectively). The highest PC score in cluster 2 was +0.61 for psychiatric comorbidity (reflected by 51% prevalence of psychiatric comorbidity ever, predominantly depression). Cluster 2 also had the highest PC scores across clusters for infection comorbidity (+0.60, reflected by a 59% prevalence of infection comorbidity ever), health care utilization (+0.55, reflected by a mean 0.74 PCP visits in the last 6 months), RA medications (nonsteroidal antiinflammatory drug/conventional synthetic disease‐modifying antirheumatic drug [csDMARD]) (+0.34), and RA medications (non‐TNF biologic DMARD [bDMARD]) (+0.24). Cluster 2 was also characterized by above BRASS average oncologic comorbidity (+0.38) and below BRASS average neurologic comorbidity (–0.46) and orthopedic comorbidity (–0.39). Patients in cluster 2 had the highest mental health/social support (score +0.11) and did the most exercise (exercise score +0.06; reflected by a mean 2.6 hours of exercise per week).
Cluster 3 (moderate RA disease activity/multimorbidity, more neurologic comorbidity), although well separated from the other clusters across the spectrum of PCs (see Supplementary Figure 2, available on the Arthritis Care & Research website at http://onlinelibrary.wiley.com/doi/10.1002/acr.24471/abstract), was intermediate according to the terms of multimorbidity, RA disease activity, and RA duration. Patients in cluster 3 had the highest score for neurologic comorbidity (+2.39), which predominantly consisted of migraine and dementia (ever prevalence 77% and 5%, respectively). Other above BRASS average PCs in cluster 3 were hematologic comorbidity (+0.10), allergic comorbidity (+0.10), and smoking (+0.08).
Cluster 4 (more RA disease activity/multimorbidity, shorter RA duration, more metabolic comorbidity, higher BMI) was notable for a high prevalence of metabolic comorbidity (score +3.4), predominantly diabetes mellitus (ever prevalence 10% for type 1 and 80% for type 2). Cluster 4 also exhibited the highest scores for BMI (median BMI 31; PC score +0.27) and cardiovascular comorbidity (+0.25). Patients in cluster 4 had below average mental health/social support (score –0.19) and exercise (–0.11; mean 1.4 hours/week) but slightly above average family support/education (+0.04). Cluster 4 had the highest proportion of African Americans (race score +0.21, translating to 18% African American, 79% White, 4% Other).
Cluster 5 patients (more RA disease activity/multimorbidity, longer RA duration, more hepatic, orthopedic comorbidity and RA‐related surgeries) had the highest disease activity (score +0.17, reflected by a mean CDAI score of 25.2 and 76% of patients having a CDAI score >10) (Table 1), RA manifestations (+0.17, reflected by 35% and 22% prevalence of subcutaneous nodules and Sjögren’s syndrome, respectively), and orthopedic comorbidity (+1.85). History of RA surgery was most prevalent in cluster 5 (56%, compared with 36% in BRASS overall). Cluster 5 also exhibited the highest score among the clusters for hepatic comorbidity (+0.74), musculoskeletal comorbidity (+0.19), and gastrointestinal comorbidity (+0.18). Patients in cluster 5 were on average the oldest (median age 64 years) and had the highest average blood pressure (+0.11; mean 130/77 mm Hg).
Longitudinal outcomes over 2 years
The proportions of patients remaining in the study were 94%, 88%, and 76% at 6 months, 1 year, and 2 years, respectively. BRASS patient attrition was worst in cluster 2 (31% at 2 years) and least in cluster 1 (20% at 2 years; see Supplementary Figure 3, available on the Arthritis Care & Research website at http://onlinelibrary.wiley.com/doi/10.1002/acr.24471/abstract). The greatest absolute improvements in CDAI score over 2 years were observed in clusters 3 and 4 (Figure 2). Cluster 5 had the highest CDAI score at baseline and showed less improvement than clusters 3 and 4. The lower RA disease activity/multimorbidity clusters (1 and 2) had the lowest CDAI scores at baseline and showed improvement to 1 year but not thereafter, possibly consistent with a floor effect. The different disease activity scores showed generally similar patterns of results across the clusters, except for the RADAI, which discriminated well between clusters 1 and 2 but not between clusters 3, 4, and 5 (see Supplementary Figure 4, available on the Arthritis Care & Research website at http://onlinelibrary.wiley.com/doi/10.1002/acr.24471/abstract). There were marked differences between clusters for change in tender joint count (Figure 2). Clusters 1, 2, and 5 showed virtually no change in tender joint count over 2 years, whereas clusters 3 and 4 showed steady improvement. Patients in cluster 3 had the worst mean mental health index score at baseline and showed the greatest improvement over 2 years.
Figure 2.
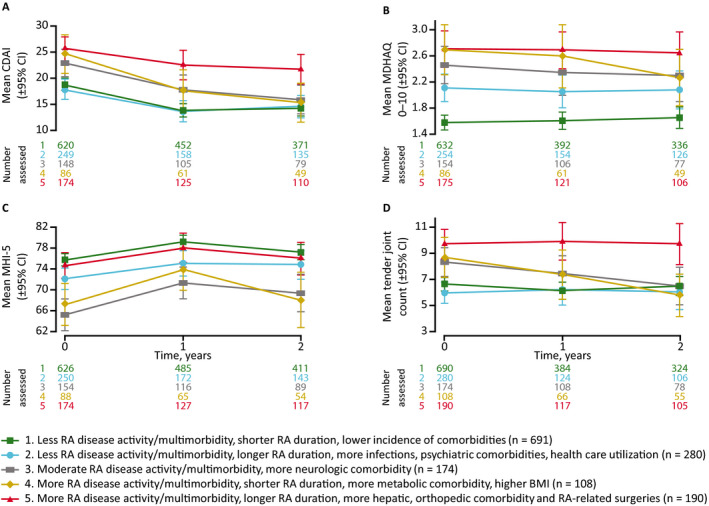
Clinical outcomes over 2 years. Mean Clinical Disease Activity Index (CDAI) score (A), Multidimensional Health Assessment Questionnaire (MDHAQ) score (B), 5‐item Mental Health Index (MHI‐5) score (C), and tender joint count (D). Observed cases with no imputation for missing data. 95% CI = 95% confidence interval; BMI = body mass index; RA = rheumatoid arthritis. Error bars indicate the 95% CI.
Time to first infection in BRASS was longest for patients in cluster 1 and shortest in cluster 5 (Figure 3A). By 2 years of follow‐up, 51% of patients in cluster 1 and 70% of patients in cluster 5 had reported a first infection in BRASS. First change in csDMARD or bDMARD occurred in approximately one‐half of patients across clusters by 1 year. By 2 years, there was a noticeable difference between cluster 5, in which 59% of patients had recorded a first change in csDMARD or bDMARD, and the other clusters, in which ~70% of patients had recorded a first change in csDMARD or bDMARD (Figure 3B). First change in bDMARD occurred in approximately one‐half of patients in clusters 1–4 by 18 months, rising to ~60% by 2 years (Figure 3C). By contrast, in cluster 5, first change in bDMARD occurred in 46% of patients by 2 years.
Figure 3.

Time to first infection (A), change of conventional synthetic or biologic disease‐modifying antirheumatic drug (DMARD) (B), and change of biologic DMARD (C). BMI = body mass index; RA = rheumatoid arthritis.
DISCUSSION
In this study, a data‐driven approach was used to identify 5 distinct patient phenotype clusters in RA using only baseline data measured at enrollment. The clusters were differentiated by general health state and behaviors, RA disease activity, and RA duration, and they followed different trajectories of disease progression over 2 years of follow‐up. These properties suggest that the clusters may represent meaningful phenotypes of RA.
The goal of data‐driven identification of phenotypes within RA is to guide patient management and suggest paths for additional studies to determine treatment approaches based on phenotype. Rapid recognition of defined phenotypic patterns within a fast‐paced practice setting could provide added information to facilitate personalized management strategies for individual patients. Thus, phenotypic differences in non‐RA factors could inform the direction of discussion when broadening the consultation outside RA, with the aim of exploring additional support where needed as part of collaborative goal setting and shared decision‐making. For example, in our study, among the more RA disease activity/multimorbidity clusters, cluster 4 (more RA disease activity/multimorbidity, shorter RA duration, more metabolic comorbidity, higher BMI) showed a strong negative score for the PC mental health/social support, whereas cluster 5 (more RA disease activity/multimorbidity, longer RA duration, more hepatic, orthopedic comorbidity and RA‐related surgeries) was close to the BRASS average for this PC. Interventions focused on mental health and social support might be well targeted at patients with characteristics similar to cluster 4.
It is well established that comorbid conditions can be major factors driving differential outcomes in patients with RA (19, 20, 21). In the current study, the key role of comorbid conditions in defining the clusters is apparent from their large observed differences in comorbidity PC scores. The clusters differentiated strongly on certain comorbid conditions but not others. For example, metabolic comorbidities were highly prevalent in cluster 4 (more RA disease activity/multimorbidity, shorter RA duration, more metabolic comorbidity, higher BMI) but were rare in the other clusters, including cluster 5 (more RA disease activity/multimorbidity, longer RA duration, more hepatic, orthopedic comorbidity and RA‐related surgeries). These findings might support an association between metabolic and inflammatory pathways or prolonged medication use in 1 particular RA phenotype more than in other phenotypes, with the potential to influence screening and treatment for cardiovascular risk factors (22). Similarly, the high score for neurologic comorbidities in cluster 3 (moderate RA disease activity/multimorbidity, more neurologic comorbidity) underlines the importance of neurologic drivers and manifestations in some patients with RA (23, 24). In contrast, differences between clusters were relatively minor for other autoimmune, gastrointestinal, pulmonary, and renal comorbid conditions.
The ability to classify patient characteristics using data‐driven techniques has the potential to promote the goals of personalized medicine (4). The very large amounts of data stored in electronic records have hitherto been essentially inaccessible for day‐to‐day clinical decision‐making. Approaches to apply these data to enhance patient care have become a major focus of research investigation (3). If successful, these approaches could significantly augment the depth of information available to clinicians making treatment decisions with their patients. The techniques reported here that incorporate demographic characteristics, psychosocial factors, clinical features, and patient‐reported outcomes might be used alongside genome, transcriptome, and proteome information to contribute to improved precision in matching patients to treatments (25).
Assessment of longitudinal outcomes revealed differences between clusters in disease trajectory over 2 years of follow‐up, although these differences were not tested formally. Formal testing of hypotheses around differences between clusters in disease outcomes and response to treatment is planned as part of a cross‐registry validation of the clusters. In the current study, RA disease activity scores generally improved more over 2 years in clusters 3 and 4 (moderate RA disease activity/multimorbidity, more neurologic comorbidity; more RA disease activity/multimorbidity, shorter RA duration, more metabolic comorbidity, higher BMI) than in the other clusters. The relatively smaller improvement in the less RA disease activity/multimorbidity clusters, 1 and 2, might be partly a result of a floor effect, whereby patients with better RA control have less room for improvement. While there was variation between the clusters in registry attrition over time, the differences were relatively small and considered to have had minimal effect on the observed longitudinal outcomes. The key factors influencing attrition in BRASS have been identified previously and include shorter RA disease duration and higher RA disease activity (26). The variation observed in attrition rate between clusters did not map straightforwardly by cluster RA disease duration and activity; the cluster with the worst attrition was cluster 2 (less RA disease activity/multimorbidity, longer RA duration, more infections, psychiatric comorbidities, health care utilization).
The limitations of this analysis include the single‐center nature of the registry, which limits the range of clinical approaches to patient care and imposes geographic constraints on patient selection, availability, and retention. The generalizability of the results needs to be assessed and the cluster‐based phenotypes validated in an independent data set. Moreover, in common with all registries, there is potential selection bias, such that patients who agree to participate in RA registries might not be completely representative of all patients with RA. In addition, the range of variables collected in BRASS is broad but does not exclude the likelihood that some unknown distinguishing variables were not captured or assessed and consequently did not contribute to the PC and cluster analyses. Another limitation is the cross‐sectional nature of the PC and cluster analysis, which was applied only to baseline (enrollment) variables and did not allow investigation of whether and to what extent patients might migrate between clusters over time.
In conclusion, 5 patient clusters identified by data‐driven PC analysis of the BRASS registry exhibited distinct patterns of clinical outcome and management over 2 years of follow‐up. The clinical outcomes data suggest that the clusters represent clinically meaningful categories of RA and illustrate the potential of data‐driven patient profiling as a tool to support personalized medicine in RA. Validation in an independent data set is ongoing.
AUTHOR CONTRIBUTIONS
All authors were involved in drafting the article or revising it critically for important intellectual content, and all authors approved the final version to be submitted for publication. Dr. Curtis had full access to all of the data in the study and takes responsibility for the integrity of the data and the accuracy of the data analysis.
Study conception and design
Curtis, Weinblatt, Saag, Bykerk, Furst, Fiore, St John, Kimura, Zheng, Bingham, Wright, Bergman, Nola, Charles‐Schoeman, Shadick.
Acquisition of data
Weinblatt, Shadick.
Analysis and interpretation of data
Curtis, Weinblatt, Saag, Bykerk, Furst, Fiore, St John, Kimura, Zheng, Bingham, Wright, Bergman, Nola, Charles‐Schoeman, Shadick.
ROLE OF THE STUDY SPONSOR
Sanofi and Regeneron Pharmaceuticals supported the study design and data analysis, funded medical writing support provided by Matt Lewis, PhD, of Adelphi Communications, Macclesfield, UK, in accordance with Good Publication Practice (GPP3) guidelines, and reviewed the manuscript for integrity and accuracy. The decision to submit the manuscript was not contingent upon approval by Sanofi or Regeneron Pharmaceuticals.
ADDITIONAL DISCLOSURES
Author St John is currently an employee of Intercept Pharmaceuticals but was employed by Regeneron Pharmaceuticals during the time the study was conducted.
Supporting information
Fig S1
Fig S2
Fig S3
Fig S4
Table S1
Table S2
Table S3
Table S4
Table S5
Table S6
Table S7
Supplementary Material
Acknowledgments
We thank the patients and staff of BRASS. We also thank Christine Iannaccone, project manager of BRASS.
Supported by Sanofi Genzyme and Regeneron Pharmaceuticals in accordance with Good Publication Practice guidelines.
Dr. Curtis has received consulting fees, speaking fees, and/or honoraria from AbbVie, Amgen, Bristol Myers Squibb, Corrona, Janssen, Eli Lilly and Company, Myriad, Pfizer, Regeneron, Roche, and UCB (less than $10,000 each). Dr. Weinblatt has received consulting fees, speaking fees, and/or honoraria from AbbVie, Amgen, Arena, Canfite, Crescendo, GlaxoSmithKline, Horizon, Johnson and Johnson, Pfizer, Roche, Scipher, Set Point, Tremeau (less than $10,000 each), Bristol Myers Squibb, Corrona, Gilead, and Eli Lilly and Company (more than $10,000 each) and owns stock or stock options in Canfite, Lycera, Scipher, Inmedix, and Vorso. Dr. Saag has received consulting fees, speaking fees, and/or honoraria from AbbVie, Amgen, Ironwood/AstraZeneca, Bayer, Gilead, Horizon, Kowa, Radius, Roche/Genentech, SOBI, Takeda, and Teijin (less than $10,000 each). Dr. Bykerk has received consulting fees, speaking fees, and/or honoraria from Amgen, Pfizer, Gilead, Sanofi/Regeneron, Scipher, and UCB (less than $10,000 each). Dr. Furst has received consulting fees, speaking fees, and/or honoraria from Actelion, Amgen, Bristol Myers Squibb, Corbus, Galapagos, Novartis, and Pfizer (less than $10,000 each). Dr. Fiore owns stock or stock options in Sanofi and is a coinventor on an EU patent for sarilumab licensed to Sanofi for rheumatoid arthritis. Dr. St John owns stock or stock options in Intercept Pharmaceuticals. Dr. Kimura owns stock or stock options in Regeneron. Dr. Zheng owns stock or stock options in Sanofi. Dr. Bingham has received consulting fees, speaking fees, and/or honoraria from AbbVie, Bristol Myers Squibb, Genentech/Roche, Eli Lilly and Company, and Sanofi/Regeneron (less than $10,000 each). Dr. Wright has received consulting fees, speaking fees, and/or honoraria from Amgen, Exagen, Myriad Autoimmune, Pfizer, Samumed (less than $10,000 each), AbbVie, Bristol Myers Squibb, Eli Lilly and Company, Novartis, Sanofi/Regeneron, and UCB (more than $10,000 each). Dr. Bergman has received consulting fees, speaking fees, and/or honoraria from Bristol Myers Squibb, Genentech, GlaxoSmithKline, Janssen, Merck, Sandoz (less than $10,000 each), AbbVie, Amgen, Gilead, Pfizer, Novartis, and Sanofi/Regeneron (more than $10,000 each) and owns stock or stock options in Johnson & Johnson. Dr. Nola has received consulting fees, speaking fees, and/or honoraria from Sanofi, Regeneron, Coherus, and Gilead (less than $10,000 each) and owns stock or stock options in Novartis, Amgen, and Abbott. Dr. Charles‐Schoeman has received consulting fees, speaking fees, and/or honoraria from Sanofi/Regeneron, Pfizer, Octapharma, Amgen, and Gilead (less than $10,000 each). Dr. Shadick has received consulting fees, speaking fees, and/or honoraria from Bristol Myers Squibb (less than $10,000). No other disclosures relevant to this article were reported.
References
- 1. Aletaha D, Neogi T, Silman AJ, Funovits J, Felson DT, Bingham CO III, et al. 2010 rheumatoid arthritis classification criteria: an American College of Rheumatology/European League Against Rheumatism collaborative initiative. Arthritis Rheum 2010;62:2569–81. [DOI] [PubMed] [Google Scholar]
- 2. Singh JA, Saag KG, Bridges SL Jr, Akl EA, Bannuru RR, Sullivan MC, et al. 2015 American College of Rheumatology guideline for the treatment of rheumatoid arthritis. Arthritis Rheumatol 2016;68:1–26. [DOI] [PubMed] [Google Scholar]
- 3. Cirillo D, Valencia A. Big data analytics for personalized medicine. Curr Opin Biotechnol 2019;58:161–7. [DOI] [PubMed] [Google Scholar]
- 4. Basile AO, Ritchie MD. Informatics and machine learning to define the phenotype. Expert Rev Mol Diagn 2018;18:219–26. [DOI] [PMC free article] [PubMed] [Google Scholar]
- 5. Eng SW, Duong TT, Rosenberg AM, Morris Q, Yeung RS, on behalf of the REACCH OUT and BBOP Research Consortia . The biologic basis of clinical heterogeneity in juvenile idiopathic arthritis. Arthritis Rheumatol 2014;66:3463–75. [DOI] [PMC free article] [PubMed] [Google Scholar]
- 6. Orange DE, Agius P, DiCarlo EF, Robine N, Geiger H, Szymonifka J, et al. Identification of three rheumatoid arthritis disease subtypes by machine learning integration of synovial histologic features and RNA sequencing data. Arthritis Rheumatol 2018;70:690–701. [DOI] [PMC free article] [PubMed] [Google Scholar]
- 7. Kim KJ, Kim M, Adamopoulos IE, Tagkopoulos I. Compendium of synovial signatures identifies pathologic characteristics for predicting treatment response in rheumatoid arthritis patients. Clin Immunol 2019;202:1–10. [DOI] [PMC free article] [PubMed] [Google Scholar]
- 8. Long NP, Park S, Anh NH, Min JE, Yoon SJ, Kim HM, et al. Efficacy of integrating a novel 16‐gene biomarker panel and intelligence classifiers for differential diagnosis of rheumatoid arthritis and osteoarthritis. J Clin Med 2019;8:50. [DOI] [PMC free article] [PubMed] [Google Scholar]
- 9. Plant D, Maciejewski M, Smith S, Nair N, the Maximising Therapeutic Utility in Rheumatoid Arthritis Consortium, the RAMS Study Group , et al. Profiling of gene expression biomarkers as a classifier of methotrexate nonresponse in patients with rheumatoid arthritis. Arthritis Rheumatol 2019;71:678–84. [DOI] [PMC free article] [PubMed] [Google Scholar]
- 10. Chin CY, Hsieh SY, Tseng VS. eDRAM: effective early disease risk assessment with matrix factorization on a large‐scale medical database: a case study on rheumatoid arthritis. PLoS One 2018;13:e0207579. [DOI] [PMC free article] [PubMed] [Google Scholar]
- 11. Lin C, Karlson EW, Canhao H, Miller TA, Dligach D, Chen PJ, et al. Automatic prediction of rheumatoid arthritis disease activity from the electronic medical records. PLoS One 2013;8:e69932. [DOI] [PMC free article] [PubMed] [Google Scholar]
- 12. Curtis JR, Chen L, Greenberg JD, Harrold L, Kilgore ML, Kremer JM, et al. The clinical status and economic savings associated with remission among patients with rheumatoid arthritis: leveraging linked registry and claims data for synergistic insights. Pharmacoepidemiol Drug Saf 2017;26:310–9. [DOI] [PMC free article] [PubMed] [Google Scholar]
- 13. Iannaccone CK, Lee YC, Cui J, Frits ML, Glass RJ, Plenge RM, et al. Using genetic and clinical data to understand response to disease‐modifying anti‐rheumatic drug therapy: data from the Brigham and Women’s Hospital Rheumatoid Arthritis Sequential Study. Rheumatology (Oxford) 2011;50:40–6. [DOI] [PubMed] [Google Scholar]
- 14. Jolliffe IT, Cadima J. Principal component analysis: a review and recent developments. Philos Trans A Math Phys Eng Sci 2016;374:20150202. [DOI] [PMC free article] [PubMed] [Google Scholar]
- 15. Coste J, Bouee S, Ecosse E, Leplege A, Pouchot J. Methodological issues in determining the dimensionality of composite health measures using principal component analysis: case illustration and suggestions for practice. Qual Life Res 2005;14:641–54. [DOI] [PubMed] [Google Scholar]
- 16. Lever J, Krzywinski M, Altman N. Points of significance: principal component analysis. Nat Methods 2017;14:641–2. [Google Scholar]
- 17. Do JH, Choi DK. Clustering approaches to identifying gene expression patterns from DNA microarray data. Mol Cells 2008;25:279–88. [PubMed] [Google Scholar]
- 18. Pincus T. A multidimensional health assessment questionnaire (MDHAQ) for all patients with rheumatic diseases to complete at all visits in standard clinical care. Bull NYU Hosp Jt Dis 2007;65:150–60. [PubMed] [Google Scholar]
- 19. Romano S, Salustri E, Ruscitti P, Carubbi F, Penco M, Giacomelli R. Cardiovascular and metabolic comorbidities in rheumatoid arthritis. Curr Rheumatol Rep 2018;20:81. [DOI] [PubMed] [Google Scholar]
- 20. Dougados M, Soubrier M, Antunez A, Balint P, Balsa A, Buch MH, et al. Prevalence of comorbidities in rheumatoid arthritis and evaluation of their monitoring: results of an international, cross‐sectional study (COMORA). Ann Rheum Dis 2014;73:62–8. [DOI] [PMC free article] [PubMed] [Google Scholar]
- 21. Van Onna M, Boonen A. The challenging interplay between rheumatoid arthritis, ageing and comorbidities. BMC Musculoskelet Disord 2016;17:184. [DOI] [PMC free article] [PubMed] [Google Scholar]
- 22. Jagpal A, Navarro‐Millan I. Cardiovascular co‐morbidity in patients with rheumatoid arthritis: a narrative review of risk factors, cardiovascular risk assessment and treatment. BMC Rheumatol 2018;2:10. [DOI] [PMC free article] [PubMed] [Google Scholar]
- 23. Ramos‐Remus C, Duran‐Barragan S, Castillo‐Ortiz JD. Beyond the joints: neurological involvement in rheumatoid arthritis. Clin Rheumatol 2012;31:1–12. [DOI] [PubMed] [Google Scholar]
- 24. DeQuattro K, Imboden JB. Neurologic manifestations of rheumatoid arthritis. Rheum Dis Clin North Am 2017;43:561–71. [DOI] [PubMed] [Google Scholar]
- 25. Wafi A, Mirnezami R. Translational‐omics: future potential and current challenges in precision medicine. Methods 2018;151:3–11. [DOI] [PubMed] [Google Scholar]
- 26. Iannaccone CK, Fossel A, Tsao H, Cui J, Weinblatt M, Shadick N. Factors associated with attrition in a longitudinal rheumatoid arthritis registry. Arthritis Care Res (Hoboken) 2013;65:1183–9. [DOI] [PubMed] [Google Scholar]
Associated Data
This section collects any data citations, data availability statements, or supplementary materials included in this article.
Supplementary Materials
Fig S1
Fig S2
Fig S3
Fig S4
Table S1
Table S2
Table S3
Table S4
Table S5
Table S6
Table S7
Supplementary Material