

Abstract
This study reports on the impact of identity and compositions of buffer ions on oxygen evolution reaction (OER) performance at a wide range of pH levels using a model IrOx electrocatalyst. Rigorous microkinetic analysis employing kinetic isotope effects, Tafel analysis, and temperature dependence measurement was conducted to establish rate expression isolated from the diffusion contribution of buffer ions and solution resistance. It was found that the OER kinetics was facile with OH− oxidation compared to H2O, the results of which were highlighted by mitigating over 200 mV overpotential in the presence of buffer to reach 10 mA cm−2. This improvement was ascribed to the involvement of the kinetics of the local OH− supply by the buffering action. Further digesting the kinetic data at various buffer pK a and the solution bulk pH disclosed a trade‐off between the exchange current density and the Tafel slope, indicating that the optimal electrolyte condition can be chosen at a different range of current density. This study provides a quantitative guideline for electrolyte engineering to maximize the intrinsic OER performance that electrocatalyst possesses especially at near‐neutral pH.
Keywords: electrocatalysis, iridium oxide, near-neutral pH, oxygen evolution reaction, reaction mechanism
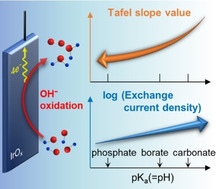
A buffer for OER: Rigorous microkinetic analysis using the IrOx electrocatalyst reveals that OH− is most likely the reactant for the oxygen evolution reaction (OER) in near‐neutral buffered conditions whereby buffering species function to maintain the concentration of OH−. Digesting the OER kinetic data discloses a trade‐off relationship between the exchange current density and the Tafel slope value, determining the optimal electrolyte condition at a given current density.
Introduction
Driving the chemical reaction with electric power produced from renewable energy sources has the potential to achieve a sustainable society. Among a variety of technologies compatible with this view, water electrolysis driven by renewable electric power is one of the most promising methods, which can convert the ubiquitous water into hydrogen as an energy carrier using difficult‐to‐store electricity.[ 1 , 2 , 3 , 4 ] In fact, many research groups have investigated such an electrocatalytic system to efficiently produce hydrogen.[ 5 , 6 , 7 ] The water electrolysis comprises the oxygen evolution reaction (OER) and the hydrogen evolution reaction (HER) as the anodic and cathodic half‐reactions, respectively, and the former requires larger overpotential than the latter, thus being considered the kinetic bottleneck.[ 8 , 9 , 10 , 11 ] Accordingly, the development of highly active electrocatalysts for the OER has been the key to improving the efficiency of the water electrolysis.
In the past decades, many research groups have investigated the OER under extremely acidic or alkaline pH conditions that have been known to maximize water electrolysis efficiency by minimizing the kinetic overpotentials as well as the ohmic loss.[ 12 , 13 , 14 ] Various materials have been evaluated for their potential use as OER electrocatalysts in both pH regions, including noble metal oxides[ 15 , 16 , 17 , 18 ] and first‐row transition metal oxides.[ 19 , 20 , 21 , 22 ] Those studies found a correlation between their performance toward the OER and material properties such as the surface binding energy to OH, O, and OOH species, revealing a volcano‐trend relationship for the OER as an example of the Sabatier principle, which predicts that a material that moderately binds intermediates can achieve the highest performance.[ 23 , 24 , 25 ] Among materials hitherto investigated, iridium oxide (IrOx) was found to sit at the top of the experimentally obtained volcano relationship for the OER [26] or close to the top of the theoretical one in the case of the IrO2 (110) surface,[ 25 , 27 ] which exhibits high performance toward the OER in both acidic and alkaline pH conditions.[ 15 , 28 , 29 , 30 , 31 ] In fact, to achieve 10 mA cm−2, which is a benchmark value corresponding to 10 % solar‐to‐hydrogen conversion efficiency in the combined solar hydrogen production systems,[ 32 , 33 , 34 ] IrOx requires a mere overpotential of 270 mV in 1 m H2SO4. [35]
From a different viewpoint into the field of electrocatalysis, several studies have recently pointed to the near‐neutral pH medium as an alternative condition of water electrolysis. This near‐neutral pH medium offers milder reaction conditions than those of its extreme pH counterparts, which can overcome the safety concerns and reduce the capital cost,[ 34 , 36 , 37 , 38 ] being beneficial for use in the localized energy system[ 37 , 38 ] as well as for on‐site and small‐scale processes coupled with the renewable energy generation system.[ 34 , 36 ] One of the fundamental issues related to the OER under unbuffered near‐neutral pH conditions is the reactant‐switching event. More specifically, the pH condition determines the OER reactants; either the water molecule [H2O; Eq. (1)] or the hydroxide ion [OH−; Eq. (2)] at the acidic or alkaline pH levels,[ 23 , 28 , 39 ] respectively: 1, 2
| (1) |
| (2) |
Our previous study[ 40 , 41 ] quantitatively addressed the threshold pH for this reactant‐switching to be universally pH≈11 at reaction rates on the order of mA cm−2, which is determined solely by the properties of electrolyte and, thus, holds true regardless of the identity of electrodes. Accordingly, changes in local pH during the reaction in the proximity of the electrode surface also switch the reactants at the near‐neutral pH levels, inherent to the reaction in unbuffered conditions.[ 42 , 43 , 44 ] The small activity of the available OH− under the near‐neutral pH condition can account for only a small reaction rate of the OER on the order of μA cm−2; in turn, the larger reaction rate is evidenced by the oxidation of H2O. [42] The consumption of local OH− leads to the loss in performance by increasing the concentration overpotential,[ 45 , 46 ] and the kinetic difficulty in dissociating the O−H bonding of H2O can require larger overpotential for the H2O oxidation than OH− oxidation. [47] Because of these losses, the achievable performance at an unbuffered near‐neutral pH in the literature remained low, calling for research efforts in this direction.
In this context, the introduction of the buffering species into the near‐neutral pH medium was found to improve the electrocatalytic performance at near‐neutral pH levels. For instance, Nakamura and co‐workers demonstrated that the onset potential of the OER over IrOx electrodes decreased upon the introduction of buffering species, and became comparable to those at extreme pH levels. [29] In addition, Surendranath et al. observed a considerable decrease of the Tafel slope values over Co‐based electrodes from 170 mV dec−1 in 0.1 m unbuffered NaClO4 to 59 mV dec−1 in buffered Na‐phosphate at pH 8.0. [48] Addressing the origin of the improvement, Dau and Pasquini presented a model to describe the proton (H+) concentration near the electrode surface and revealed that the buffering species facilitated the transport of H+ and mitigated the local pH alteration observed in the unbuffered electrolyte. [49] In accordance, Nakamura and co‐workers demonstrated that the OER performance over MnOx scaled with the pK a value of added buffering species. [50] Notwithstanding these achievements, there still exists a lack of fundamental understanding as to the impacts of electrolyte property on the OER kinetics, including the kinetically relevant reactant for the OER participating in the surface reactions under buffered near‐neutral pH conditions, either H2O or OH−, which impedes the rational design of a water electrolysis system.
The present study reports on a rigorous microkinetic analysis of the OER in buffered electrolytes at near‐neutral pH levels using IrOx as a model electrocatalyst to elucidate the impacts of electrolytes on electrocatalytic performance. Initial assessment of the current‐potential relationships demonstrated that the introduction of the buffering species improved the OER performance universally at the near‐neutral pH of 5–10. This improvement was reasoned to originate from the provision of OH− in situ or the removal of H+ from the surface due to the buffering actions, which corresponds to the OER proceeding as the oxidation of OH− or H2O, respectively. Analysis of the Tafel slope, the reaction order, the isotope effect, and the temperature sensitivity concurrently suggested that OH− supplied by the buffering action functions as the kinetically relevant reactant participating in the surface reactions. Subsequently, for the OER in buffered near‐neutral pH conditions, a trade‐off relationship was disclosed between the exchange current density and Tafel slope with respect to the pK a and pH of the electrolyte, which allowed for rational identification of the optimal pK a of the buffering action to maximize the OER performance at near‐neutral pH levels. The findings presented in this study highlight the significance of electrolyte property on electrocatalysis, which is universally applicable to other aqueous electrocatalysis, leading to the development of a highly efficient water electrolysis system at near‐neutral pH levels.
Results and Discussion
Improved OER performance by the addition of buffering species
Notwithstanding the recent advancement in the field of electrocatalytic OER, the kinetically relevant reactant in the buffered near‐neutral pH conditions remains elusive. This study aims to elucidate the reactant by rigorous microkinetic analysis and began with the comparison of the current‐potential relationship in both buffered and unbuffered conditions using the IrOx electrode as a model catalyst. Figure 1a shows the linear sweep voltammetry (LSV) profiles in unbuffered Na‐perchlorate solution at the representative pH together with the LSV in buffered Na‐phosphate solution at pH 11 on the standard hydrogen electrode (SHE) scale in the rotating‐disk electrode (RDE) configuration at a fixed disk‐rotation speed of 4900 rpm. The anodic current densities ascribable to the OER increased with the applied potentials, and the j‐E relationship depended on the bulk pH of the electrolyte. Under the unbuffered conditions, while the anodic current densities monotonically increased with the applied potential at the pH levels of 1 and 13, a two‐step anodic event was observed at the weakly alkaline pH of 11. Previous studies assigned the initial oxidation of the event to the oxidation of OH−, whose small activity led to the limiting diffusion current density at pH 11 when reaching a reaction rate on the order of mA cm−2.[ 40 , 41 ] The anodic current densities at the larger overpotential exceeded the limiting diffusion current density of OH−; thus, observed current densities were ascribable to the oxidation of H2O evidencing the OER at the full depletion of OH−, that is, the reactant‐switching took place.[ 40 , 41 ] The introduction of the buffering species into the reaction medium substantially changed this j‐E relationship. While the two‐step anodic event was observable in the unbuffered solution, only a monotonically increasing anodic current density with the potential was apparent in the phosphate solution at pH 11. The disappearance of the limiting diffusion current density of OH− upon the introduction of the buffering species indicates (1) the provision of OH− in situ due to the buffering actions or (2) the removal of locally generated H+ during the OER, thus mitigating the concentration overpotential. The former expects OH− to be the reactant for the OER, while in the latter case H2O behaves as the reactant.
Figure 1.
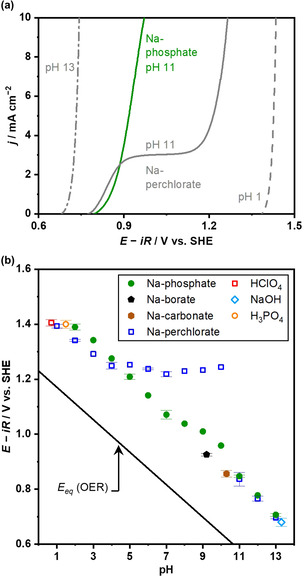
OER over IrOx in various electrolytes. (a) LSVs over the IrOx disk electrode in a RDE configuration are shown (0.1 mol kg−1 Na‐perchlorate at pH 1, 11, and 13, or 0.1 mol kg−1 Na‐phosphate at pH 11, 4900 rpm, −1 mV s−1, 298 K). The numbers in the figure indicate the electrolyte pH in the bulk. (b) Onset potential, defined as potential reaching +1 mA cm−2, was plotted as a function of electrolyte pH in the bulk. The solid line labeled as E eq indicates the equilibrium potential for the OER.
The universality of the negative shift of the OER onset potential upon the introduction of the buffering species was then accessed in a variety of electrolyte solutions. Figure 1b plots the onset potential (defined as the potential reaching +1 mA cm−2) as a function of pH, adopted from the voltammograms in buffered conditions shown in Figure S1 (see Figure S2 for the potential‐pH diagram at +10 mA cm−2). In the unbuffered electrolyte of the Na‐perchlorate solution, the onset potential for the OER followed the Nernstian expectation of −59 mV pH−1 at pH levels below 5 and above 10, while it remained constant at pH values in between, due to the shift in the local pH to approximately 4. [42] In contrast, the onset potential in the Na‐phosphate solutions shifted with the bulk pH value by approximately −59 mV pH−1 in the entire pH range investigated, which is consistent with a report by Nakamura and co‐workers. [29] Accordingly, a negative shift of the OER onset potential upon the introduction of the buffering species was universally apparent at the near‐neutral pH levels between 5 and 10. However, the onset potentials below pH 5 in the buffered conditions were more positive than those in unbuffered ones. Two factors account for this loss in performance upon the introduction of the buffering species. Firstly, the condition below pH 5 is acidic enough that local pH during the OER would not acid‐shift; thereby, the addition of the buffering species would not improve the performance. Secondly, the phosphate species such as H3PO4 and H2PO4 − present in the solution would adsorb on the electrode surface as reported for IrOx and Pt electrodes,[ 51 , 52 , 53 , 54 ] leading to the blockage of the active site. Figure 1b also shows the OER onset potentials in the buffered solutions other than phosphate, namely, Na‐borate at pH 9.2 and Na‐carbonate at pH 10.3. Interestingly, in those solutions, the IrOx electrodes exhibited more negative onset potentials, that is, smaller overpotentials, than in the phosphate solution at a given pH. This difference in performance provides insights into the kinetic aspects of the OER, which is quantitatively addressed later.
Identification of OER‐reactant by rigorous microkinetic analysis
This section details the microkinetic analysis of the OER at the near‐neutral pH levels in the buffered medium to elucidate the kinetically relevant OER‐reactant participating in the surface reaction, particularly by looking into the pH‐dependence, isotope effect, and temperature sensitivity in parallel. To isolate the kinetic contribution, the Na‐phosphate solution at sufficiently high molality was employed (e. g., 1.0 mol kg−1; see Figures S3–S5), and/or the Koutecký‐Levich (K‐L) equation [55] [Eq. (3)] was applied:
| (3) |
where j, j kin, and j lim are the overall, kinetic, and diffusion‐limited current densities, respectively. It should be noted that while the onset potential remained unchanged with varying molalities, anodic current densities depended on the disk‐rotation speeds.
With the thus‐obtained kinetic current densities, firstly, the reaction order to H+ or OH− was investigated using the IrOx electrode in the Na‐phosphate solution at the near‐neutral pH. The kinetic dependence on H+ and OH− appears for the oxidation of H2O and OH− as the OER, respectively. The analysis employed the following Equations (4) and 5: [39]
| (4) |
| (5) |
where E is the electrode potential. These equations contain the terms of (∂E/∂pH)j and (∂E/∂log j)pH, which can be quantitatively addressed by looking at the E‐pH and the E‐log(j) plots, respectively. The slope of the E‐pH diagram in Figure 1b corresponded to the (∂E/∂pH)j, determined to be −60 mV pH−1 in a wide pH range of 2–13. As for the E‐log(j) relationship, the Tafel slope was determined at each pH level (see Figures S6–S8 for raw LSVs, K‐L plots, and Tafel plots, respectively, in 0.1 mol kg−1; and also Figure S9 for those in 1.0 mol kg−1 solution at pH 7) and compiled as a function of pH in Figure 2 (top). Because the Tafel slope and the pH dependence in Figure 1b were obtained in the range of current density from 1 to 20 mA cm−2, the discussion below on the kinetics is valid only in this current range. Interestingly, the Tafel slope varied substantially with the pH, accompanying transitions at pH levels of 5 and 10. At the acidic pH of 2, the slope value was approximately 30 mV dec−1 quantitatively in accordance with the reported values, [29] which increased with the pH to reach 70 mV dec−1 at pH 5. An increment of pH by one unit led to a sharp decrease in the slope value to 35 mV dec−1 at pH 6, which again became larger as the pH levels increased until reaching pH 10. At pH levels of 10 and greater, slope values decreased from 89 to 43 mV dec−1 at pH 13, consistent with the reported values at the alkaline pH.[ 56 , 57 ] It should be noted that the error in the Tafel slope values (±1 mV) was much smaller than the difference induced by varying the electrolyte pH, which highlights the significance of the differences from pH shift. Accordingly, the reaction order to H+/OH− also largely varied with the pH based on Equations (4) and (5). Figure 2 (middle) shows the reaction order calculated with Equations (4) and (5) using the values in Figure 2 (top), which revealed that the reaction order experienced transitions also at pH 5 and 10; specifically, at the near‐neutral pH levels, the reaction order to H+ [or OH−] was −1.7 [or 1.7] at pH 6, which monotonically decreased with the pH, reaching −1.2 [or 1.2] at pH 8. Notably, the transition pH levels observed herein coincided with the pH values at which the composition of phosphate species change. [58] As shown in Figure 2 (bottom), the phosphate species exist predominantly as H3PO4/H2PO4 − at the acidic pH levels, which at pH 5 switches to H2PO4 −/HPO4 2− and subsequently to HPO4 2−/PO4 3− at pH 10. When the OER overpotential was compiled as a function pH (see below), the overpotential became minimum at pH 7 in the near‐neutral pH region, which coincided with the pK a of phosphate where the buffering action functions the most.[ 49 , 59 ] These quantitative agreements are another indication that buffering species participate in the OER, whose pK a impacts the OER kinetics.
Figure 2.
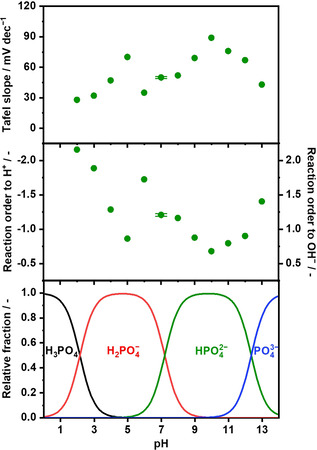
Tafel slopes and kinetic order of the OER at various pH levels over IrOx. (top) Tafel slope values (0.1 mol kg−1 Na‐phosphate at pH 2–6 and 8–13, or 1.0 mol kg−1 Na‐phosphate at pH 7, −1 mV s−1, 298 K). (middle) Calculated reaction order to H+ and OH− of the OER over IrOx. (bottom) Composition of phosphate displayed as a function of electrolyte pH. The Tafel slope value was adopted from the kinetic current densities shown in Figures S8 and S9, and the reaction order was calculated using the Tafel slope values shown in the top panel. Relative fragments of species in phosphate electrolyte solution as a function of the solute concentration, calculated with pK a values, are provided in the literature. [58]
Because the kinetic order to the H+/OH− substantially varied with pH levels, we limit ourselves to the neutral pH of 7, which is close to the pK a of the phosphate buffer hereafter to detail the kinetics. In Figure 2 (top), a Tafel slope value of 50±1 mV dec−1 was obtained at the neutral pH, which is larger than 38 mV dec−1 in 3 m phosphate solution at pH 7 [56] and a value of 28 mV dec−1 in a solution comprising 0.4 m phosphate, borate, and acetate species at pH 6. [29] In what follows, with the Tafel slope and the reaction order, the rate expression of the OER is elucidated. Regarding the reaction mechanism, previous literatures proposed two different OER mechanisms, that is, lattice‐oxygen‐mediated mechanism (LOM) and adsorbate evolution mechanism (AEM).[ 60 , 61 ] In LOM, the lattice oxygen of electrocatalysts directly participates in the OER, and several reaction pathways involving different oxidation states of the metal site were proposed.[ 62 , 63 , 64 ] This variety on the reaction pathway makes it difficult to establish certain rate expressions, which would not allow for rigorous kinetic analysis based on the Tafel slope and the reaction order assuming the LOM pathway. In addition, a recent theoretical study assessed the possibility of LOM over IrOx but found that it is less likely that LOM prevails. [65] Provided that many previous studies considered AEM to interpret the OER mechanism,[ 23 , 28 , 39 , 61 ] our present study herein also adopted the AEM. In this case, oxygen gas product is originated from absorbed H2O molecule, [60] and the oxidation of the H2O is considered to proceed via the following elementary steps [Eqs. (6)–9]:[ 23 , 28 , 39 , 61 ]
| (6) |
| (7) |
| (8) |
| (9) |
The oxidation of OH− is composed of the following elementary steps [Eqs. (10)–13]:
| (10) |
| (11) |
| (12) |
| (13) |
where * denotes a site on the surface. Theoretically, if the formation of O−O bond is the rate‐determining step (rds), that is, Equations (8) and (12) for H2O and OH− oxidation, respectively, one can expect slope values of 21, 40, and 120 mV dec−1 when the surface predominant species are * (empty site), *OH, and *O, respectively, at an electron transfer coefficient of 0.5 in AEM, regardless of the reactant. [66] Knowing that this step was reported to be the rds over the IrOx electrode in acidic and alkaline pH conditions,[ 23 , 29 , 67 , 68 ] the value of 50±1 mV dec−1 obtained herein most likely originated from the formation of the O−O bond being the rds on the surface comprising *OH and *O. The rate expressions based on this reasoning can be formulated for both cases of H2O and OH− oxidation: [66] Equations (14) and (15) below present the rate of the H2O oxidation on the surface covered by *OH and *O, respectively:
| (14) |
| (15) |
and Equations (16) and (17) below dictate the rate of the OH− oxidation on the surface comprising *OH and *O, respectively:
| (16) |
| (17) |
where k 0 is the standard rate constant, α is the electron transfer coefficient, f denotes F/RT (F is the Faraday constant, R is the gas constant, and T is temperature), ci is the concentration of species i, and K 0 is the ratio of the standard rate constant for the forward and backward reactions (see our previous microkinetic study for the derivation of the equations).[ 41 , 66 ] The subscripts indicate the corresponding equation number. Importantly, Equations (14) and (15) predict the reaction order to H+ to be −1 and 0 for the H2O oxidation, respectively, while Equations (16) and (17) show the reaction order to OH− of 2 and 1, respectively. The experimentally observed kinetic order of 1.2 in Figure 2 (middle) fell between 2 and 1, suggesting that OH− functions as the kinetically relevant reactant in buffered near‐neutral conditions.
Employing the deuterium allowed for the analysis of the apparent kinetic isotope effect (KIE). Figure 3 plotted the kinetic current densities as a function of the electrode potential in both H2O and D2O systems at pH 7 and pD 7 (see Figure S9 for LSV and K‐L plots). Although the kinetic current densities increased with the overpotential in both solutions, the j‐E relationships were quantitatively distinct when different isotopes were present. More specifically, Figure 3 shows larger current densities in H2O than in D2O above 1.11 V vs. SHE, and the ratio of the kinetic current density, the apparent KIE, increased with increasing overpotential. According to Equations (16) and (17) associated with the formation of the O−O bond being the rds, increasing KIE therein likely originated from the difference in the electron transfer coefficient and the overpotential for preequilibrium reaction in H‐ and D‐systems. On the other hand, below 1.11 V vs. SHE, a more negative onset potential and higher current densities were observed in D2O than those in H2O. As a result, the apparent KIE was slightly smaller than unity below 1.11 V over the IrOx electrode, as presented in Figure 3. This inverse KIE for the OER has rarely been observed, except for one recent study in alkaline solutions using nickel and cobalt electrodes by Tse et al. [69] In fact, our experiment herein employing IrOx in a NaOD solution showed larger Tafel slope values and larger overpotentials at current densities on the order of mA cm−2 than in NaOH solution (see Figures S10 and S11), indicating that the inverse KIE is also apparent at the small overpotential; however, we failed to experimentally observe the inverse KIE using IrOx within the accuracy of our measurements at alkaline pH levels. Because this transition from the inverse to positive KIE with increasing overpotential was only observed in the alkaline condition (OH− oxidation), [69] in contrast to the positive apparent KIE at the acidic pH (H2O oxidation), [41] the observation in the buffered near‐neutral pH condition is consistent with OH− as the reactant. Notably, in the alkaline electrolyte of 0.1 mol kg−1 NaOH solution, the Tafel slope was 50 mV dec−1 (see Figure S10 for LSV, K‐L plots, and Tafel plot) in agreement with not only the previously reported value of 48 mV dec−1 in 1 m NaOH solution [57] but also the value of 50±1 mV dec−1 in buffered near‐neutral pH condition in Figure S9, which would not contradict the similar reaction mechanism in both cases. Taken together, the observations suggest that OH− likely functions as the reactant for the OER in buffered near‐neutral pH conditions.
Figure 3.
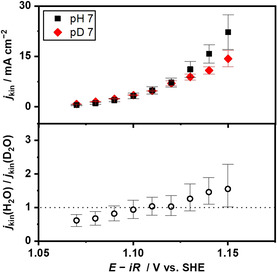
Current‐potential relationship for the OER over IrOx at the neutral pH. Kinetic current densities and the ratio of the kinetic current densities are plotted as a function of the electrode potential over the IrOx at pH and pD 7. The kinetic current densities were obtained using K‐L plots over the IrOx disk electrode shown in Figure S9, recorded in electrolyte solutions of 1.0 mol kg−1 Na‐phosphate at pH and pD 7 at a scan rate of −1 mV s−1 and a reaction temperature of 298 K.
The present study thus far on the pH dependence, the kinetic order, and the isotope effect concurrently suggested that OH− is likely the kinetically relevant reactant of the OER in the buffered near‐neutral pH condition. To further corroborate this argument, OER measurements at various temperatures were conducted, which would allow for a quantitative comparison of the activation energy of the OER with the Gibbs free energy of the buffering equilibria. Figure 4a shows LSVs in 1.0 mol kg−1 Na‐phosphate solution at pH 7 and 0.1 mol kg−1 NaOH solution at pH 12.9, which were measured over IrOx RDE at a fixed disk‐rotation speed of 3600 rpm and representative temperatures of 298 and 343 K (see Figure S12 for LSVs at different temperatures). In both electrolytes, the greater current densities were observed with the applied potential as well as at the elevated temperatures. Interestingly, the difference in the overpotential at, for example, 10 mA cm−2, between the electrolytes at pH 7 and 13 was as large as 50 mV at 298 K, which decreased to 20 mV at 343 K, meaning that the OER performance at the industrially relevant temperatures in the phosphate solution was almost comparable to that in the NaOH solution. Figure 4b shows the potential reaching +10 mA cm−2 as a function of reaction temperature over IrOx, measured in 1.0 mol kg−1 buffered electrolytes of Na‐phosphate at pH 7, Na‐borate (pK a=9.2) at pH 9.2, Na‐carbonate (pK a=10.3) at pH 10.3, and 0.1 mol kg−1 NaOH at pH 12.9 at a fixed disk‐rotation speed of 3600 rpm (see Figure S12 for LSVs and Figure S13 for K‐L plots). In all cases, the overpotentials decreased with the temperature, and the decrement in the buffered conditions was greater than the alkaline ones. This stronger sensitivity of the OER to the temperature at the near‐neutral pH indicates a larger apparent activation energy than the alkaline pH counterparts, which is quantitatively addressed below.
Figure 4.
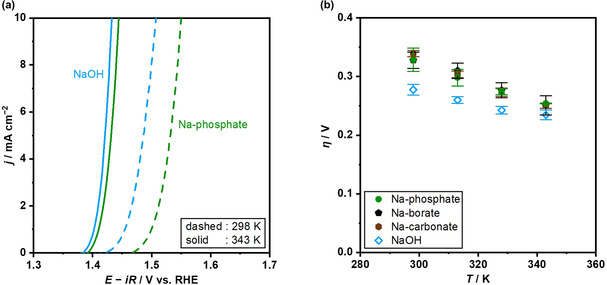
Current‐potential relationship for the OER over IrOx at various temperatures. (a) LSVs over the IrOx disk electrode in the RDE configuration are shown, recorded in electrolyte solutions of 1.0 mol kg−1 Na‐phosphate at pH 7 and 0.1 mol kg−1 NaOH at pH 12.9 at a disk rotation speed of 3600 rpm, a scan rate of −1 mV s−1, and reaction temperatures of 298 K (dashed line) and 343 K (solid line). (b) Overpotentials reaching +10 mA cm−2 over the IrOx RDE are plotted as a function of the reaction temperature, recorded in electrolyte solutions of 1.0 mol kg−1 Na‐phosphate at pH 7.0, 1.0 mol kg−1 Na‐borate at pH 9.2, 1.0 mol kg−1 Na‐carbonate at pH 10.3, and 0.1 mol kg−1 NaOH at pH 12.9 at 3600 rpm, −1 mV s−1.
Theoretically, the kinetic current density (j kin) is given by Equation (18) below:[ 55 , 70 ]
| (18) |
where n is the number of electrons transferred, F is the Faraday constant, and r is the reaction rate; and the reaction rate contains the rate constant k [Eq. 19]:[ 55 , 70 ]
| (19) |
in which ci I is the molality term of the species i with the kinetic order of I. Notably, the rate constant k of the electrocatalytic reaction depends on the electric potential, as described below for the oxidation half‐reaction [Eq. 20]:[ 55 , 70 ]
| (20) |
where k 0 is the standard rate constant, R is the gas constant, T is the absolute temperature, α is the electron transfer coefficient, and η is the overpotential that dictates the difference between the electrode and equilibrium potentials. The standard rate constant can be detailed by the Arrhenius equation [Eq. 21]:[ 55 , 70 ]
| (21) |
where A' is the pre‐exponential factor and E a,app is the apparent activation energy. Combining Equations (18)–(21) yields the following Equation 22:
| (22) |
Taking the logarithm of this equation leads to the expression below [Eq. 23]:
| (23) |
According to Equation (23), by taking the slope (defined hereafter as B) of a plot for ln(j k) vs. T, the following quantity is experimentally obtainable at each overpotential [Eq. 24]:
| (24) |
Furthermore, by plotting this B as a function of overpotential η, the apparent activation energy can be determined. With Equations (23) and (24) in mind, the current‐temperature relationship (see Figure S14) and the B‐η plot (see Figure S15) were analyzed, and the obtained apparent activation energy is listed in Table 1. The calculation revealed that apparent activation energies in the buffered conditions were on the order of 100 kJ mol−1, which was indeed larger than 69±10 kJ mol−1 in the NaOH solution as well as the previously reported value of 55–89 kJ mol−1 in acidic conditions. [51]
Table 1.
Comparison between experimental and expected apparent activation energies.
Examining the reaction enthalpy of the buffering action helped reveal the reason for this difference in activation energies. As has been discussed, it was suggested that the OH− was the reactant for the OER in the buffered near‐neutral pH medium. This suggestion accompanies a consideration that the OER proceeds as the oxidation of the OH− [Eq. (2)], whose concentration in the vicinity of the active site is maintained by buffering action [Eq. 25]:
| (25) |
where HA/A− is a buffering species. Assuming the equilibrium of Equation (25), the molality of OH− can be determined [Eq. 26]:
| (26) |
with Equation 27:
| (27) |
where ci is the molality of species i, K is the ratio of the standard rate constants for the forward and backward reactions, ΔH is the reaction enthalpy, and ΔS is the reaction entropy. By combining Equations (16), (17), (21), (26), and (27), it is found that the apparent activation energy in buffered conditions is theoretically dictated by Equation 28:
| (28) |
where E a,app(NaOH) is the apparent activation for OH− oxidation, and n is the reaction order to OH−, which was 1.2 in Na‐phosphate solution, as discussed in Figure 2 (middle). Based on this relationship, the apparent activation energy of the oxidation of OH− in the buffered condition was computed using the enthalpy of the buffering equilibrium (ΔH (25)) adopted from the literature,[ 58 , 71 , 72 ] which is summarized in Table 1. Critically, a quantitative agreement was found between the experimental and computed E a,app in all buffered conditions. This finding strongly indicates that the OER in buffered medium proceeds as the oxidation of OH−, rather than the direct oxidation of H2O and subsequent facile removal of H+.
Plausible reaction mechanism and its implication
Because the buffering action supplies the OER‐reactant, OH−, its acid‐base reaction was found to impact the rate constant as discussed in Table 1. More precisely, kinetic analysis of the temperature sensitivity revealed the smaller apparent activation energies and, in turn, the larger apparent rate constants in the presence of the buffering species with the larger pK a values. To quantitatively compare the OER performances in various environments with this rationale in mind, in Figure 5 the overpotentials achieving 1, 10, and 20 mA cm−2 were plotted as a function of electrolyte pH, adopted from data in Figures 1b and S2. In the phosphate solutions, the overpotential in the near‐neutral pH region of 5–10 decreased with approaching the pH value of 7, which coincided with the pK a of phosphate H2PO4 −/HPO4 2−, where the buffering capacity is largest.[ 49 , 59 ] Smaller overpotentials at 1 mA cm−2 were observed in the borate and carbonate solutions with pK a values of 9.2 and 10.3, respectively, greater than that of 7.2 for phosphate. Remarkably, in the carbonate solution that has the highest pK a among the employed solutions, the OER performance at 1 mA cm−2 was comparable to that at the alkaline pH value. Nevertheless, at higher reaction rates, the overpotential became larger in the carbonate solution than in NaOH. This inferior performance accompanied a larger Tafel slope of 86±3 mV dec−1 in the carbonate solutions than 50 mV dec−1 in 0.1 mol kg−1 NaOH, which is suggestive of the different species predominantly existing on the surface, that is, *O and *OH in the former and *OH and * (empty site) in the latter. Likewise, when the pH was the same as pK a, the overpotential at larger current densities of 10 mA cm−2 was smaller in the phosphate solution than in borate and carbonate solutions. This switching of the order of the overpotential with pK a means a substantial variation in the Tafel slope with varying pK a values. Lastly, the overpotential of the OER therein proceeding as the OH− oxidation was found to be still inferior to the one at acidic pH evidenced by the oxidation of H2O. The facile reaction in the acidic pH environment could be rationalized by the presence of a free O‐site on the surface of iridium oxide, which functions as the proton acceptor during the OER cycles and, thus, lowers the reaction barrier according to the recent theoretical study. [68]
Figure 5.
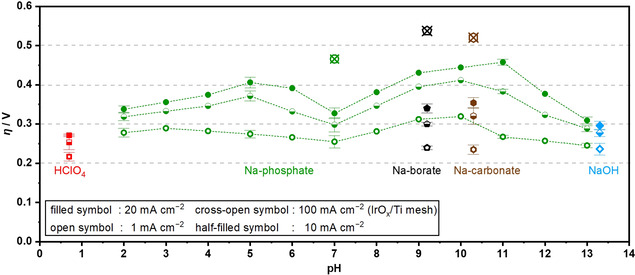
Overpotential of the OER over IrOx in the various solutions. Overpotential achieving 1, 10, and 20 mA cm−2 over the IrOx disk electrode in a RDE configuration and 100 mA cm−2 over the IrOx on Ti mesh are plotted as a function of the pH of the electrolyte bulk. Overpotentials at 1–20 mA cm−2 were recorded in 0.1 mol kg−1 electrolyte solutions at a disk rotation speed of 4900 rpm, a scan rate of −1 mV s−1, and a reaction temperature of 298 K, adopted from data in Figures 1b and S2, and those at 100 mA cm−2 were recorded in 1.0 mol kg−1 buffered solutions at a reaction temperature of 298 K without stirring, adopted from data in Figure S16.
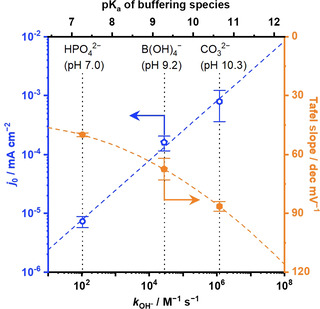
As observed in Figure 5, both the onset potential and the Tafel slope were sensitive to the pK a of the buffering actions, which corresponds to the rate of OH− supply via the acid‐base reaction [forward reaction of Eq. (25)]. The previously reported rate constants for the formation of OH− via Equation (25) (k OH−) [73] are summarized in Figure 6 with respect to the pK a values (see also Table S1 for the pK a and k OH− values). The rate constants k OH− on the logarithmic scale were found to increase with an increase in the pK a values in an almost linear fashion. Fitting the data plotted in Figure 6 yields the following Equation 29:
| (29) |
Figure 6.

Free‐energy relationship for OH− generation by the buffering action. For the OH− generation reactions (A−+H2O→HA+OH−), the forward rate constants k OH− are plotted as a function of pK a. Black‐filled and grey‐open symbols denote data of inorganic and organic buffering species, respectively, adopted from ref. [73] (all values are listed in Table S1). The orange open symbols are calculated with the results obtained for the linear free‐energy relationship shown here.
With this relationship, the rate constant k OH− of HPO4 − and B(OH)4 − were determined to be 1.1×10² and 2.7×10⁴ m −1 s−1, respectively.
To shed light on the origin of the impact of the OH− formation rate on the OER kinetics, the OER rate was deconvoluted into the exchange current density j 0 and the Tafel slope, which are plotted with respect to the thus‐obtained k OH− values in Figure 7. The figure shows that the exchange current density j 0 increased with the rate constants k OH− in an almost linear fashion, consistent with the reaction order to OH− of 1.2 obtained in Na‐phosphate solution. On the other hand, the Tafel slope became larger with the rate constants k OH−. However, because k OH− scales with pK a as discussed in Equation (29), and because the OER testing was performed at pH=pK a, where the buffering capacity is maximized, this correlation between the Tafel slope and k OH− could originate from the electrolyte pH. In fact, such a relationship between the Tafel slope and pH was reported by Suntivich and co‐workers. [28] Their study discussed the free energy of the formation of *OH and *O on IrO2 (110) film using cyclic voltammetry (CV), and reasoned that the formation of *O is more facile at higher pH, which results in the larger Tafel slope value when the *OOH formation is the rds. [28] Consistently, the facile formation of *O relative to *OH was observed at higher pH values in the present study (see Figure S17). The trend lines between j 0 and Tafel slope values in Figure 7 were drawn based on three buffer species. Adding more data points to the figure was not possible at this stage because, for example, the organic buffer cannot be used for the OER where the organic buffer is subject to oxidation, [40] and few commonly employed inorganic buffering agents are functional at near‐neutral pH levels.
Figure 7.
A trade‐off relationship between the exchange current density j 0 and the Tafel slope. Exchange current density j 0 and Tafel slope over the IrOx disk electrode in a RDE configuration are plotted as a function of the rate constants k OH− and corresponding pKa values in Equation (29), which were recorded in 1.0 mol kg−1 electrolyte solutions at a scan rate of −1 mV s−1 and a reaction temperature of 298 K, adopted from data in Figures S9 and S13.
These discussions indicate that at buffered near‐neutral pH, with increasing pK a, (1) the OER rate increases due to the increase in the j 0 via faster in‐situ provision of OH−, and (2) the OER overpotential increases because of the larger Tafel slope values caused by the higher pH set to equal pK a to maximize the buffering capacity. This trade‐off relationship predicts that an OER performance maximum exists with respect to pK a (=pH). With the correlations between the exchange current density and pK a as well as the Tafel slope and pH in Figure 7, OER overpotential was simulated and is plotted as a function of pK a (=pH) in Figure S18. The analysis predicted that at a smaller reaction rate of approximately 1 mA cm−2, pK a (=pH) values of around 8 achieved the minimal overpotential, which shifts toward lower pK a values when a higher reaction rate is reached, for example, around 7 at 100 mA cm−2. Experimentally, additional catalytic testing was performed at a constant current density of 100 mA cm−2 in 1.0 mol kg−1 Na‐phosphate, 1.0 mol kg−1 Na‐borate, and 1.0 mol kg−1 Na‐carbonate, as shown in Figure S16, and the obtained steady‐state overpotentials are compiled in Figure 5. Notably, because the high current density of 100 mA cm−2 in the alkaline condition can easily lead to the degradation of IrOx, [74] this electrocatalytic testing was conducted only in the buffered near‐neutral conditions. Indeed, the figure revealed that the OER overpotential was smaller when pK a (=pH) was closer to 7, validating our analysis: Quantitatively, a current density of 100 mA cm−2 was achieved in Na‐phosphate solution at an overpotential of 466 mV. All in all, the rigorous microkinetic analysis performed in the present study examined and demonstrated the significance of the electrolyte property during the aqueous OER, which has been overlooked in many studies. The conclusion drawn in this study holds universally true as long as the mass‐transport flux is substantially larger than the surface reaction rate, and it is valid irrespective of identity of electrocatalysts as long as the catalyst remains stable. Additional consideration would be thus required if the reaction pathway or the active site change during the OER, which is the case of electrocatalysts such as Co‐based material with a self‐healing property. [75] All in all, the findings reported in the present study forms a basis upon which to develop an efficient water electrolysis system driven at near‐neutral pH levels.
Conclusion
A rigorous microkinetic analysis of the oxygen evolution reaction (OER) was performed in various buffered conditions using the IrOx electrocatalyst. The linear sweep voltammetry (LSV) in buffered conditions universally exhibited smaller overpotentials at near‐neutral pH than in unbuffered conditions at reaction rates on the order of mA cm−2. The analysis of the kinetic order and kinetic isotope effect suggested that not H2O but OH− was the reactant in the buffered conditions. Consistently, the temperature sensitivity analysis found that the difference between apparent activation energies in the buffered and NaOH solutions quantitatively coincided with the enthalpy of the buffering equilibria. These findings indicate that the added buffering species function to maintain the local pH by supplying OH− during the OER, whereby the electrocatalyst continues consuming the OH− reactant, discarding the possibility of H2O oxidation followed by H+ removal facilitated by the buffer. While the exchange current density increased with higher pK a buffers due to the facile OH− supply via buffering action, the Tafel slope values were larger at higher pH values due to the facile formation of *O intermediate. Such a trade‐off relationship helped pin down the optimal pK a of the buffers to be used to minimize the OER overpotential at a given current density. The findings reported in the present study revealed the significance of electrolyte engineering to maximize the OER performance, universally applicable to other aqueous electrocatalysis, which leads to the development of a highly efficient system at near‐neutral pH levels.
Experimental Section
All chemicals used in this study were purchased with the following purities from Merck: HClO4 (assay 70 %), NaClO4⋅xH2O (assay 99.99 %), NaOH (99.99 %), H3PO4 (99.99 %), H3BO3 (≥99.5 %), Na2CO3⋅H2O (≥99.5 %), Na3IrCl6⋅xH2O, H2C2O4 (≥99 %), HCl (37 wt% in H2O), KCl (99.999 %), D2O (99 at% D), NaOD (30 wt% in D2O, 99 at% D), and D3PO4 (85 wt% in D2O, 98 at% D).
IrOx electrodes were fabricated by electrochemical deposition following a reported protocol [76] with a titanium disk electrode or titanium mesh as the substrate. The deposition bath contained 4 mM of Na3IrCl6⋅xH2O and 20 mm of H2C2O4, into which Na2CO3⋅H2O was added to adjust the pH level to 10. Subsequently, after being kept at 308 K for 4 days, the solution was used for the electrochemical deposition. In parallel, a Ti disk electrode with a diameter of 3.0 mm (BAS, Inc.) was polished first with 1 μm diamond and then with 0.05 μm alumina (both purchased from BAS, Inc.). Also, a Ti mesh with a geometric size of 1×1 cm2 was employed as a substrate, which was washed by immersion in 0.1 mol kg−1 HCl, ultrapure water, and ethanol sequentially for 5 min each. Finally, electrochemical deposition of IrOx was carried out on the Ti disk electrode or Ti mesh immersed in the prepared deposition bath by applying a constant current density of 140 μA cm−2 for 10 ks in a three‐electrode configuration with Ir wire and Hg/Hg2Cl2 (saturated with KCl) as the counter and reference electrodes, respectively. The fabricated electrode was evaluated by CV in 0.1 mol kg−1 HClO4 to ensure that the electrodes had identical properties before electrocatalytic measurements.
For the electrocatalytic testing, a variety of unbuffered and buffered aqueous solutions were employed as the electrolyte. As a typical case, when preparing 250 g of 0.1 mol kg−1 aqueous Na‐phosphate solution with the total molarity of phosphate anion at 0.1 mol kg−1, 2.45 g of H3PO4 was firstly put in approximately 200 g of ultrapure water (18.2 MΩ cm) with vigorous stirring. Then, 0.1 or 1.0 mol kg−1 NaOH was added to the solution to adjust the pH value of the solution while the pH was concurrently measured using a pH meter (D‐71 and 9625, HORIBA). Finally, ultrapure water was poured into the solution until the total weight reached 250 g. Then the pH value of the prepared solution was measured, which is referenced throughout the present study. For the electrocatalytic measurement in the D2O system, H2O, NaOH, and H3PO4 were replaced by D2O, NaOD, and D3PO4, respectively. The pD of the solution was determined based on the pH value measured by the pH meter and the relationship that pD is equal to the pH value+0.4.
Electrocatalytic testing was performed using the IrOx/Ti electrodes (denoted as IrOx in present study for simplicity) in the three‐electrode system with Ir wire and Hg/Hg2Cl2 (saturated with KCl) or Hg/HgO (1.0 m NaOH) electrodes as the counter and reference electrodes, respectively. A RDE configuration at varying disk‐rotation speeds was employed when the IrOx deposited on the Ti disk served as the working electrode, while measurements using the IrOx deposited on the Ti mesh substrates were conducted without forced convection, that is, without stirring. For the study using D2O, Hg/Hg2Cl2 (saturated with KCl in D2O) was instead employed as a reference electrode. Before and during all measurements, O2 gas (≥99.99995 %) was continuously supplied to the cell. CV, LSV, chronopotentiometry (CP), and potentiostatic electrochemical impedance spectroscopy (PEIS) were conducted using a 16‐channel research‐grade potentiostat system (VMP3, BioLogic Science Instruments). In all LSV profiles, a cathodic scan at a negative scan rate was used to isolate the contribution from the oxidation of iridium species to the overall electric current. The above measurements were conducted at various temperatures of 298, 313, 328, and 343 K, and electrochemical cells employed at the latter three temperatures were equipped with a water jacket (Water‐Jacket glass cell, BAS Inc.) connected to an external temperature‐control system (NCB‐1210 A, EYELA). For measurements at varying temperatures, the reference electrode was connected to the electrochemical cell through an extension jacket to maintain the temperature of the reference electrode at 298 K; the potential in this study is reported with respect to the SHE scale at 298 K. For the conversion of the potential scale to the SHE, constant values of 0.240 and 0.114 V were added to the potential values for Hg/Hg2Cl2 and Hg/HgO, respectively, regardless of pH values, which were experimentally calibrated by measuring H+/H2 redox reaction using Pt. Overpotential for the OER was calculated based on the equilibrium potential for the OER at each temperature, for example, 1.23 V vs. SHE at 298 K and 1.19 V vs. SHE at 343 K at pH 0. The error bars reported are the standard deviation and the difference in the data values obtained from three and two independently performed experiments, respectively. All current densities are expressed in terms of the geometric electrode surface area unless otherwise noted, and all current‐potential relationships were iR‐corrected using impedance values measured at a frequency ≥100 kHz with an amplitude of 10 mV.
Conflict of interest
The authors declare no conflict of interest.
Supporting information
As a service to our authors and readers, this journal provides supporting information supplied by the authors. Such materials are peer reviewed and may be re‐organized for online delivery, but are not copy‐edited or typeset. Technical support issues arising from supporting information (other than missing files) should be addressed to the authors.
Supplementary
Acknowledgements
A part of this work was supported by JSPS KAKENHI Grant Number 19 K23569 and UTokyo‐KAUST collaborative research OSR #4191 “Towards Sustainable Production of H2”.
T. Nishimoto, T. Shinagawa, T. Naito, K. Takanabe, ChemSusChem 2021, 14, 1554.
References
- 1. Chu S., Majumdar A., Nature 2012, 488, 294–303. [DOI] [PubMed] [Google Scholar]
- 2. King L. A., Hubert M. A., Capuano C., Manco J., Danilovic N., Valle E., Hellstern T. R., Ayers K., Jaramillo T. F., Nat. Nanotechnol. 2019, 14, 1071–1074. [DOI] [PubMed] [Google Scholar]
- 3. Shaner M. R., Atwater H. A., Lewis N. S., McFarland E. W., Energy Environ. Sci. 2016, 9, 2354–2371. [Google Scholar]
- 4. You B., Sun Y., Acc. Chem. Res. 2018, 51, 1571–1580. [DOI] [PubMed] [Google Scholar]
- 5. Dionigi F., Strasser P., Adv. Energy Mater. 2016, 6, 1600621. [Google Scholar]
- 6. Zeng K., Zhang D., Prog. Energy Combust. Sci. 2010, 36, 307–326. [Google Scholar]
- 7. Yu J., He Q., Yang G., Zhou W., Shao Z., Ni M., ACS Catal. 2019, 9, 9973–10011. [Google Scholar]
- 8. Marshall A., Børresen B., Hagen G., Tsypkin M., Tunold R., Energy 2007, 32, 431–436. [Google Scholar]
- 9. Eisenberg R., Gray H. B., Inorg. Chem. 2008, 47, 1697–1699. [DOI] [PubMed] [Google Scholar]
- 10. Kanan M. W., Nocera D. G., Science 2008, 321, 1072–1075. [DOI] [PubMed] [Google Scholar]
- 11. Suen N.-T., Hung S.-F., Quan Q., Zhang N., Xu Y.-J., Chen H. M., Chem. Soc. Rev. 2017, 46, 337. [DOI] [PubMed] [Google Scholar]
- 12. Reier T., Nong H. N., Teschner D., Schlögl R., Strasser P., Adv. Energy Mater. 2017, 7, 1601275. [Google Scholar]
- 13. Jamesh M.-I., Sun X., J. Power Sources 2018, 400, 31–68. [Google Scholar]
- 14. Carmo M., Fritz D. L., Mergel J., Stolten D., Int. J. Hydrogen Energy 2013, 38, 4901–4934. [Google Scholar]
- 15. Lee Y., Suntivich J., May K. J., Perry E. E., Shao-Horn Y., J. Phys. Chem. Lett. 2012, 3, 399–404. [DOI] [PubMed] [Google Scholar]
- 16. Wei C., Rao R. R., Peng J., Huang B., Stephens I. E. L., Risch M., Xu Z. J., Shao-Horn Y., Adv. Mater. 2019, 31, 1806296. [DOI] [PubMed] [Google Scholar]
- 17. Montoya J. H., Seitz L. C., Chakthranont P., Vojvodic A., Jaramillo T. F., Nørskov J. K., Nat. Mater. 2016, 16, 70–81. [DOI] [PubMed] [Google Scholar]
- 18. Özer E., Spçri C., Reier T., Strasser P., ChemCatChem 2017, 9, 597–603. [Google Scholar]
- 19. Diaz-Morales O., Ferrus-Suspedra D., Koper M. T. M., Chem. Sci. 2016, 7, 2639. [DOI] [PMC free article] [PubMed] [Google Scholar]
- 20. Merrill M. D., Dougherty R. C., J. Phys. Chem. C 2008, 112, 3655–3666. [Google Scholar]
- 21. Song F., Bai L., Moysiadou A., Lee S., Hu C., Liardet L., Hu X., J. Am. Chem. Soc. 2018, 140, 7748–7759. [DOI] [PubMed] [Google Scholar]
- 22. Li A., Ooka H., Bonnet N., Hayashi T., Sun Y., Jiang Q., Li C., Han H., Nakamura R., Angew. Chem. Int. Ed. 2019, 58, 5054–5058; [DOI] [PubMed] [Google Scholar]; Angew. Chem. 2019, 131, 5108–5112. [Google Scholar]
- 23. Rossmeisl J., Logadottir A., Nørskov J. K., Chem. Phys. 2005, 319, 178–184. [Google Scholar]
- 24. Trasatti S., Electrochim. Acta 1984, 29, 1503–1512. [Google Scholar]
- 25. Man I. C., Su H.-Y., Calle-Vallejo F., Hansen H. A., Martínez J. I., Inoglu N. G., Kitchin J., Jaramillo T. F., Nørskov J. K., Rossmeisl J., ChemCatChem 2011, 3, 1159–1165. [Google Scholar]
- 26. Seitz L. C., Dickens C. F., Nishio K., Hikita Y., Montoya J., Doyle A., Kirk C., Vojvodic A., Hwang H. Y., Nørskov J. K., Jaramillo T. F., Science 2016, 353, 1011–1014. [DOI] [PubMed] [Google Scholar]
- 27. Rossmeisl J., Qu Z.-W., Zhu H., Kroes G.-J., Nørskov J. K., J. Electroanal. Chem. 2007, 607, 83–89. [Google Scholar]
- 28. Kuo D.-Y., Kawasaki J. K., Nelson J. N., Kloppenburg J., Hautier G., Shen K. M., Schlom D. G., Suntivich J., J. Am. Chem. Soc. 2017, 139, 3473–3479. [DOI] [PubMed] [Google Scholar]
- 29. Ooka H., Yamaguchi A., Takashima T., Hashimoto K., Nakamura R., J. Phys. Chem. C 2017, 121, 17873–17881. [Google Scholar]
- 30. Steegstra P., Ahlberg E., Electrochim. Acta 2012, 76, 26–33. [Google Scholar]
- 31. McCrory C. C. L., Jung S., Ferrer I. M., Chatman S. M., Peters J. C., Jaramillo T. F., J. Am. Chem. Soc. 2015, 137, 4347–4357. [DOI] [PubMed] [Google Scholar]
- 32. Gorlin Y., Jaramillo T. F., J. Am. Chem. Soc. 2010, 132, 13612–13614. [DOI] [PubMed] [Google Scholar]
- 33. Browne M. P., Stafford S., O′Brien M., Nolan H., Berner N. C., Duesberg G. S., Colavita P. E., Lyons M. E. G., J. Mater. Chem. A 2016, 4, 11397. [Google Scholar]
- 34. Shinagawa T., Takanabe K., ChemSusChem 2017, 10, 1318–1336. [DOI] [PMC free article] [PubMed] [Google Scholar]
- 35. McCrory C. C. L., Jung S., Peters J. C., Jaramillo T. F., J. Am. Chem. Soc. 2013, 135, 16977–16987. [DOI] [PubMed] [Google Scholar]
- 36. Shinagawa T., Cao Z., Cavallo L., Takanabe K., J. Energy Chem. 2017, 26, 259–269. [Google Scholar]
- 37. Nocera D. G., ChemSusChem 2009, 2, 387–390. [DOI] [PubMed] [Google Scholar]
- 38. Nocera D. G., Inorg. Chem. 2009, 48, 10001–10017. [DOI] [PMC free article] [PubMed] [Google Scholar]
- 39. Giordano L., Hong B., Risch H., Hong W. T., Rao R. R., Stoerzinger K. A., Shao-Horn Y., Catal. Today 2016, 262, 2–10. [Google Scholar]
- 40. Shinagawa T., Ng M. T.-K., Takanabe K., ChemSusChem 2017, 10, 4155–4162. [DOI] [PubMed] [Google Scholar]
- 41. Nishimoto T., Shinagawa T., Naito T., Takanabe K., J. Catal. 2020, 391, 435–445. [Google Scholar]
- 42. Katsounaros I., Meier J. C., Klemm S. O., Topalov A. A., Biedermann P. U., Auinger M., Mayrhofer K. J. J., Electrochem. Commun. 2011, 13, 634–637. [DOI] [PubMed] [Google Scholar]
- 43. Auinger M., Katsounaros I., Meier J. C., Klemm S. O., Biedermann P. U., Topalov A. A., Rohwerder M., Mayrhofer K. J. J., Phys. Chem. Chem. Phys. 2011, 13, 16384–16394. [DOI] [PubMed] [Google Scholar]
- 44. Yokoyama Y., Miyazaki K., Miyahara Y., Fukutsuka T., Abe T., ChemElectroChem 2019, 6, 4750–4756. [Google Scholar]
- 45. Labrador N. Y., Songcuan E. L., De Silva C., Chen H., Kurdziel S. J., Ramachandran R. K., Detavernier C., Esposito D. V., ACS Catal. 2018, 8, 1767–1778. [Google Scholar]
- 46. Esposito D. V., ACS Catal. 2018, 8, 457–465. [Google Scholar]
- 47. Conway B. E., Tilak B. V. in Advances in Catalysis, Vol. 38 (Eds.: Eley D. D., Pines H., Weisz P. B.), Academic Press, New York, 1992, pp. 78–98. [Google Scholar]
- 48. Surendranath Y., Kanan M. W., Nocera D. G., J. Am. Chem. Soc. 2010, 132, 16501–16509. [DOI] [PubMed] [Google Scholar]
- 49. Dau H., Pasquini C., Inorganics 2019, 7, 20. [Google Scholar]
- 50. Yamaguchi A., Inuzuka R., Takashima T., Hayashi T., Hashimoto K., Nakamura R., Nat. Commun. 2014, 5, 4256. [DOI] [PMC free article] [PubMed] [Google Scholar]
- 51. Owe L.-E., Tsypkin M., Sunde S., Electrochim. Acta 2011, 58, 231–237. [Google Scholar]
- 52. Savizi I. S. P., Janik M. J., Electrochim. Acta 2011, 56, 3996–4006. [Google Scholar]
- 53. Gisbert R., García G., Koper M. T. M., Electrochim. Acta 2010, 55, 7961–7968. [Google Scholar]
- 54. Perales-Rondón J. V., Brimaud S., Solla-Gullón J., Herrero E., Behm R. J., Feliu J. M., Electrochim. Acta 2015, 180, 479–485. [Google Scholar]
- 55. Bard A. J., Faulkner L. R., Electrochemical Methods: Fundamentals and Applications, Wiley, New York, NY, 2010. [Google Scholar]
- 56. Zhao Y., Vargas-Barbosa N. M., Hernandez-Pagan E. A., Mallouk T. E., Small 2011, 7, 2087–2093. [DOI] [PubMed] [Google Scholar]
- 57. Jung S., McCrory C. C. L., Ferrer I. M., Peters J. C., Jaramillo T. F., J. Mater. Chem. A 2016, 4, 3068. [Google Scholar]
- 58. Haynes W. M., Lide D. R., Handbook of Chemistry and Physics, 92nd ed., CRC Press, Boca Raton, FL, 2011. [Google Scholar]
- 59. Obata K., Stegenburga L., Takanabe K., J. Phys. Chem. C 2019, 123, 21554–21563. [Google Scholar]
- 60. Selvam N. C. S., Du L., Xia B. Y., Yoo P. J., You B., Adv. Funct. Mater. 2020, 30, 2008190. [Google Scholar]
- 61. Montoya J. H., Seitz L. C., Chakthranont P., Vojvodic A., Jaramillo T. F., Nørskov J. K., Nat. Mater. 2017, 16, 70–81. [DOI] [PubMed] [Google Scholar]
- 62. Kasian O., Grote J.-P., Geiger S., Cherevko S., Mayrhofer K. J. J., Angew. Chem. Int. Ed. 2018, 57, 2488–2491; [DOI] [PMC free article] [PubMed] [Google Scholar]; Angew. Chem. 2018, 130, 2514–2517. [Google Scholar]
- 63. Grimaud A., Demortière A., Saubanère M., Dachraoui W., Duchamp M., Doublet M.-L., Tarascon J.-M., Nat. Energy 2016, 2, 16189. [Google Scholar]
- 64. Grimaud A., Diaz-Morales O., Han B., Hong W. T., Lee Y.-L., Giordano L., Stoerzinger K. A., Koper M. T. M., Shao-Horn Y., Nat. Chem. 2017, 9, 457–465. [DOI] [PubMed] [Google Scholar]
- 65. Zagalskaya A., Alexamdrov V., ACS Catal. 2020, 10, 3650–3657. [Google Scholar]
- 66. Shinagawa T., Garcia-Esparza A. T., Takanabe K., Sci. Rep. 2015, 5, 13801. [DOI] [PMC free article] [PubMed] [Google Scholar]
- 67. Sanchez Casalongue H. G., Ng M. L., Kaya S., Friebel D., Ogasawara H., Nilsson A., Angew. Chem. Int. Ed. 2014, 53, 7169–7172; [DOI] [PubMed] [Google Scholar]; Angew. Chem. 2014, 126, 7297–7300. [Google Scholar]
- 68. Ping Y., Nielsen R. J., Goddard W. A. III, J. Am. Chem. Soc. 2017, 139, 149–155. [DOI] [PubMed] [Google Scholar]
- 69. Tse E. C. M., Hoang T. T. H., Varnell J. A., Gewirth A. A., ACS Catal. 2016, 6, 5706–5714. [Google Scholar]
- 70. Atkins P., Paula J. D., Atkins’ Physical Chemistry, 8th ed., W. H. Freeman and Company, New York, 2006. [Google Scholar]
- 71. Li J., Li B., Gao S., Phys. Chem. Miner. 2000, 27, 342–346. [Google Scholar]
- 72. Shock E. L., Helgeson H. C., Sverjensky D. A., Geochim. Cosmochim. Acta 1989, 53, 2157–2183. [DOI] [PubMed] [Google Scholar]
- 73. Eigen E., Angew. Chem. Int. Ed. 1964, 3, 1–19; [Google Scholar]; Angew. Chem. 1963, 75, 489–508. [Google Scholar]
- 74. Naito T., Shinagawa T., Nishimoto T., Takanabe K., ChemSusChem 2020, 13, 5921–5933. [DOI] [PMC free article] [PubMed] [Google Scholar]
- 75. Costentin C., Nocera D. G., Proc. Natl. Acad. Sci. USA 2017, 114, 13380–13384. [DOI] [PMC free article] [PubMed] [Google Scholar]
- 76. Petit M. A., Plichon V., J. Electroanal. Chem. 1998, 444, 247–252. [Google Scholar]
Associated Data
This section collects any data citations, data availability statements, or supplementary materials included in this article.
Supplementary Materials
As a service to our authors and readers, this journal provides supporting information supplied by the authors. Such materials are peer reviewed and may be re‐organized for online delivery, but are not copy‐edited or typeset. Technical support issues arising from supporting information (other than missing files) should be addressed to the authors.
Supplementary