Abstract
Phospholipase D (PLD) isoforms PLD1 and PLD2 serve as the primary nodes where diverse signaling pathways converge. However, their isoform‐specific functions remain unclear. We showed that PLD1 and PLD2 selectively couple to toll‐like receptor 4 (TLR4) and interleukin 4 receptor (IL‐4R) and differentially regulate macrophage polarization of M1 and M2 via the LPS–MyD88 axis and the IL‐4–JAK3 signaling, respectively. Lipopolysaccharide (LPS) enhanced TLR4 or MyD88 interaction with PLD1; IL‐4 induced IL‐4R or JAK3 association with PLD2, indicating isozyme‐specific signaling events. PLD1 and PLD2 are indispensable for M1 polarization and M2 polarization, respectively. Genetic and pharmacological targeting of PLD1 conferred protection against LPS‐induced sepsis, cardiotoxin‐induced muscle injury, and skin injury by promoting the shift toward M2; PLD2 ablation intensified disease severity by promoting the shift toward M1. Enhanced Foxp3+ regulatory T cell recruitment also influenced the anti‐inflammatory phenotype of Pld1 LyzCre macrophages. We reveal a previously uncharacterized role of PLD isoforms in macrophage polarization, signifying potential pharmacological interventions for macrophage modulation.
Keywords: IL‐4R, inflammation, macrophage polarization, phospholipase D, tissue homeostasis, TLR‐4
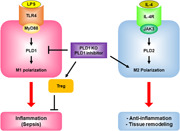
LPS and IL‐4 selectively activate PLD1 and PLD2 via TLR4 and IL‐4R, respectively. PLD isozyme‐specific function is mediated by LPS‐ and IL‐4‐triggered signaling via the MyD88 and JAK3 axis, followed by differential control of M1 and M2 macrophage polarization. PLD1 and PLD2 are indispensable for the polarization of M1 and M2, respectively, and reciprocally regulate macrophage polarization.
1. INTRODUCTION
Phospholipase D (PLD) isozymes, PLD1 and PLD2, generate phosphatidic acid (PA) by hydrolyzing phosphatidylcholine (PC) upon activation by various cell‐surface receptors (Brown et al., 2017; Bruntz et al., 2014; Kang et al., 2011; Tanguy et al., 2019). However several pathway components involved in PLD activation remain undefined. PLD plays important roles in vesicular trafficking, cytoskeletal organization, phagocytosis, metabolic regulation, and proliferation. PLD knockout mice and isoform‐specific inhibitors are currently being used to delineate the various physiological roles of PLD isoforms (Brown et al., 2017; Frohman, 2015; Stieglitz, 2018). However, it is unclear whether the PLD isozymes are coupled to selective receptors to control specific biochemical pathway. Most previous studies have employed experimental approaches that do not distinguish between different PLD isozymes. PLD plays a key role in neutrophil‐ and macrophage‐initiated inflammation in several disease states including chronic inflammation and cardiovascular disease (Ali et al., 2013; Bruntz et al., 2014; Frohman, 2015; Kang et al., 2014; Kantonen et al., 2011; Knapek et al., 2010). Recently, a spectrum of macrophage activation states extending the current M1‐ versus M2‐polarization model has been reported (Xue et al., 2014). It is now established that macrophages can reversibly and dynamically switch from one activation state to the other. M1 macrophages, promoted by lipopolysaccharide (LPS), interferon‐gamma (IFN‐γ), or both, exert pro‐inflammatory and antimicrobial functions (Lolmede et al., 2009). T helper 2 (Th2)‐cell‐associated cytokines such as interleukin‐4 (IL‐4) drive macrophages into the M2 state to mediate anti‐inflammatory functions and tissue repair (Biswas & Mantovani, 2010). Although there are several regulators of polarization “switching” by ablation of different pathways including AKT isoforms and regulators of the mTOR pathway, alterations in macrophage polarization (M1–M2 and M2–M1) appear more complex to explain at the molecular level and warrant increased attention (Murray, 2017). Since PLD is involved in the regulation of macrophage‐mediated inflammation (Ali et al., 2013; Bruntz et al., 2014; Kang et al., 2014) and other phospholipases including phospholipase A2β and phospholipase Cβ2 (Grinberg et al., 2009; Nelson et al., 2020; Shukla et al., 2017) regulate macrophage polarization, we attempted to investigate the role of PLD in macrophage polarization in this study. Although PLD is necessary for cellular responses to inflammation, the biology of PLD isoforms in macrophages remains poorly understood, and little is known about the regulation and function of isoform‐specific PLD. In the present study, we demonstrated that PLD isoforms differentially control macrophage polarization by regulating signaling events induced by LPS and IL‐4 and may serve as potential targets for pharmacological intervention of polarization‐associated diseases.
2. MATERIALS AND METHODS
2.1. Mice
Pld1 LyzCre and Pld2 LyzCre C57/BL6 mice were obtained by crossing Pld1 f/f or Pld2 f/f mice with LysM cre mice. FoxP3 RFP mice were gifted by R. H. Seoung (Seoul National University, Korea). Mice were placed in a specific pathogen‐free facility and employed in experiments at the age of 6–8 weeks. Animal studies were approved by the Institutional Animal Care and Use Committee of Pusan National University (Approval number #20171584 and #20171770).
2.2. LPS‐induced endotoxin shock
Sepsis was induced in mice using a previously described method (Arranz et al., 2012). Age‐matched mice were injected intraperitoneally with a minimal lethal dose of LPS (1.5 mg/kg body weight, Sigma Aldrich) or phosphate‐buffered saline (PBS). Survival after LPS injection was monitored. Blood was collected from the tail vein 6 h after LPS injection. The neutralizing antibodies for CCL5, CCL22, and CCL28 (each 0.1 mg) were injected intraperitoneally, 3 h after LPS challenge. The PLD1 inhibitor (VU0155069; 10 mg/kg body weight, Cayman Chemical) or vehicle was injected intraperitoneally every day after LPS challenge.
2.3. Cardiotoxin‐induced muscle injury
Muscle damage was induced as previously reported (Heredia et al., 2013). Age‐matched mice were anesthetized using 2.5% Avertin (Sigma Aldrich) and received 50 μl of 20 mM Naja naja atra cardiotoxin (CTX, Sigma Aldrich) directly into one of the tibialis anterior muscles using a 27‐gauge needle. The uninjured contralateral muscle was injected with the same volume of PBS. To assess muscle damage, mice were administered an intraperitoneal injection of Evans blue dye (25 mg/kg) 24 h before euthanization. For the study of polarization phenotype, mice were injected with VU0155069 (10 mg/kg of body weight) or vehicle intraperitoneally every day. Muscle samples were collected at 5 or 8 day following CTX injection.
2.4. Wound‐healing model
The wound‐healing model was produced as previously described (Wang et al., 2013). Mice were anesthetized using 2.5% Avertin; their backs were shaved and then cleaned with povidone–iodine and 75% ethanol. The dorsal skin of the chest was pulled from the midline with fingers and holes were created through the folded skin (both layers) using a 6‐mm‐diameter sterile biopsy punch, creating two symmetrical full‐thickness excisional wounds beside the midline. Subsequently, every 2 day, each wound was digitally photographed, and wound areas were quantified using a digital caliper. Changes in the wound area over time were expressed as a percentage of the initial (D0) wound area. Mice were injected with a PLD1 inhibitor (10 mg/kg, VU0155069) once every 3 day after wound creation.
2.5. Statistical analysis
The results are expressed as the mean ± SD of the determinations. The statistical significance of the differences was determined by one‐way or two‐way analysis of variance, and significance was accepted when p < .05, which was considered statistically significant. Survival data were analyzed using log‐rank tests of Kaplan–Meier curves. Statistical analysis was performed using Prism 8.0 (GraphPad).
3. RESULTS
3.1. PLD1 and PLD2 were selectively activated and coupled to TLR4 and IL‐4R, respectively
To investigate the cognate receptors that are coupled to PLD isozymes, mice that specifically lacked PLD1 or PLD2 expression in macrophages were generated by crossing Pld1 f/f or Pld2 f/f mice with LysM cre mice, following which bone marrow‐derived macrophages (BMDMs) were isolated. PLD1 or PLD2 protein was expressed in Pld LyzCre BMDMs (Figure 1a). The BMDMs were treated with LPS or IL‐4, which induce macrophages to acquire either the M1 polarization state or the M2 polarization state, respectively, and PLD activity was measured. LPS augmented total PLD activity in B6LyzCre and Pld2 LyzCre BMDMs, but not in Pld1 LyzCre BMDMs (Figure 1a). Therefore, it was implied that LPS‐stimulated PLD activity is due to PLD1, which appears to be the transducer of signals mediated by toll‐like receptor 4 (TLR4). TLR4, a critical signaling receptor for LPS, plays a vital role in mediating innate and acquired immunity (Saitoh et al., 2004). In contrast, IL‐4 treatment significantly augmented PLD activity in B6LyzCre and Pld1 LyzCre BMDMs but not in Pld2 LyzCre BMDMs (Figure 1a); consequently, it was deduced that IL‐4‐induced PLD activation is due to PLD2 (Figure 1a). We further examined whether the activity of PLD isozymes was selectively coupled with a specific receptor. Inhibition of TLR4 and TAK‐242 significantly suppressed LPS‐induced PLD1 activation in B6LyzCre and Pld2 LyzCre BMDMs (Figure 1b). The IL‐4 receptor (IL‐4R) blocking antibody abolished IL‐4‐induced PLD2 activation in B6LyzCre and Pld1 LyzCre BMDMs (Figure 1c), indicating that PLD1 and PLD2 are selectively activated by and coupled to TLR4 and IL‐4R, respectively.
Figure 1.
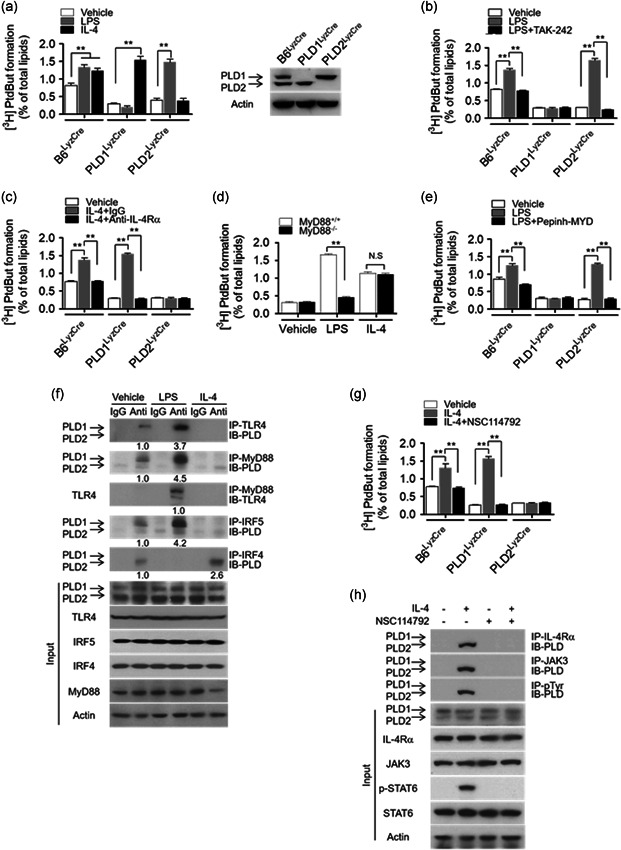
PLD1 and PLD2 are selectively activated and coupled to the TLR4–MyD88 axis and IL‐4R/JAK3 axis, respectively. (a) PLD activity was measured in B6LyzCre, Pld1 LyzCre, and Pld2 LyzCre BMDMs after treatment with LPS (100 ng/ml) or IL‐4 (20 ng/ml) for 1 h (left panel). PLD1 and PLD2 expression in the indicated BMDMs was analyzed by western blot (right panel). (b) Effect of TAK‐242 (10 μM) on LPS‐induced PLD activation in the BMDMs (c) Effect of IL‐4Rα blocking antibody (1 μg/ml) on IL‐4‐induced PLD activation in the BMDMs (c). (d) LPS‐ or IL‐4‐induced PLD activity was measured in Myd88 −/− BMDMs. (e) Effect of pepinh‐MYD (10 μM) on LPS‐induced PLD activation in BMDMs from the indicated mice. (f) BMDMs were treated with LPS or IL‐4 for 1 h, and the lysates were analyzed by immunoprecipitation (IP) or immunoblotting (IB) or both. (g) Effect of JAK3 inhibitor (NSC114792, 10 μM) on IL‐4‐induced PLD activity in BMDMs from the indicated mice. (h) BMDMs were pretreated with NSC114792 (10 mM) for 1 h, and the lysates were analyzed by IP and IB. The intensity of the indicated bands was normalized to the intensity of their respective actin bands and quantified against each other. NS (nonsignificant), ∗∗ p < .001 (two‐way ANOVA). Results are representative of at least five independent experiments and presented as the mean ± SD. ANOVA, analysis of variance; BMDMs, bone marrow‐derived macrophages; IL, interleukin; LPS, lipopolysaccharide; PLD, Phospholipase D
3.2. LPS‐induced PLD1 activation and IL‐4‐induced PLD2 activation were mediated via the MyD88 and JAK3 axis, respectively
To investigate how PLD isozymes are differentially activated in macrophages, we examined the involvement of downstream signaling molecules of the TLR4 and IL‐4R pathways. When TLR4 is activated by LPS, MyD88, an adapter molecule, is recruited as a dimer to the cytoplasmic domain of TLR4. MyD88 dimerization propagates the signal downstream of the receptors, with the consequent activation of intracellular signaling molecules such as TRAF6 (Kovarik et al., 1998; Lin et al., 2010; Yamamoto et al., 2003). LPS‐induced PLD1 activation was significantly suppressed in Myd88 −/− macrophages, but IL‐4‐induced PLD2 activation was unaffected by MyD88 ablation (Figure 1d). Moreover, an inhibitor of MyD88 dimerization (pepinh‐MYD) significantly abolished LPS‐induced PLD1 activation in B6LyzCre and Pld2 LyzCre BMDMs (Figure 1e). However, LPS did not affect PLD1 activity in Traf6‐depleted macrophages (Figure S1). These results indicated that MyD88 is involved in LPS‐induced PLD1 activation. We further investigated whether LPS or IL‐4 influenced the interaction of their receptors or downstream molecules with PLD isozymes. Notably, LPS enhanced the interaction of TLR4 or MyD88 with PLD1 but not with PLD2 (Figure 1f). In the control experiment, LPS induced MyD88 interaction with TLR4. IRF4 interacts with MyD88 and acts as a negative regulator of TLR signaling by competing with IRF5 for MyD88 interaction (Negishi et al., 2005). LPS enhanced the interaction of IRF5 with PLD1 but not with PLD2; conversely, IL‐4 improved the association of IRF4 with PLD2 but not with PLD1 (Figure 1f). However, IL‐4 did not affect the interaction of PLD1 with TLR4, MyD88, or IRF5 (Figure 1f). Moreover, PLD1 enhanced the binding of MyD88 to IRF5, but PLD2 abolished this interaction (Figure S2). IRF4 abolished the interaction of PLD1 with MyD88 or IRF5 (Figure S2). Thus, PLD2 might prevent the LPS‐induced interaction of IRF5 with MyD88 by inducing complex formation with IRF4. These results suggested that PLD1 is activated by interacting with MyD88 in an LPS‐dependent manner, thus positively regulating TLR4 signaling. We further investigated the signaling mechanisms underlying IL‐4‐induced PLD2 activation. Binding of IL‐4 to the type I IL‐4R complex phosphorylates JAK3. Depletion of JAK3, but not STAT6, significantly suppressed IL‐4‐induced PLD2 activation (Figure S3a). Moreover, NSC114792, a JAK3 inhibitor, significantly abolished IL‐4‐induced PLD2 activation in B6LyzCre and Pld1 LyzCre BMDMs (Figure 1g), implying that JAK3 is required for IL‐4‐induced PLD2 activation. Notably, IL‐4 induced the association of IL‐4R or JAK3 with PLD2 but not with PLD1 (Figure 1h, Figure S3b), and LPS had no effect on this interaction (Figure S3b). IL‐4 also induced tyrosine phosphorylation of PLD2 but not of PLD1 (Figure 1h, Figure S3b). Moreover, the JAK3 inhibitor abolished the IL‐4‐induced association of PLD2 with JAK3 and the tyrosine phosphorylation of PLD2 (Figure 1h). The mutated Tyr‐415 residue of PLD2 (PLD2‐Y415F), which is phosphorylated by JAK3 (Ye et al., 2013), significantly inhibited IL‐4‐induced PLD2 activation (Figure S3c), indicating that JAK3‐mediated Tyr‐415 phosphorylation of PLD2 is required for IL‐4‐induced PLD2 activation. Moreover, PLD2‐Y415F abolished IL‐4‐induced phosphorylation of PLD2 and its interaction with JAK3 (Figure S3d), indicating that Tyr‐415 of PLD2 is required for its interaction with JAK3. Collectively, these results signified that LPS‐induced PLD1 activation and IL‐4‐induced PLD2 activation are mediated via the MyD88 and JAK3 signaling axes, respectively.
3.3. PLD1 and PLD2 were required for polarization of M1 and M2, triggered by LPS and IL‐4, respectively
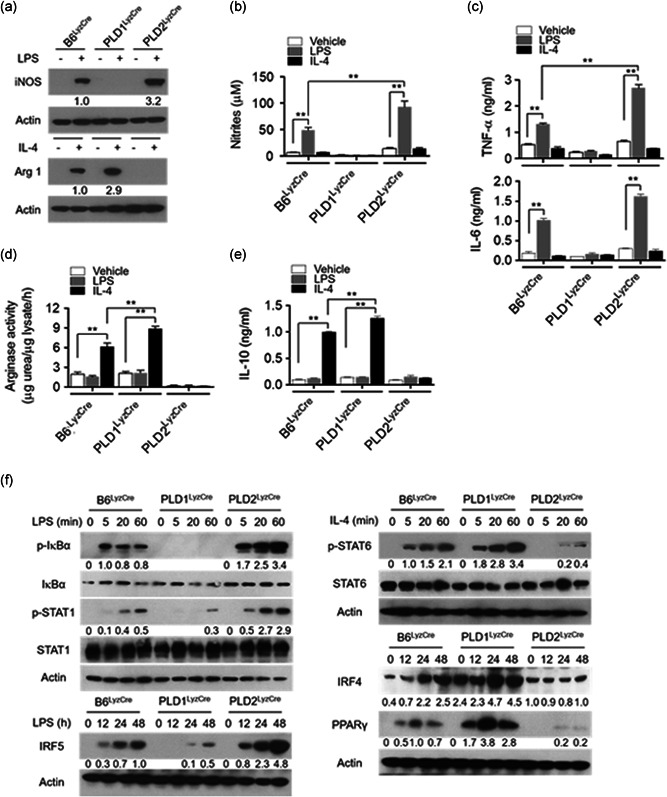
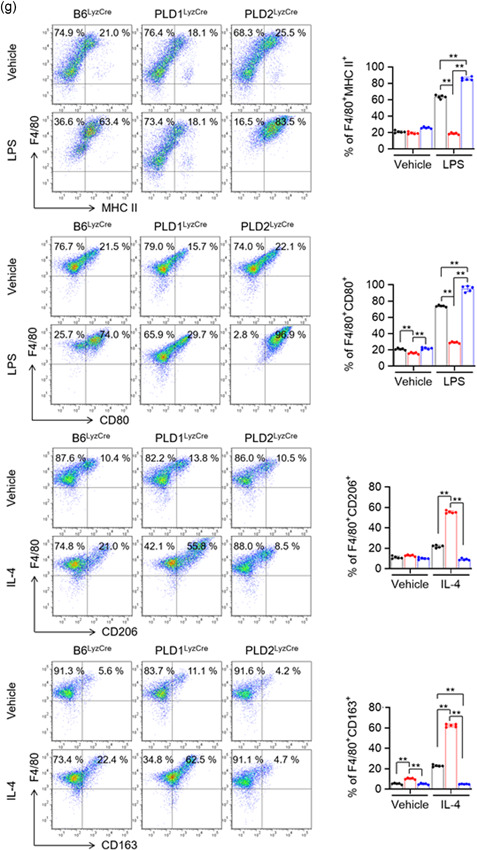
To investigate whether the PLD isozymes affected M1 or M2 polarization, we examined the levels of macrophage phenotypic markers in Pld LyzCre BMDMs. PLD1 deletion dramatically abolished the expression of LPS‐triggered inducible nitric oxide synthase (iNOS; an M1‐type macrophage marker), the level of nitrites (catalytic products of iNOS), and the expression of pro‐inflammatory cytokines (TNF‐α and IL‐6; Figure 2a–c, Figure S4a). PLD2 ablation markedly suppressed the levels of IL‐4‐induced arginase 1 (Arg1; an M2‐phenotype marker), Arg activity, and IL‐10 (an anti‐inflammatory cytokine; Figures 2a, 2d,e, and S4b); hence, it was inferred that PLD1 and PLD2 are required for M1 polarization and M2 polarization, respectively. Notably, PLD2 ablation markedly increased the levels of LPS‐induced M1 polarization markers; conversely, PLD1 deficiency upregulated IL‐4‐induced M2 markers (Figures 2a–e and S4a,b). Since LPS is also known to stimulate Arg1 expression along with numerous paracrine signals (Qualls et al., 2010; Zhang et al., 2019a), we further examined the kinetics of the induction. In Pld1 LyzCre BMDMs, the protein levels of iNOS were abolished 12–24 h after M1 polarization and slightly induced at 48 h (Figure S4c). iNOS in Pld2 LyzCre BMDMs was markedly increased 12–48 h to higher levels after M1 polarization relative to that in B6LyzCre BMDMs (Figure S4c). At later time points (48 h), LPS‐induced Arg1 expression was reduced in Pld1 LyzCre BMDMs. At 12–24 h after M2 polarization, the levels of Arg1 in Pld1 LyzCre BMDMs were higher than those in B6LyzCre BMDMs; furthermore, Arg1 expression in Pld2 LyzCre BMDMs was abolished 12–24 h after M2 polarization and slightly induced at later time points (Figure S4c). Collectively, these findings signified that PLD1 ablation gives rise to M2 polarization, whereas PLD2 deficiency results in M1 phenotype. Therefore, we investigated whether the PLD isoform could reciprocally affect macrophage polarization‐associated transcription factors. Activation of a set of transcription factors such as NFκB, IRF5, and STAT1 leads to M1 macrophage polarization (Medzhitov & Horng, 2009; Takeuchi & Akira, 2010). In contrast, transcription factors such as STAT6, IRF4, and peroxisome proliferator‐activated receptor (PPAR) γ) are involved in the polarization of anti‐inflammatory M2 macrophages (Charo, 2007; Gordon, 2003; Satoh et al., 2010). As shown in Figure 2f, PLD1 ablation decreased the levels of LPS‐induced p‐IkBα, p‐STAT1, and IRF5 in BMDMs but increased the levels of IL‐4‐induced p‐STAT6, IRF4, and PPARγ. Moreover, PLD2 ablation suppressed the expression of IL‐4‐induced p‐STAT6, IRF4, and PPARγ but increased the levels of LPS‐induced p‐IkBα, p‐STAT1, and IRF5. Furthermore, PLD1 ablation reduced the expression of other M1 marker genes induced by LPS, including IL‐1β and IL‐12p40, but enhanced the levels of IL‐4‐induced M2 marker genes including Fizz1 and Ym1, as analyzed by q‐PCR (Figure S4d). In addition, PLD2 deficiency lowered IL‐4‐induced M2‐marker gene expression and elevated LPS‐induced M1‐marker gene expression (Figure S4d). These results indicated that PLD isozymes reciprocally regulate the polarization of M1 and M2 macrophages. We next investigated whether PLD isozymes could regulate the polarization of macrophages using CD11b+ F4/80+ M1 marker+ (MHC II, CD80, and CD86) or CD11b+ F4/80+ M2 marker+ (CD206, CD163, programmed cell death‐1 [PD‐1]; Atri et al., 2018; Gordon et al., 2017; Yao et al., 2014; Zhang et al., 2019b). Flow cytometry showed that the LPS‐induced M1 population was significantly reduced in Pld1 LyzCre BMDMs (F4/80+ MHC II+ [63.4% vs. 18.1%], F4/80+CD80+ [74.0% vs. 29.7%], F4/80+ CD86+ [81.6% vs. 23.3%]); however, it was significantly increased in Pld2 LyzCre BMDMs (F4/80+ MHC II+ [63.4% vs. 83.5%], F4/80+CD80+ [74.0% vs. 96.9%], and F4/80+CD86+ [81.6% vs. 97.7%; Figures 2g and S4e]). Moreover, the IL‐4‐induced M2 population was significantly decreased in Pld2 LyzCre BMDMs (F4/80+CD206+ [21.0% vs. 8.5%], F4/80+CD163+ [22.4% vs. 4.7%], F4/80+PD1+ [23.6% vs. 7.6%]; conversely, it was enhanced in Pld1 LyzCre BMDMs [F4/80+CD206+ 21.0% vs. 55.8%], F4/80+CD163+ [22.4% vs. 62.5%], and F4/80+PD1+ [23.6% vs. 34.2%; Figures 2g and S4e]). Taken together, these results indicated that PLD1 and PLD2 are indispensable for M1 polarization and M2 polarization, respectively.
Figure 2.
PLD1 and PLD2 are required for M1 polarization and M2 polarization trigged by LPS and IL‐4, respectively. The indicated BMDMs were treated with LPS (100 ng/mL) or IL‐4 (20 ng/ml) for 24 h. (a) The levels of iNOS and Arg1 were analyzed by immunoblotting. (b) Production of nitrites in the culture media was measured. (c) Production of TNF‐α and IL‐6 was measured by ELISA. (d) The lysates were analyzed by for arginase activity in the indicated BMDMs. (e) IL‐10 production was measured by ELISA. (f) The specific BMDMs were treated with LPS or IL‐4 for the indicated time, and the lysates were immunoblotted using the indicated antibodies. (g) The indicated BMDMs were treated with LPS or IL‐4 for 24 h, and the population of CD11b+ F4/80+ M1 marker+ (MHC II and CD80) or M2 marker+ (CD206 and CD163) macrophages was analyzed by flow cytometry and quantified. The intensity of the indicated bands was normalized to the intensity of the actin band and quantified against each other. ∗∗ p < .001 (two‐way ANOVA). Results are representative of at least five independent experiments and presented as the mean ± SD. ANOVA, analysis of variance; BMDMs, bone marrow‐derived macrophages; ELISA, enzyme‐linked immunosorbent assay; IL, interleukin; LPS, lipopolysaccharide; PLD, Phospholipase D; TNF‐α, tumor necrosis factor‐α
3.4. PLD1 deficiency in macrophages reduced severity of LPS‐induced sepsis, whereas PLD2 ablation resulted in disease exacerbation
To evaluate the influence of PLD isozymes on endotoxic shock, a lethal dose of LPS (1.5 mg/kg) was injected intraperitoneally into control, Pld1 LyzCre, and Pld2 LyzCre mice. Pld1 LyzCre mice showed a higher survival rate than control and Pld2 LyzCre mice (Figure 3a). However, compared with control mice, Pld2 LyzCre mice were more susceptible to a lethal outcome. Assessment of cytokine concentration in the serum of Pld1 LyzCre mice 6 h after LPS treatment showed a significant reduction in the levels of TNF‐α and IL‐6 but an increase in the IL‐10 level (Figure 3b). In contrast, the serum levels of pro‐inflammatory mediators were significantly increased in Pld2 LyzCre mice, whereas the IL‐10 level was markedly decreased (Figure 3b). To evaluate the response of PLD and macrophages to endotoxins, peritoneal macrophages from control, Pld1 LyzCre, and Pld2 LyzCre mice were isolated, and cytokine production was measured. The culture supernatant of Pld1 LyzCre macrophages showed a significant reduction in the amount of TNF‐α and IL‐6 but an increase in the amount of IL‐10, which is comparable to the results shown in Figure 3b (Figure S5a). We further examined whether the susceptibility of Pld1 LyzCre or Pld2 LyzCre macrophage‐recipient mice to LPS was affected. To determine whether a lack of PLD isozymes in the macrophages was solely responsible for our observations, we adoptively transferred 2 × 10⁷ B6LyzCre, Pld1 LyzCre, or Pld2 LyzCre BMDMs into WT recipients. The mice were challenged with a lethal dose of LPS 1 day after injection, and survival was monitored. Adoptive transfer of PLD1‐depleted macrophages was significantly protective (Figure 3c) and was associated with a decrease in the levels of TNF‐α and IL‐6 and an increase in the levels of IL‐10 in the serum (Figure S5b). In contrast, transfer of PLD2‐deficient macrophages resulted in a marked increase in LPS susceptibility (Figure 3c), implying that macrophages are responsible for the enhanced susceptibility and responsiveness to LPS stimulation in vivo. In addition, the expression level of M2 phenotypic markers was significantly increased in peritoneal macrophages from LPS‐injected PLD1‐deficient mice, but the levels of M1 markers were reduced (Figure 3d). PLD2 deficiency showed an opposite tendency to PLD1 deficiency (Figure 3d). Furthermore, injection of a PLD1 inhibitor into septic mice increased their survival rate and IL‐10 production but decreased the production of pro‐inflammatory cytokines (Figure 3e,f). These findings showed that the anti‐inflammatory Pld1 LyzCre and pro‐inflammatory Pld2 LyzCre responses are due to macrophages.
Figure 3.
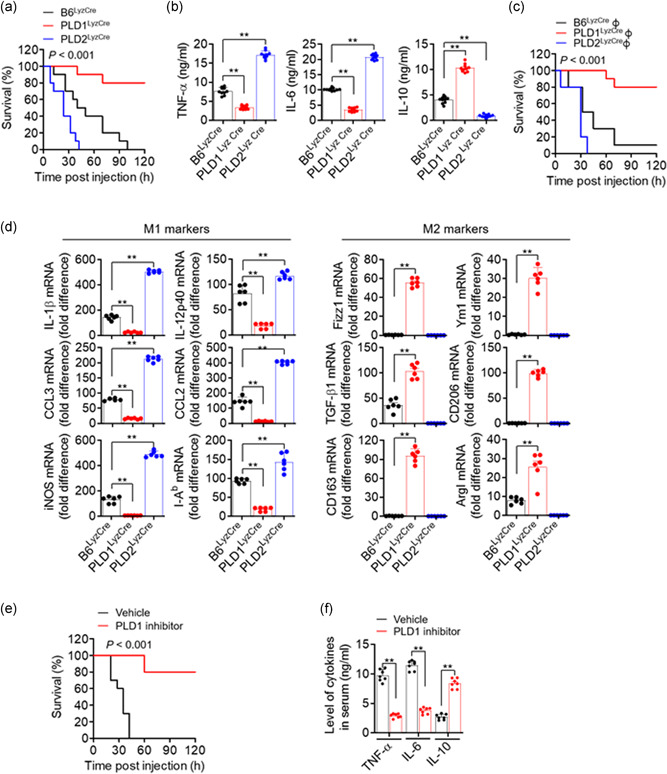
PLD1 deficiency in macrophages results in reduced severity of LPS‐induced sepsis, whereas PLD2 depletion results in disease exacerbation. (a) Kaplan–Meier survival analysis of mice that were challenged with LPS to induce sepsis (n = 10 mice per group). (b) After 6 h, serum samples were collected and the levels of indicated cytokines were measured by ELISA (n = 10 mice per group). (c) BMDMs from B6LyzCre, Pld1 LyzCre, and Pld2 LyzCre mice were injected intraperitoneally into WT recipients; 24 h after adoptive transfer, the mice were challenged with LPS and monitored. Kaplan–Meier plots for survival are shown (n = 10 mice per group). (d) Peritoneal macrophages from LPS‐injected PLD1‐ or PLD2‐deficient mice were analyzed by q‐PCR for the expression of the indicated M1 or M2 marker genes (n = 6 mice per group). (e) LPS‐induced septic mice were treated with the PLD1 inhibitor (VU0155069, 10 mg/kg) and survival was monitored. Kaplan–Meier plots for survival are shown (n = 10 mice per group). (f) LPS‐induced septic mice were treated with the PLD1 inhibitor (10 mg/kg) and the levels of serum cytokine were measured (n = 7 mice per group. ∗∗ p < .001 (one‐way and two‐way ANOVA). Results are representative of at least five independent experiments and presented as the mean ± SD. ANOVA, analysis of variance; BMDMs, bone marrow‐derived macrophages; ELISA, enzyme‐linked immunosorbent assay; LPS, lipopolysaccharide; PLD, Phospholipase D
3.5. PLD1‐deficient macrophages promoted Treg recruitment via CCL5, CCL22, and CCL28 and protected against LPS‐induced sepsis
Using adoptive transfer of PLD1‐ or PLD2‐deficient BMDMs to PLD1/PLD2 double knockout mice (dPLD−/−), we further explored whether differences in protective effects against LPS in Pld LyzCre mice were entirely due to macrophages or partly due to the surrounding environment. Adoptive transfer of PLD1‐ or PLD2‐ablated BMDMs in dPLD−/− recipient mice showed results similar to those seen for adoptive transfer of PLD‐deficient BMDMs to WT mice (Figure S6a,b). Adoptive transfer of PLD1‐deficient BMDMs in dPLD−/− recipient mice showed an increased survival rate and reduced production of pro‐inflammatory cytokines (Figure S6a,b). Thus, the surrounding environment and the macrophages may be intimately associated with the PLD‐mediated response to LPS‐induced sepsis. Therefore, we examined whether PLD in macrophages could affect the recruitment of anti‐inflammatory Tregs after LPS‐induced shock. We adoptively transferred control, Pld1 LyzCre, and Pld2 LyzCre BMDMs into Foxp3 RFP recipient mice 24 h before LPS injection. Peritoneal cells of LPS‐injected mice were isolated 24 h after injection, and Treg infiltration (CD4+FoxP3+) was assessed by flow cytometry. Foxp3 RFP mice that received Pld1 LyzCre macrophages showed a more pronounced peritoneal recruitment of Tregs compared to recipient mice that received control or Pld2 LyzCre cells (Figure 4, 5). Adoptive transfer of Pld2 LyzCre macrophages showed an increased population of CD4+ Foxp3− T cells, which may be inflammatory T cells (Figure 4, 5). Thus, altered recruitment of Tregs may contribute to the inflammatory response observed in the presence of PLD‐ablated macrophages. We further investigated whether PLD‐deficient macrophages could affect the population of differentiated Treg and effector T cells via their interaction with activated T cells. Coculture of naïve CD4 T cells with M2‐polarized Pld1 LyzCre macrophages, but not with Pld2 LyzCre macrophages, significantly increased the population of CD4+CD25+Foxp3+ Tregs; conversely, coculture with Pld2 LyzCre macrophages increased the population of CD4+CD25+Foxp3− effector T cells (Figures 4, 5 and S6c). These results indicated that PLD1‐deficient macrophages induce Treg differentiation, whereas PLD2‐deficient macrophages play an opposite role. M2 macrophages promote the differentiation of Foxp3‐positive Tregs (Schmidt et al., 2016; Wynn & Vannella, 2016). TGFβ, secreted by M2 macrophages, increases the differentiation of Foxp3‐positive Tregs (Hu et al., 2018). We found that PLD1‐deficient macrophages showed augmented TGFβ expression in the M2‐polarization condition (data not shown). Next, we sought to identify what kinds of effector T cells are CD4+CD25+Foxp3− T cells. Coculture of naïve CD4+T cells with M1‐polarized Pld2 LyzCre macrophages increased the population of IFN‐γ‐expressing Th1 CD4+ T cells (4.3% vs. 12.4%) and IL‐17A‐expressing Th17 cells (8.5% vs. 23.6%) to a greater extent compared with that with WT macrophages (Figure S6d). In addition, coculture of naïve CD4+ T cells with M1‐polarized Pld2 LyzCre macrophages significantly elevated the expression of T‐bet and RORγt, transcription factors responsible for differentiation into Th1 and Th17, respectively (Figure S6e). Furthermore, we investigated whether PLD ablation impacted the migration of iTregs. Culture supernatant obtained from M2‐polarized Pld1 LyzCre macrophages, but not from Pld2 LyzCre macrophages, significantly accelerated the migration of iTregs differentiated from naïve CD4+ T cells of Foxp3 RFP mice (Figure 4, 5). We evaluated the expression of chemokines generated from peritoneal macrophages after polarization of macrophages with M1 or M2 stimulus. We selected chemokines known to attract Tregs (Strazza & Mor, 2017). M2 polarization of Pld1 LyzCre macrophages, but not of Pld2 LyzCre macrophages, significantly augmented CCL5, CCL22, and CCL28 expression; however, there was a marginal effect on CCL4 and CCL27 expression (Figure S6f). Neutralizing antibodies against chemokines (CCL5, CCL22, and CCL28) significantly abolished the migration of iTregs, which was accelerated by the culture supernatant of M2‐polarized Pld1 LyzCre macrophages; therefore, chemokines produced by M2‐polarized Pld1 LyzCre macrophages induced the migration of iTregs (Figures 4, 5 and S6g). Although adoptive transfer of Pld1 LyzCre macrophages to WT mice increased the population of activated Tregs (CD25+Foxp3+) and the survival rate in the LPS‐induced sepsis model, injection of the antibodies significantly suppressed the survival rate and the population (51.7% vs. 20.3%) of activated Tregs (CD25+Foxp3+; Figure 4, 5). Next, we performed in vitro Treg functional assays to monitor the ability of PLD1‐deficient macrophage‐induced Tregs to suppress the proliferation and effector functions of naïve T cells in response to CD3 and CD28 stimulation. In brief, iTregs induced from M2‐polarized control and Pld1 LyzCre BMDMs were cocultured with freshly isolated CFSE‐labeled naïve T cells. After 5 day, CFSE dilution was measured as a readout for the number of naïve T‐cell proliferations. In the absence of iTregs, naïve T cells were divided robustly, as evidenced by a significant CFSE dilution, with approximately six cell divisions being observed (Figure 4, 5). As the proportion of iTregs induced by Pld1 LyzCre macrophages increased, the proliferation of naïve T cells decreased further (Figure 4, 5), indicating that PLD1 deficiency‐induced iTregs suppress the function of naïve T cells. Collectively, these results indicated that PLD1‐deficient macrophages promote Treg recruitment via CCL5, CCL22, and CCL28, thereby protecting against LPS‐induced sepsis.
Figure 4.
PLD1‐deficient macrophages promote Treg recruitment via CCL5, CCL22, and CCL28, and protect against LPS‐induced sepsis. (a) The indicated BMDMs were injected into Foxp3 RFP mice 24 h before LPS injection. Macrophages from LPS‐injected Foxp3 RFP mice were isolated, and infiltration of Tregs (CD4+FoxP3+) was assessed by flow cytometry and quantified (n = 7 mice per group). (b) M1‐ or M2‐polarized Pld LyzCre macrophages were cocultured with naïve CD4+ T cells of WT mice activated in the presence of antimouse CD3ε antibody (1 μg/ml). Thereafter, the populations of CD4+CD25+Foxp3+ Treg and CD4+CD25+Foxp3− effector T cells were analyzed by flow cytometry and quantified. (c) The transwell membrane chamber was used to evaluate the migration of iTregs that had differentiated from naïve CD4+ T cells of Foxp3 RFP mice after placing the conditioned media (CM) obtained from M1‐ or M2‐polarized Pld LyzCre macrophages in the bottom chamber. Migrated cells were observed by fluorescence microscopy and quantified. (d) Effect of antibodies against the indicated chemokines (100 ng/ml) on the migration of iTregs. B6LyzCre mice were adaptively transferred toto Pld1 LyzCre macrophages, challenged with LPS, and injected with a mixture of neutralizing antibodies (CCL5, CCL22, and CCL28; each 100 μg); thereafter, (e) they were evaluated for survival (n = 10 mice per group). (f) B6LyzCre mice were adoptively transferred toto Pld1 LyzCre macrophages. After 24 h, mice were challenged with LPS and injected with a mixture of neutralizing antibodies (CCL5, CCL22, and CCL28; each 100 μg). Peritoneal cells were analyzed by flow cytometry with CD4+ CD25+ FoxP3+ and quantified (n = 7 mice per group). (g) CFSE‐labeled naïve CD4+ T cells were cocultured with various ratios of iTregs induced from M2‐polarized WT and Pld1 LyzCre BMDMs. After 5 days, CFSE dilution was measured as a readout of the amount of naïve T‐cell proliferation. NS (nonsignificant), ∗∗ p < .001 (one‐way and two‐way ANOVA). Results are representative of at least five independent experiments and are presented as the mean ± SD. ANOVA, analysis of variance; LPS, lipopolysaccharide; PLD, Phospholipase D
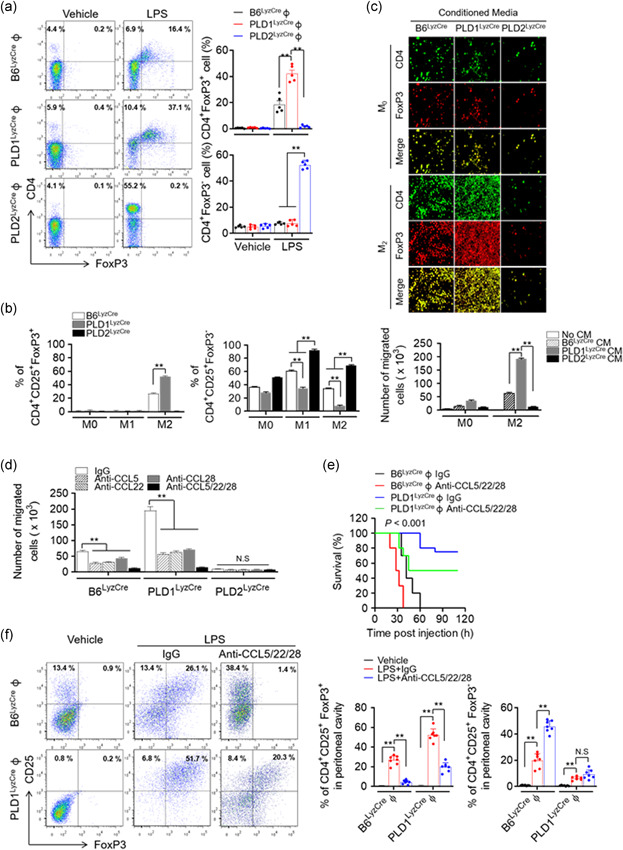
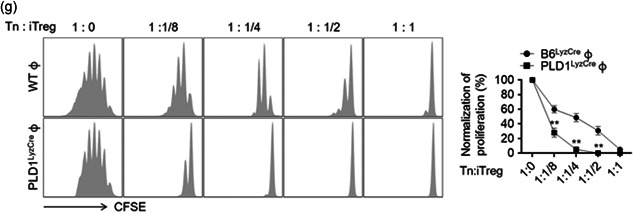
Figure 5.
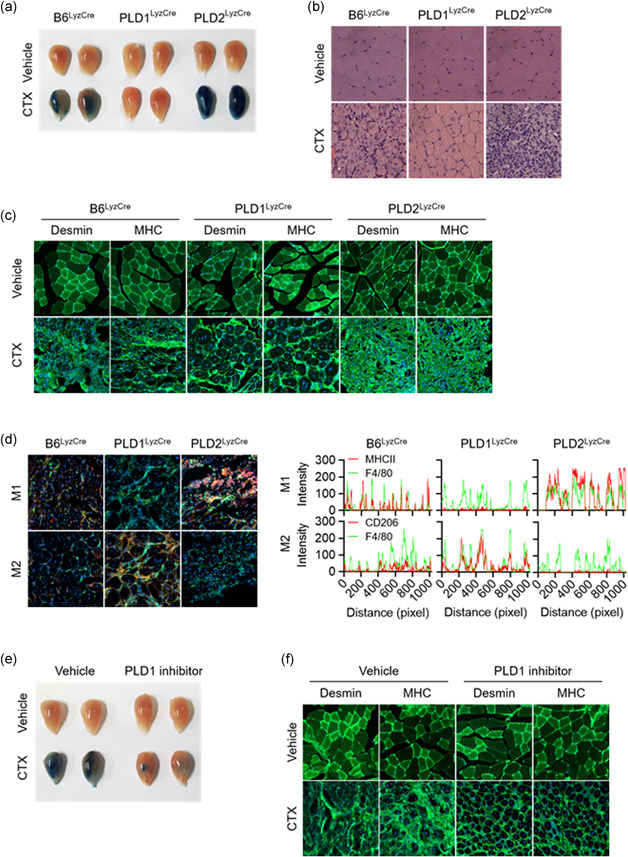
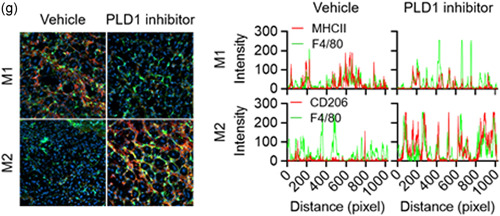
PLD1 ablation in macrophages promotes muscle regeneration by regulating the phenotype switch of muscle macrophages from M1 to M2. (a) Representative photograph of TA muscles of the indicated mice after 8 days of injury by cardiotoxin (CTX) (n = 8 mice per group). (b) Representative images of TA muscle sections stained with hematoxylin and eosin after 8 days of injury. (c) TA muscles of the specific mice were stained with the indicated antibodies and observed by fluorescence microscopy, 5 days after injury. (d) TA muscles of the indicated mice were stained with Hoechst 33342 (blue) and antibodies to F4/80 (green), MHCII (red, I‐Eb/I‐Ab), or CD206 (red) and observed by fluorescence microscopy, 5 days after injury. Fluorescence intensity profiles of the F4/80‐positive signal (green) and MHCII (red) or CD206 (red)‐positive signal showing that the two signals share overlapping spatial profiles. (e) Representative photograph of TA muscles of PLD1 inhibitor‐injected mice after CTX injury (n = 8 mice per group). (f) PLD1 inhibitor‐injected TA muscles after CTX injury were stained with the indicated antibodies and (g) stained with Hoechst 33342 (blue), and antibodies to F4/80 (green), MHCII (red), or CD206 (red). The images were observed by fluorescence microscopy. Fluorescence intensity profiles of the F4/80‐positive signal (green) and MHCII (red) or CD206 (red)‐positive signal. Results are representative of at least five independent experiments and presented as the mean ± SD. Magnification is ×200. PLD, Phospholipase D; TA, tibialis anterior
3.6. Targeting of PLD1 in macrophages promoted muscle regeneration by regulating the phenotype switch of muscle macrophages from M1 to M2
Muscle injury results in rapid activation of the innate immune system, which exerts pleiotropic effects on the regenerating muscle (Arnold et al., 2007; Brunelli & Rovere‐Querini, 2008; Tidball & Villalta, 2010; Uezumi et al., 2010). CTX was employed to induce acute injury in the tibialis anterior (TA) muscle of mice. To evaluate the overall efficacy of the regenerative response, mice were injected intraperitoneally with Evans blue dye, which accumulates in damaged muscle fibers. Evans blue dye uptake in the TA muscles, which exhibited a robust regenerative response, was markedly suppressed to a greater extent in Pld1 LyzCre mice than in control mice (Figure 4, 5). However, dye uptake was notably higher in the TA muscles of Pld2 LyzCre mice, which is indicative of a failure of the regenerative response to restore mature intact myofibers (Figure 4, 5). In support of this interpretation, histological examination revealed that the TA muscles of Pld1 LyzCre mice contained centrally nucleated regenerative myofibers, which were largely absent in those of Pld2 LyzCre mice (Figure 4, 5). Instead, cellular debris and inflammatory infiltrates persisted in the injured TA muscles of Pld2 LyzCre mice (Figure 4, 5). Furthermore, immunofluorescence staining for desmin and myosin heavy chain (MHC), markers of mature myofibers, showed a near‐complete absence of regenerated muscle fibers in Pld2 LyzCre mice after 5 d of CTX treatment (Figure 4, 5). However, Pld1 LyzCre mice demonstrated intact regenerating TA muscles expressing desmin and MHC (Figure 4, 5). These results provide genetic evidence that PLD1 and PLD2 play central roles in skeletal muscle regeneration. To further investigate the nature of the cells infiltrating the damaged muscle, immunofluorescence staining was performed for M1 and M2 markers. The regenerating TA muscles of Pld1 LyzCre mice showed a marked increase in M2 macrophages (F4/80+ green, CD206+ red, Hoechst 33342 blue) and a decrease in M1 macrophages (F4/80+ green, MHC‐II red, Hoechst 33342 blue; Figure 4, 5, left); conversely, the injured TA muscles of Pld2 LyzCre mice contained a large population of M1 macrophages and lacked M2 macrophages (Figure 4, 5, left). The TA muscles of Pld1 LyzCre mice showed an increase in the overlap of green fluorescence (F4/80) of the myeloid marker with the red fluorescence of the M2 marker (CD206; Figure 4, 5, right). However, Pld1 ablation decreased the fluorescence overlap between F4/80+ and the M1 marker (MHC‐II; Figure 4, 5, right). These results indicated that the regenerating TA muscles of Pld1 LyzCre mice showed a marked increase in M2 macrophages and a decrease in M1 macrophages. However, opposite findings were observed following Pld2 ablation, indicating that the injured TA muscles of Pld2 LyzCre mice contained a large population of M1 macrophages and a small population of M2 macrophages. Injection of the PLD1 inhibitor into CTX mice produced results similar to those for Pld1 LyzCre mice (Figure 4, 5). Collectively, these results showed that targeting of PLD1 in macrophages regulates the phenotype switch of muscle macrophages from M1 to M2 for the regeneration of injured muscle in vivo.
3.7. Targeting PLD1 enhanced keratin 14 and Collagen I synthesis and accelerated cutaneous wound healing via a macrophage phenotype switch from M1 to M2
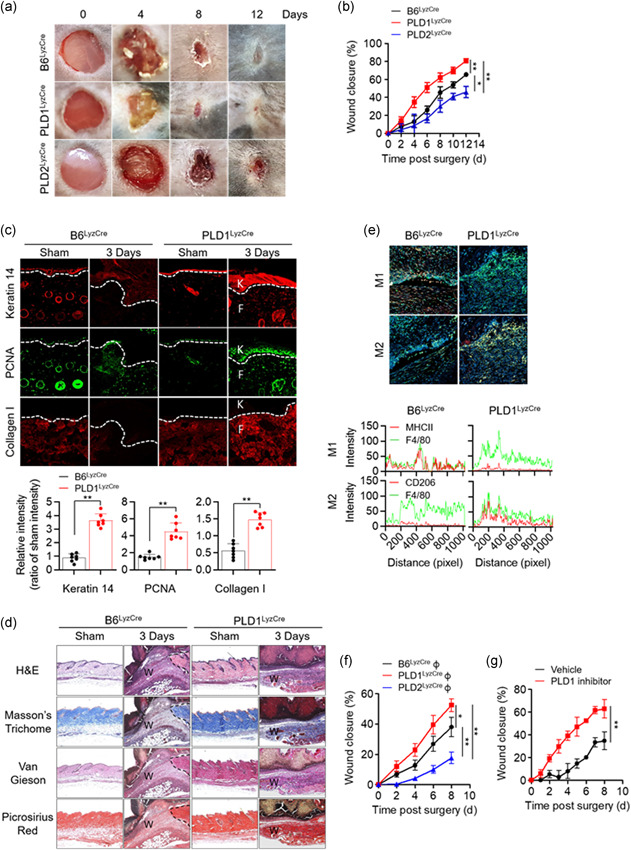
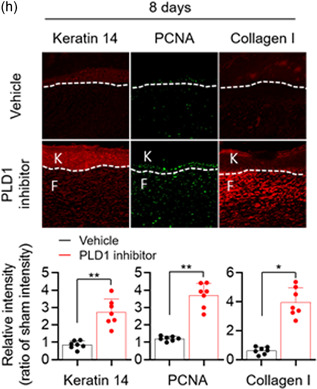
The dynamic equilibrium between M1 and M2 macrophages is also vital for wound healing and tissue homeostasis (Guo & Dipietro, 2010; Lucas et al., 2010; Mirza et al., 2009). To examine the role of PLD in cutaneous wound healing and collagen production in vivo, full‐thickness circular wounds (diameter = 0.6 cm) on the backs of control, Pld1 LyzCre, and Pld2 LyzCre mice were generated. Wound size was markedly lower in Pld1 LyzCre mice than in control and Pld2 LyzCre mice (Figure 6a). Pld1 LyzCre mice showed a marked acceleration in wound closure, as determined by measuring the wound diameters (Figure 6b). Wound closure in Pld2 LyzCre mice was significantly delayed by 4–12 days after wounding when compared to that in control and Pld1 LyzCre mice. We further investigated the expression of wound‐healing markers in epidermal keratinocytes and dermal fibroblasts. Pld1 LyzCre mice showed increased levels of keratin 14 and proliferating cell nuclear antigen (PCNA) in epidermal keratinocytes (Figure 6c). The level of Collagen I, a marker of myofibroblast differentiation in dermal fibroblasts, was higher in Pld1 LyzCre mice than in control mice (Figure 6c). Collagen deposition increased in Pld1 LyzCre mice, as confirmed by Masson's trichrome, picrosirius red, and van Gieson staining (Figure 6d). The population of M1 and M2 macrophages in the wound region was substantiated by analyzing the fluorescence intensity profiles of the F4/80+ (green) and CD206+ or MHC‐II (red) signals (Figure 6e, upper). The wound region of Pld1 LyzCre mice showed reduced overlapping of green (F4/80) and red fluorescence (M1 marker, MHC‐II) and increased overlapping of the green F4/80+ signal with the fluorescence of the M2 marker (CD206; Figure 6e, lower), implying that the wound region of Pld1 LyzCre mice showed a marked increase in M2 macrophages and a decrease in M1 macrophages. Adoptive transfer of PLD1‐depleted macrophages showed results comparable to those in Pld1 LyzCre mice (Figure 6f, Figure S7a–c). In contrast, transfer of PLD2‐deficient macrophages showed results opposite to those seen for the transfer of PLD1‐depleted macrophages (Figure 6f, Figure S7a–c). Furthermore, treatment with the PLD1 inhibitor showed results similar to those obtained with Pld1 LyzCre mice (Figures 6g,h and S7d). The levels of Collagen I and keratin 14 increased in fibroblasts and keratinocytes in the wounds of PLD1 inhibitor‐treated mice, respectively (Figures 6g,h and S7d). In addition, the number of PCNA‐positive cells increased in the dermis and keratinocytes 8 days postwounding in PLD1 inhibitor‐treated mice (Figures 6g,h and S7d). These results indicated that targeting of PLD1 in macrophages results in an increase in keratin 14 and Collagen I expression, which may contribute to cutaneous wound healing. Overall, targeting PLD1 can be considered a potential approach for the development of drugs to enhance wound healing, most probably, via promotion of M2 polarization.
Figure 6.
Targeting PLD1 enhances keratin 14 and Collagen I synthesis and accelerates cutaneous wound healing via a macrophage phenotype switch from M1 to M2. (a) Representative photographs of macroscopic wound closure in the indicated mice created with full‐thickness circular wounds (n = 8 mice per group). (b) Relative wound closure rates. (c) Representative images of immunofluorescence staining for keratin 14, PCNA, and Collagen I 3 days after injury. Dashed lines indicate the epidermal–dermal boundary. F, fibroblasts; K, keratinocytes. Quantitative analysis of fluorescence of indicated images (n = 7 mice per group). (d) Representative images of Masson's trichrome, van Gieson, and picrosirius red staining of injured skin tissues 3 days postwounding. W; wound region. (e) Injured skin sections from the indicated mice, stained with Hoechst 33342 (blue) and antibodies to F4/80 (green), MHCII (red), or CD206 (red), and observed by fluorescence microscopy 3 days after injury. Fluorescence intensity profiles of the F4/80‐positive signal (green) and MHCII (red) or CD206 (red)‐positive signal. (f) Relative wound closure rates in B6LyzCre recipient mice adoptively transferred with B6LyzCre, Pld1 LyzCre, or Pld2 LyzCre macrophages. (n = 8 mice per group). (g) Relative wound closure rates in PLD1 inhibitor‐injected mice (n = 8 mice per group). (h) Representative images of immunofluorescence staining for keratin 14, PCNA, and Collagen I in skin sections from injured, PLD1 inhibitor‐treated mice at 8 days postwounding. Dashed lines indicate the epidermal–dermal boundary. F, fibroblasts; K, keratinocytes. Quantitative analysis of fluorescence of indicated images (n = 7 mice per group). ∗ p < .01, ∗∗ p < .001 (one‐way ANOVA). Results are representative of at least five independent experiments and presented as the mean ± SD. ANOVA, analysis of variance; PCNA, proliferating cell nuclear antigen; PLD, Phospholipase D
4. DISCUSSION
Macrophage polarization is a highly dynamic and plastic program that is regulated by various signals that define macrophage phenotypes and are crucial for homeostasis, tissue repair, and immunity (Gordon & Martinez, 2010). However, the mechanism governing signal‐dependent regulation of macrophage polarization and developing the primary mediator of this reprogramming as a therapeutic agent for inflammatory diseases and tissue injury elusive. Herein, we demonstrated, to the best of our knowledge, for the first time that PLD1 and PLD2 are selectively coupled to TLR‐4 and IL‐4R, respectively, to differentially regulate macrophage polarization (Figure 7). An increase in PLD activity, which occurs during the activation of several phagocytic receptors including FcγR, is necessary for efficient phagocytosis (Ali et al., 2013; Corrotte et al., 2006; Tanguy et al., 2019). PLD1 and PLD2 isoforms share 50% amino acid sequence homology; structural differences and differential activation may account for the functional divergence of the two isozymes. A few prior studies exist on the functional differences between PLD1 and PLD2. PLD1 plays positive roles in FcεRI‐mediated signaling and mast cell function, but PLD2 negatively regulates these pathways, implying opposite roles of PLD isozymes in the regulation of mast cell function and allergic responses (Zhu et al., 2015). Moreover, PLD1 plays a protective role in acute respiratory distress syndrome, whereas PLD2 worsens tissue injury, implying a pathogenic role for PLD2, which operates in opposition to PLD1 in lung injury (Abdulnour et al., 2018). Although we have identified ligand‐selective coupling of PLD isozymes with distinct receptors and their downstream molecules, purified in vitro interaction experiments are needed for further evaluation. PLD modulates the inflammatory response by macrophages, and other phospholipases have been reported to regulate macrophage polarization (Grinberg et al., 2009; Nelson et al., 2020; Shukla et al., 2017). In the present study, we demonstrated that PLD1 and PLD2 play key roles in polarizing macrophages toward the M1 state and M2 state, respectively, by cross‐regulating signaling events triggered by LPS and IL‐4. While PA production may represent a generalized PLD function, precise spatial and temporal regulation of this activity likely contributes to isoform‐specific functionalities. The interrelationships between PLD and PA and their binding partners enable PLD to receive multiple signals, integrate and coordinate complex upstream signals, and decide which signals will be transmitted to downstream pathways (Jang & Min, 2012). LPS‐induced PLD1 activation and IL‐4‐induced PLD2 activation were selectively coupled to the TLR4–MyD88 axis and IL‐4R–JAK3, respectively. LPS or IL‐4 induced distinct interactions between PLD isozymes and their binding partners (Figure 7). Thus, it is inferred that the PLD pathway and its downstream effectors play pivotal roles in phenotypes associated with macrophage polarization. The PLD2‐Y415F mutant, which disrupts its interaction with JAK3, may also disrupt the entire IL4‐IL4R‐PLD2‐JAK3 signaling pathway and affect polarization. Thus, it would be interesting to see how the polarization would progress when the PLD2 WT and PLD2‐Y415F mutants revert into PLD2 knockout BMDMs. However, we did not identify any mutation in PLD1 that could disrupt the LPS‐TLR4‐MyD88 pathway. Identifying a mutant of PLD1 disrupting the specifically coupled signaling pathway will strengthen the role of PLD1 in macrophage polarization. Depletion of PLD1 and PLD2 enhances the function of the other in macrophages stimulated with LPS and IL‐4, respectively. Reciprocal regulation of M1‐ or M2 ‐associated transcription factors by PLD1 and PLD2 deficiency may contribute to this phenomenon. The detailed molecular basis for this opposite signaling output, including any changes in TLR4/MyD88 and IL‐4R/JAK3 protein complexes by PLD1 and PLD2 deficiency, remains to be elucidated. Thus far, there are no macrophage‐specific Cre deleters; however, most researchers use LysM‐Cre, although the possibility that LysM‐Cre‐based mouse models can affect neutrophils in vivo cannot be excluded. Dysregulated macrophage activation contributes to a large panel of human diseases (Van den Bossche et al., 2017). The present study provides a conceptual basis for therapeutically targeting PLD in a disease setting to reprogram macrophage polarization in a specific direction. Genetic and pharmacological targeting of PLD1 in macrophages results in protection against LPS‐induced sepsis, CTX‐induced muscle injury, and skin injury by promoting the shift in tissue macrophages to the M2 phenotype. The impact of PLD on inflammatory disease has also been shown by others, signifying that PLD plays a crucial role in diseases with high inflammatory burden. A recent study showed that PLD1‐deficient platelets contribute to the preserved outcome of Pld1 −/− mice after LPS‐induced sepsis because platelets exhibit an integrin activation defect, hence indicating reduced platelet activation in PLD1‐deficient mice (Urbahn et al., 2018). In cecal ligation puncture‐induced polymicrobial sepsis, whole‐body PLD2 deficiency prolonged the survival of mice and diminished organ damage during sepsis, and the protective effect of PLD2 deficiency against sepsis was reported to be mediated by neutrophils via adaptive transfer experiments of neutrophils from PLD2−/− mice (Lee et al., 2015). In contrast, we did not observe any protective effect of PLD2 deficiency during LPS‐induced sepsis. Instead, Pld2 LyzCre mice showed an increase in LPS‐induced septic severity, implying that differences may arise according to the use of different PLD2 KO mice or the experimental setup. Thus, PLD1 or PLD2 in macrophages, neutrophils, and platelets might play a crucial role in sepsis. Moreover, the surrounding environment and macrophages are intimately associated with the PLD‐mediated response to LPS‐induced sepsis. The anti‐inflammatory phenotype of Pld1 LyzCre macrophages may also be due to enhanced Foxp3+ Treg recruitment after LPS‐induced shock, which is partly a consequence of chemokine expression, such as CCL5, CCL22, and CCL28, leading to Treg infiltration at the inflammation site. Blockade of the cytokines suggests that anti‐inflammatory responses in Pld1 LyzCre mice are caused by skewed macrophage activities. This contrasts with Pld2 LyzCre macrophages that accelerate the recruitment of Th17 cells, effectively blocking Treg recruitment. These observations signify that the divergent inflammatory responses observed in PLD‐deficient mice result from altered cell recruitment and cytokine production by macrophages. Thus, it is likely that PLD1 may regulate the secretion of secretory factors or membrane trafficking of certain membrane proteins, in addition to transcriptional regulation. Further studies are required to identify this mechanism. PLD1 ablation in macrophages promotes the shift in muscle macrophages to the M2 phenotype in regenerating muscle after injury; conversely, PLD2 ablation increases the number of muscle macrophages of the M1 phenotype but decreases the shift toward the M2 phenotype. Although the present study demonstrates that PLD2 is required for the regeneration of injured tissues, it is unknown whether direct injection of PLD2 into injured tissues will improve repair. Moreover, PLD1 and PLD2 function as negative and positive regulators of collagen production in the wound‐healing process, respectively. The enhancement of wound healing in Pld1 LyzCre mice and identification of the role of PLD1 as a negative regulator of collagen production indicate that PLD1 blockade may be a potential strategy for the development of novel drugs for the treatment of acute wounds by promoting M2 polarization. Collectively, the present study demonstrates the PLD isoform‐selective signaling network for controlling macrophage function and proposes PLD as a key player in macrophage polarization and as a target for pharmacological intervention and control of the polarization process.
Figure 7.
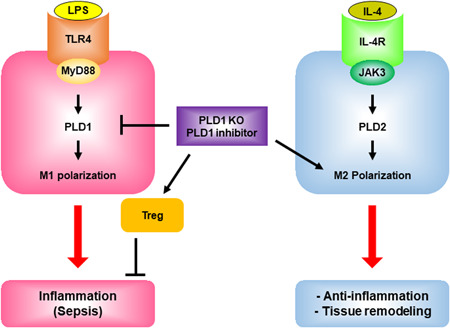
Proposed model for PLD isozyme‐selective coupling to receptors and differential regulation of macrophage polarization. LPS and IL‐4 selectively activate PLD1 and PLD2 via TLR4 and IL‐4R, respectively. LPS induces the interaction of TLR4 or MyD88 with PLD1, and IL4 enhances the association of IL4R or JAK3 with PLD2. PLD isozyme‐specific function is mediated by LPS‐ and IL‐4‐triggered signaling via the MyD88 and JAK3 axis, followed by differential control of M1 and M2 macrophage polarization. PLD1 and PLD2 are indispensable for the polarization of M1 and M2, respectively, and reciprocally regulate macrophage polarization. Targeting of PLD1 protects against LPS‐induced sepsis via anti‐inflammatory action and recruitment of Tregs, and induces tissue remodeling by promoting the shift toward M2. IL, interleukin; LPS, lipopolysaccharide; PLD, Phospholipase D
CONFLICTS OF INTEREST
The authors declare no competing interests, except for G.D.P, who is a full‐time employee and shareholder of Denali Therapeutics Inc.
AUTHOR CONTRIBUTIONS
Do Sik Min, Won Chan Hwang, and Kang‐Yell Choi designed the study, analyzed the data, and wrote the manuscript. Gilbert Di Paolo contributed to the mouse tools. Won Chan Hwang, Minju Kang, Rae Hee Kang, and Seol Hwa Seo performed the experiments. Kang‐Yell Choi provided the experimental assistance.
Supporting information
Supporting information.
ACKNOWLEDGMENTS
The present study was supported by a National Research Foundation of Korea (NRF) grant funded by the Korean government (NRF‐2018R1A2B3002179) and by the Yonsei University Research Fund of 2019‐22‐0193.
Hwang WC, Seo SH, Kang M, et al. PLD1 and PLD2 differentially regulate the balance of macrophage polarization in inflammation and tissue injury. J Cell Physiol. 2021;236:5193–5211. 10.1002/jcp.30224
Present address: Denali Therapeutics Inc., South San Francisco, CA 94080, USA.
DATA AVAILABILITY STATEMENT
The data that support the findings of this study are available from the corresponding author D.S.M., upon reasonable request.
REFERENCES
- Abdulnour, R. E. , Howrylak, J. A. , Tavares, A. H. , Douda, D. N. , Henkels, K. M. , Miller, T. E. , Fredenburgh, L. E. , Baron, R. M. , Gomez‐Cambronero, J. , & Levy, B. D. (2018). Phospholipase D isoforms differentially regulate leukocyte responses to acute lung injury. Journal of Leukocyte Biology, 103(5), 919–932. [DOI] [PMC free article] [PubMed] [Google Scholar]
- Ali, W. H. , Chen, Q. , Delgiorno, K. E. , Su, W. , Hall, J. C. , Hongu, T. , Tian, H. , Kanaho, Y. , Di Paolo, G. , Crawford, H. C. , & Frohman, M. A. (2013). Deficiencies of the lipid‐signaling enzymes phospholipase D1 and D2 alter cytoskeletal organization, macrophage phagocytosis, and cytokine‐stimulated neutrophil recruitment. PLoS One, 8(1), e55325. [DOI] [PMC free article] [PubMed] [Google Scholar]
- Arnold, L. , Henry, A. , Poron, F. , Baba‐Amer, Y. , van Rooijen, N. , Plonquet, A. , Gherardi, R. K. , & Chazaud, B. (2007). Inflammatory monocytes recruited after skeletal muscle injury switch into antiinflammatory macrophages to support myogenesis. Journal of Experimental Medicine, 204(5), 1057–1069. [DOI] [PMC free article] [PubMed] [Google Scholar]
- Arranz, A. , Doxaki, C. , Vergadi, E. , Martinez de la Torre, Y. , Vaporidi, K. , Lagoudaki, E. D. , Ieronymaki, E. , Androulidaki, A. , Venihaki, M. , Margioris, A. N. , Stathopoulos, E. N. , Tsichlis, P. N. , & Tsatsanis, C. (2012). Akt1 and Akt2 protein kinases differentially contribute to macrophage polarization. Proceedings of the National Academy of Sciences of the United States of America, 109(24), 9517–9522. [DOI] [PMC free article] [PubMed] [Google Scholar]
- Atri, C. , Guerfali, F. Z. , & Laouini, D. (2018). Role of human macrophage polarization in inflammation during infectious diseases. International Journal of Molecular Sciences, 19(6), 1801. [DOI] [PMC free article] [PubMed] [Google Scholar]
- Biswas, S. K. , & Mantovani, A. (2010). Macrophage plasticity and interaction with lymphocyte subsets: Cancer as a paradigm. Nature Immunology, 11(10), 889–896. [DOI] [PubMed] [Google Scholar]
- van den Bossche, J. , O′Neill, L. A. , & Menon, D. (2017). Macrophage immunometabolism: Where are we (going)? Trends in Immunology, 38(6), 395–406. [DOI] [PubMed] [Google Scholar]
- Brown, H. A. , Thomas, P. G. , & Lindsley, C. W. (2017). Targeting phospholipase D in cancer, infection and neurodegenerative disorders. Nature Reviews Drug Discovery, 16(5), 351–367. [DOI] [PMC free article] [PubMed] [Google Scholar]
- Brunelli, S. , & Rovere‐Querini, P. (2008). The immune system and the repair of skeletal muscle. Pharmacological Research, 58(2), 117–121. [DOI] [PubMed] [Google Scholar]
- Bruntz, R. C. , Lindsley, C. W. , & Brown, H. A. (2014). Phospholipase D signaling pathways and phosphatidic acid as therapeutic targets in cancer. Pharmacological Reviews, 66(4), 1033–1079. [DOI] [PMC free article] [PubMed] [Google Scholar]
- Charo, I. F. (2007). Macrophage polarization and insulin resistance: PPARγ in control. Cell Metabolism, 6(2), 96–98. [DOI] [PubMed] [Google Scholar]
- Corrotte, M. , Chasserot‐Golaz, S. , Huang, P. , Du, G. , Ktistakis, N. T. , Frohman, M. A. , Vitale, N. , Bader, M.‐F. , & Grant, N. J. (2006). Dynamics and function of phospholipase D and phosphatidic acid during phagocytosis. Traffic, 7, 365–377. [DOI] [PubMed] [Google Scholar]
- Frohman, M. A. (2015). The phospholipase D superfamily as therapeutic targets. Trends In Pharmacological Sciences, 36(3), 137–144. [DOI] [PMC free article] [PubMed] [Google Scholar]
- Gordon, S. (2003). Alternative activation of macrophages. Nature Reviews Immunology, 3(1), 23–35. [DOI] [PubMed] [Google Scholar]
- Gordon, S. , & Martinez, F. O. (2010). Alternative activation of macrophages: Mechanism and functions. Immunity, 32(5), 593–604. [DOI] [PubMed] [Google Scholar]
- Gordon, S. R. , Maute, R. L. , Dulken, B. W. , Hutter, G. , George, B. M. , McCracken, M. N. , Gupta, R. , Tsai, J. M. , Sinha, R. , Corey, D. , Ring, A. M. , Connolly, A. J. , & Weissman, I. L. (2017). PD‐1 expression by tumour‐associated macrophages inhibits phagocytosis and tumour immunity. Nature, 545(7655), 495–499. [DOI] [PMC free article] [PubMed] [Google Scholar]
- Grinberg, S. , Hasko, G. , Wu, D. , & Leibovich, S. J. (2009). Suppression of PLCβ2 by endotoxin plays a role in the adenosine A2A receptor‐mediated switch of macrophages from an inflammatory to an angiogenic phenotype. American Journal of Pathology, 175(6), 2439–2453. [DOI] [PMC free article] [PubMed] [Google Scholar]
- Guo, S. , & Dipietro, L. A. (2010). Factors affecting wound healing. Journal of Dental Research, 89(3), 219–229. [DOI] [PMC free article] [PubMed] [Google Scholar]
- Heredia, J. E. , Mukundan, L. , Chen, F. M. , Mueller, A. A. , Deo, R. C. , Locksley, R. M. , Rando, T. A. , & Chawla, A. (2013). Type 2 innate signals stimulate fibro/adipogenic progenitors to facilitate muscle regeneration. Cell, 153(2), 376–388. [DOI] [PMC free article] [PubMed] [Google Scholar]
- Hu, Y. , QI, W. , Sun, L. , Zhou, H. , Zhou, B. , & Yang, Z. (2018). Effect of TGFβ1 on blood CD4+CD25high regulatory T cell proliferation and Foxp expression during non‐small cell lung cancer blood metastasis. Experimental and Therapeutic Medicine, 16, 1403–1410. [DOI] [PMC free article] [PubMed] [Google Scholar]
- Jang, Y. H. , & Min, D. S. (2012). The hydrophobic amino acids involved in the interdomain association of phospholipase D1 regulate the shuttling of phospholipase D1 from vesicular organelles into the nucleus. Experimental & Molecular Medicine, 44(10), 571–577. [DOI] [PMC free article] [PubMed] [Google Scholar]
- Kang, D. W. , Choi, K. Y. , & Min, D. S. (2011). Phospholipase D meets Wnt signaling: A new target for cancer therapy. Cancer Research, 71(2), 293–297. [DOI] [PubMed] [Google Scholar]
- Kang, D. W. , Choi, K. Y. , & Min, D. S. (2014). Functional regulation of phospholipase D expression in cancer and inflammation. The Journal of Biological Chemistry, 289(33), 22575–22582. [DOI] [PMC free article] [PubMed] [Google Scholar]
- Kantonen, S. , Hatton, N. , Mahankali, M. , Henkels, K. M. , Park, H. , Cox, D. , & Gomez‐Cambronero, J. (2011). A novel phospholipase D2‐Grb2‐WASp heterotrimer regulates leukocyte phagocytosis in a two‐step mechanism. Molecular and Cellular Biology, 31(22), 4524–4537. [DOI] [PMC free article] [PubMed] [Google Scholar]
- Knapek, K. , Frondorf, K. , Post, J. , Short, S. , Cox, D. , & Gomez‐Cambronero, J. (2010). The molecular basis of phospholipase D2‐induced chemotaxis: elucidation of differential pathways in macrophages and fibroblasts. Molecular and Cellular Biology, 30(18), 4492–4506. [DOI] [PMC free article] [PubMed] [Google Scholar]
- Kovarik, P. , Stoiber, D. , Novy, M. , & Decker, T. (1998). Stat1 combines signals derived from IFN‐γ and LPS receptors during macrophage activation. The EMBO Journal, 17(13), 3660–3668. [DOI] [PMC free article] [PubMed] [Google Scholar]
- Lee, S. K. , Kim, S. D. , Kook, M. , Lee, H. Y. , Ghim, J. , Choi, Y. , Zabel, B. A. , Ryu, S. H. , & Bae, Y. S. (2015). Phospholipase D2 drives mortality in sepsis by inhibiting neutrophil extracellular trap formation and down‐regulating CXCR2. Journal of Experimental Medicine, 212(9), 1381–1390. [DOI] [PMC free article] [PubMed] [Google Scholar]
- Lin, S. C. , Lo, Y. C. , & Wu, H. (2010). Helical assembly in the MyD88‐IRAK4‐IRAK2 complex in TLR/IL‐1R signalling. Nature, 465(7300), 885–890. [DOI] [PMC free article] [PubMed] [Google Scholar]
- Lolmede, K. , Campana, L. , Vezzoli, M. , Bosurgi, L. , Tonlorenzi, R. , Clementi, E. , Bianchi, M. E. , Cossu, G. , Manfredi, A. A. , & Brunelli, S. (2009). Inflammatory and alternatively activated human macrophages attract vessel‐associated stem cells, relying on separate HMGB1‐and MMP‐9‐dependent pathways. Journal of Leukocyte Biology, 85(5), 779–787. [DOI] [PubMed] [Google Scholar]
- Lucas, T. , Waisman, A. , Ranjan, R. , Roes, J. , Krieg, T. , Muller, W. , Roers, A. , & Eming, S. A. (2010). Differential roles of macrophages in diverse phases of skin repair. The Journal of Immunology, 184(7), 3964–3977. [DOI] [PubMed] [Google Scholar]
- Medzhitov, R. , & Horng, T. (2009). Transcriptional control of the inflammatory response. Nature Reviews Immunology, 9(10), 692–703. [DOI] [PubMed] [Google Scholar]
- Mirza, R. , DiPietro, L. A. , & Koh, T. J. (2009). Selective and specific macrophage ablation is detrimental to wound healing in mice. American Journal of Pathology, 175(6), 2454–2462. [DOI] [PMC free article] [PubMed] [Google Scholar]
- Murray, P. J. (2017). Macrophage polarization. Annual Review of Physiology, 79, 541–566. [DOI] [PubMed] [Google Scholar]
- Negishi, H. , Ohba, Y. , Yanai, H. , Takaoka, A. , Honma, K. , Yui, K. , Matsuyama, T. , Taniguchi, T. , & Honda, K. (2005). Negative regulation of Toll‐like‐receptor signaling by IRF‐4. Proceedings of the National Academy of Sciences of the United States of America, 102(44), 15989–15994. [DOI] [PMC free article] [PubMed] [Google Scholar]
- Nelson, A. J. , Stephenson, D. J. , Cardona, C. L. , Lei, X. , Almutairi, A. , White, T. D. , Tusing, Y. G. , Park, M. A. , Barbour, S. E. , Chalfant, C. E. , Ramanadham, S. , & Nelson, A. J. (2020). Macrophage polarization is linked to Ca2+‐independent phospholipase A(2) β‐derived lipids and cross‐cell signaling in mice. Journal of Lipid Research, 61(2), 143–158. [DOI] [PMC free article] [PubMed] [Google Scholar]
- Qualls, J. E. , Neale, G. , Smith, A. M. , Koo, M. S. , DeFreitas, A. A. , Zhang, H. , Kaplan, G. , Watowich, S. S. , & Murray, P. J. (2010). Arginine usage in mycobacteria‐infected macrophages depends on autocrine‐paracrine cytokine signaling. Science Signaling, 3(135), ra62. [DOI] [PMC free article] [PubMed] [Google Scholar]
- Saitoh, S.i , Akashi, S. , Yamada, T. , Tanimura, N. , Kobayashi, M. , Konno, K. , Matsumoto, F. , Fukase, K. , Kusumoto, S. , & Nagai, Y. (2004). Lipid A antagonist, lipid IVa, is distinct from lipid A in interaction with Toll‐like receptor 4 (TLR4)‐MD‐2 and ligand‐induced TLR4 oligomerization. International Immunology, 16(7), 961–969. [DOI] [PubMed] [Google Scholar]
- Satoh, T. , Takeuchi, O. , Vandenbon, A. , Yasuda, K. , Tanaka, Y. , Kumagai, Y. , Miyake, T. , Matsushita, K. , Okazaki, T. , Saitoh, T. , Honma, K. , Matsuyama, T. , Yui, K. , Tsujimura, T. , Standley, D. M. , Nakanishi, K. , Nakai, K. , & Akira, S. (2010). The Jmjd3‐Irf4 axis regulates M2 macrophage polarization and host responses against helminth infection. Nature Immunology, 11(10), 936–944. [DOI] [PubMed] [Google Scholar]
- Schmidt, A. , Zhang, X. M. , Joshi, R. N. , Iqbal, S. , Wahlund, C. , Gabrielsson, S. , Harris, R. A. , & Tegnér, J. (2016). Human macrophages induce CD4++ Foxp3+ + regulatory T cells via binding and re‐release of TGF‐β. Immunology and Cell Biology, 94(8), 747–762. [DOI] [PubMed] [Google Scholar]
- Shukla, S. , Elson, G. , Blackshear, P. J. , Lutz, C. S. , & Leibovich, S. J. (2017). 3'UTR AU‐Rich Elements (AREs) and the RNA‐Binding Protein Tristetraprolin (TTP) are not required for the LPS‐mediated destabilization of phospholipase‐Cβ‐2 mRNA in murine macrophages. Inflammation, 40(2), 645–656. [DOI] [PMC free article] [PubMed] [Google Scholar]
- Stieglitz, K. A. (2018). Structural insights for drugs developed for phospholipase D enzymes. Current Drug Discovery Technologies, 15(2), 81–93. [DOI] [PubMed] [Google Scholar]
- Strazza, M. , & Mor, A. (2017). Consider the chemokines: A review of the interplay between chemokines and T cell subset function. Discovery Medicine, 24(130), 31–39. [PMC free article] [PubMed] [Google Scholar]
- Takeuchi, O. , & Akira, S. (2010). Pattern recognition receptors and inflammation. Cell, 140(6), 805–820. [DOI] [PubMed] [Google Scholar]
- Tanguy, E. , Wang, Q. , Moine, H. , & Vitale, N. (2019). Phosphatidic acid: From pleiotropic functions to neuronal pathology. Frontiers in Cellular Neuroscience, 13, 2. [DOI] [PMC free article] [PubMed] [Google Scholar]
- Tidball, J. G. , & Villalta, S. A. (2010). Regulatory interactions between muscle and the immune system during muscle regeneration. American Journal of Physiology‐Regulatory Integrative and Comparative Physiology, 298(5), R1173–R1187. [DOI] [PMC free article] [PubMed] [Google Scholar]
- Uezumi, A. , Fukada, S. , Yamamoto, N. , Takeda, S. , & Tsuchida, K. (2010). Mesenchymal progenitors distinct from satellite cells contribute to ectopic fat cell formation in skeletal muscle. Nature Cell Biology, 12(2), 143–152. [DOI] [PubMed] [Google Scholar]
- Urbahn, M. A. , Kaup, S. C. , Reusswig, F. , Kruger, I. , Spelleken, M. , Jurk, K. , Klier, M. , Lang, P. A. , & Elvers, M. (2018). Phospholipase D1 regulation of TNF‐alpha protects against responses to LPS. Scientific Reports, 8(1), 10006. [DOI] [PMC free article] [PubMed] [Google Scholar]
- Wang, X. , Ge, J. , Tredget, E. E. , & Wu, Y. (2013). The mouse excisional wound splinting model, including applications for stem cell transplantation. Nature Protocols, 8(2), 302–309. [DOI] [PubMed] [Google Scholar]
- Wynn, T. A. , & Vannella, K. M. (2016). Macrophages in tissue repair, regeneration, and fibrosis. Immuniuty, 44, 450–462. [DOI] [PMC free article] [PubMed] [Google Scholar]
- Xue, J. , Schmidt, S. V. , Sander, J. , Draffehn, A. , Krebs, W. , Quester, I. , De Nardo, D. , Gohel, T. D. , Emde, M. , Schmidleithner, L. , Ganesan, H. , Nino‐Castro, A. , Mallmann, M. R. , Labzin, L. , Theis, H. , Kraut, M. , Beyer, M. , Latz, E. , Freeman, T. C. , … Schultze, J. L. (2014). Transcriptome‐based network analysis reveals a spectrum model of human macrophage activation. Immunity, 40(2), 274–288. [DOI] [PMC free article] [PubMed] [Google Scholar]
- Yamamoto, M. , Sato, S. , Hemmi, H. , Hoshino, K. , Kaisho, T. , Sanjo, H. , Takeuchi, O. , Sugiyama, M. , Okabe, M. , Takeda, K. , & Akira, S. (2003). Role of adaptor TRIF in the MyD88‐independent toll‐like receptor signaling pathway. Science, 301(5633), 640–643. [DOI] [PubMed] [Google Scholar]
- Yao, A. , Liu, F. , Chen, K. , Tang, L. , Liu, L. , Zhang, K. , Yu, C. , Bian, G. , Guo, H. , Zheng, J. , Cheng, P. , Ju, G. , & Wang, J. (2014). Programmed death 1 deficiency induces the polarization of macrophages/microglia to the M1 phenotype after spinal cord injury in mice. Neurotherapeutics, 11(3), 636–650. [DOI] [PMC free article] [PubMed] [Google Scholar]
- Ye, Q. , Kantonen, S. , Henkels, K. M. , & Gomez‐Cambronero, J. (2013). A new signaling pathway (JAK‐Fes‐phospholipase D) that is enhanced in highly proliferative breast cancer cells. Journal of Biological Chemistry, 288(14), 9881–9891. [DOI] [PMC free article] [PubMed] [Google Scholar]
- Zhang, D. , Tang, Z. , Huang, H. , Zhou, G. , Cui, C. , Weng, Y. , Liu, W. , Kim, S. , Lee, S. , Perez‐Neut, M. , Ding, J. , Czyz, D. , Hu, R. , Ye, Z. , He, M. , Zheng, Y. G. , Shuman, H. A. , Dai, L. , Ren, B. , … Zhao, Y. (2019a). Metabolic regulation of gene expression by histone lactylation. Nature, 574(7779), 575–580. [DOI] [PMC free article] [PubMed] [Google Scholar]
- Zhang, Y. , Ma, L. , Hu, X. , Ji, J. , Mor, G. , & Liao, A. (2019b). The role of the PD‐1/PD‐L1 axis in macrophage differentiation and function during pregnancy. Human Reproduction, 34(1), 25–36. [DOI] [PubMed] [Google Scholar]
- Zhu, M. , Zou, J. , Li, T. , O'Brien, S. A. , Zhang, Y. , Ogden, S. , & Zhang, W. (2015). Differential roles of phospholipase D proteins in FcepsilonRI‐mediated signaling and mast cell function. The Journal of Immunology, 195(9), 4492–4502. [DOI] [PMC free article] [PubMed] [Google Scholar]
Associated Data
This section collects any data citations, data availability statements, or supplementary materials included in this article.
Supplementary Materials
Supporting information.
Data Availability Statement
The data that support the findings of this study are available from the corresponding author D.S.M., upon reasonable request.


