Abstract
Mochokid catfish offer a distinct opportunity to study a communication system transitioning to a new signaling channel because some produce sounds and others electric discharges. Both signals are generated using an elastic spring system (ESS), which includes a protractor muscle innervated by motoneurons within the protractor nucleus that also has a motoneuron afferent population. Synodontis grandiops and S. nigriventris produce sounds and electric discharges, respectively, and their ESSs show several morphological and physiological differences. The extent to which these differences explain different signal types remains unclear. Here, we compare ESS morphologies and behavioral phenotypes among five mochokids. S. grandiops and S. nigriventris were compared with Synodontis eupterus that is known to produce both signal types, and representative members of two sister genera, Microsynodontis cf. batesii and Mochokiella paynei, for which no data were available. We provide support for the hypothesis that peripheral and central components of the ESS are conserved among mochokids. We also show that the two nonsynodontids are only sonic, consistent with sound production being an ancestral character for mochokids. Even though the three sound producing‐only species differ in some ESS characters, several are similar and likely associated with only sound production. We propose that the ability of S. eupterus to generate both electric discharges and sounds may depend on a protractor muscle intermediate in morphology between sound producing‐only and electric discharge‐only species, and two separate populations of protractor motoneurons. Our results further suggest that an electrogenic ESS in synodontids is an exaptation of a sound producing ESS.
Keywords: animal vocalizations, comparative anatomy, electric fish, evolution, neural pathways
This study provides an anatomical characterization of motor and premotor neurons associated with the muscle producing swim bladder sounds and/or electric discharges in five mochokid catfish. Even though the same muscle and neuronal populations are associated with these behaviors across all species, our results suggest that behavioral differences are associated with quantitative differences, mainly in the size of the protractor muscle and associated skeletal elements, and the number, size and location of motoneurons.
1. INTRODUCTION
Mochokid catfish are present in rivers and lakes across all tropical African basins (Day et al., 2013). Some like the cuckoo catfish (Synodontis grandiops, Figure 1) are brood parasites of mouthbrooding cichlids in the clear water of Lake Tanganyika (Reichard, 2019), while others, like the blotched upside‐down catfish (Synodontis nigriventris, Figure 1) are nocturnal and inhabit more turbid waters in the Congo and the Kouilou‐Niari basins (Poll, 1971). Even though this family is morphologically diverse and has at least nine genera (Vigliotta, 2008), it is mainly (i.e., approximately 60%) represented by species of the Synodontis genus, including ones recently shown to produce electric and/or acoustic signals using the swim bladder‐related elastic spring system (ESS) (Boyle, Colleye, & Parmentier, 2014; Hagedorn, Womble, & Finger, 1990) (Figure 2a–c). This particular feature of the mochokid ESS together with their wide diversity offers a distinct opportunity to study the morphofunctional aspects and evolutionary history of behavioral signaling systems.
FIGURE 1.
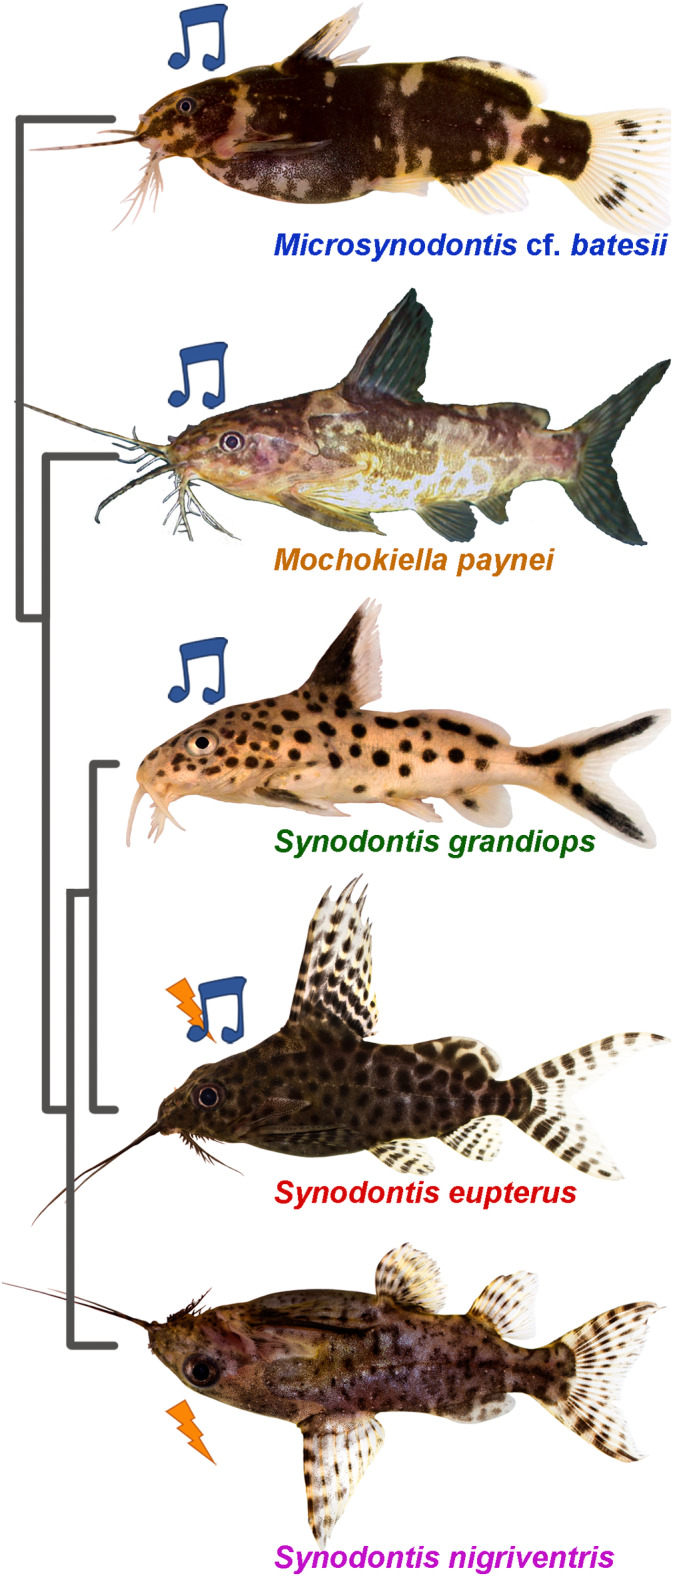
Pictures of the five mochokid species in a left lateral view. The colors used for the species names are consistent throughout the figures. The music notes denote acoustic species; the lightning bolts indicate species producing electric discharges. The five species were placed according to their phylogenetic relationship which was inferred from Day et al. (2013). Picture of Mochokiella paynei was modified with the friendly permission from www.amazon‐exotic‐import.de. All other pictures courtesy of Wolfgang Gessl [Color figure can be viewed at wileyonlinelibrary.com]
FIGURE 2.
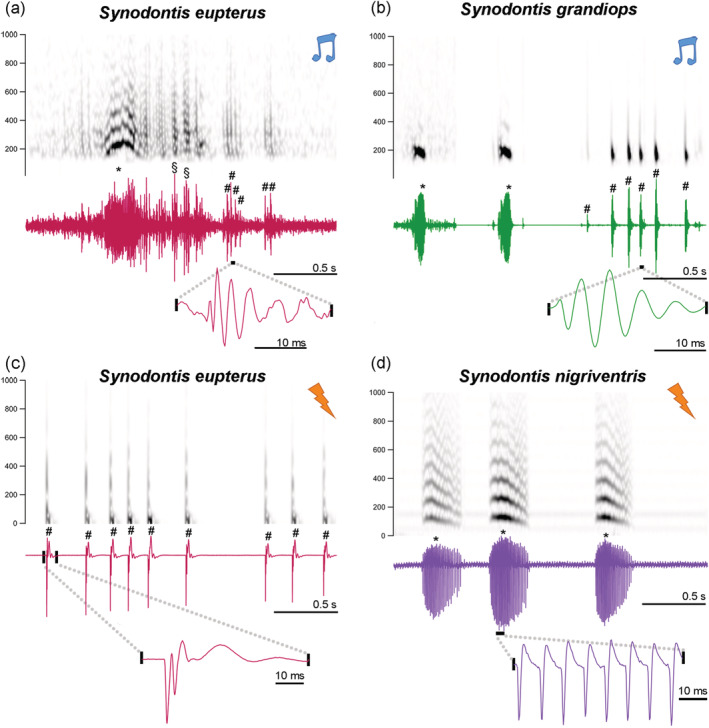
Sounds and weakly electric discharges of Synodontis grandiops, Synodontis nigriventris, and Synodontis eupterus. Spectrograms and waveforms of swim bladder‐generated tonal and pulsed sounds of (a) S. eupterus and (b) S. grandiops. Spectrograms and waveforms of pulsed electric discharges of (c) S. eupterus and a burst of electric discharges of (d) S. nigriventris . Notes indicate sounds while lightning strikes indicate electric discharges. The sampling rate of all recordings was down sampled at 4,000 Hz. Sound recordings were band‐pass filtered between 150 Hz and 1 kHz for illustration. S. grandiops sounds were selected from three different recording tracks. #: Pulsed signal. *: Tonal signal. §: Ambiguous [Color figure can be viewed at wileyonlinelibrary.com]
The ESS includes the elastic spring apparatus (ESA) that consists of the protractor muscle (PM) inserting on the Müllerian ramus (MR), a modified transverse process of the fourth vertebra with a distal plate lying on the rostral part of the swim bladder (Boyle et al., 2014; Hagedorn et al., 1990), that likely evolved independently at least five times in Siluriformes (Parmentier & Diogo, 2006). The ESS also includes a hindbrain motor circuit that drives the PM to generate a weakly electric and/or sonic signal. We recently showed morphological differences in the ESS between two synodontids, S. grandiops that is only a sound producer and S. nigriventris that only produces weakly electric discharges (Kéver, Bass, Parmentier, & Chagnaud, 2020) (Figure 2a,b). For example, the ESA of S. grandiops has a larger plate but shorter stem of the MR, and a larger PM, whereas the PM of S. nigriventris has a more horizontal orientation and fewer myofibrils (also see Boyle et al., 2014). Central differences include neurophysiological properties of protractor motoneurons and species‐specific differences such as the number and dendritic arborization of protractor motoneurons. Even though some neurophysiological properties help to explain species differences in temporal properties (pulse repetition rate) of signals, it remains difficult to assign either these differences or morphological ones more broadly among synodontids or mochokids to production of either sounds or electric discharges based on a comparison of only two species (Kéver et al., 2020).
In the present study, we aimed to identify morphological characters linked to sound‐producing versus weakly electric signaling behaviors by comparing the ESS of S. nigriventris and S. grandiops to a third synodontid species, Synodontis eupterus (Figure 1) that is both sonic and weakly electric (Boyle et al., 2014) (Figure 2c). We also investigated the ESS in species from two sister genera, Mochokiella and Microsynodontis (Figure 1), that diverged earlier than synodontids in mochokid phylogeny (Day et al., 2013) and had not been tested for weakly electric and/or sonic signal production. Together, the results show that the general organization of the ESS is conserved among mochokids. Species differences, however, indicate features that are specific to sound‐producing and weakly electric phenotypes and suggest that an electrogenic ESS is an exaptation of a sound producing ESS.
2. MATERIALS AND METHODS
2.1. Animals
Live fish (the number of individuals used for each experiment are provided in the next sections) were purchased from “Les aquariums de Marbais” (Belgium), “EFS Nürnberg” (Germany), “Aquarium Glaser” (Germany), or “Ruinemans Aquarium B.V.” (Netherlands) depending on the species. They were maintained in monospecific tanks of ~200 L (photoperiod: 12:12 hr L:D; water temperature: 26 ± 1°C) at either Liège University or the Ludwig‐Maximilians‐University (LMU). The tanks were supplied with numerous hiding places and the fish were fed daily with commercial fish food. As the animals were acquired from the aquarium trade, their age was undetermined. All experimental procedures were approved by the Institutional Animal Care and Use Committee of the University of Liège (protocols 1,970 and 2,110) and the Regierung von Oberbayern (55.2‐1‐54‐2532‐13‐2016).
2.2. Sounds and electric discharges
Boyle et al. (2014) demonstrated the electric signals of S. nigriventris and S. eupterus (designated S. euptera by these authors), and the sounds of S. eupterus and S. grandiops. Following the same protocol, Kéver et al. (2020) presented and analyzed additional recordings of S. nigriventris and S. grandiops. In the present study, the signaling behavior of nine Mo. paynei (SL: 34–43 mm) and four Mi. cf. batesii (standard length, SL: 26–37 mm) was investigated following the same recording protocol. Briefly, using an HTI‐Min 96 hydrophone (−186.4 dBV re 1μPa, frequency response 2 Hz–30 kHz; High Tech Inc.; Long Beach, MS) and two stainless steel insulated electrodes (1 cm exposed tips) placed 50 cm apart, sounds and electric discharges were recorded simultaneously in a 70 × 30 cm tank (water depth approximately 20 cm). Electrodes were connected to a differential amplifier (A‐M Systems Model 1700) that filtered (band pass: 10 Hz–10 kHz; notch filter: on) and amplified the signal (10k times). Both types of signals were digitized using an external sound card (Creative model SB0270; Creative Labs, Singapore) and saved on a computer using Adobe Audition 2.0 (Adobe, San Jose, CA).
Recordings were band‐pass filtered (150–1,000 Hz) using Adobe Audition software. Four acoustic variables were measured only for recordings with good signal to noise ratio (N = 184 for Mo. paynei and N = 225 for Mi. cf batesii): duration (time interval between the beginning of the first to the end of the last pulse of an event or from the beginning to the end of one pulse in single pulse events), pulse period (time interval between the onset of successive pulses), and first and second peak frequencies (two highest peaks in the power spectrum of an event). Two successive events were considered part of a train if the interevent interval was less than 1 s. In addition to ESA signals, all five species produced stridulation sounds with the pectoral spine apparatus (Figure 3). The physical attributes of these sounds were not analyzed as the focus here is on the mechanisms underlying ESA generated sounds that are distinctly different from stridulation sounds, for example, highest peaks in the power spectrum are typically >500 Hz and often in the kHz range (Figure 3).
FIGURE 3.
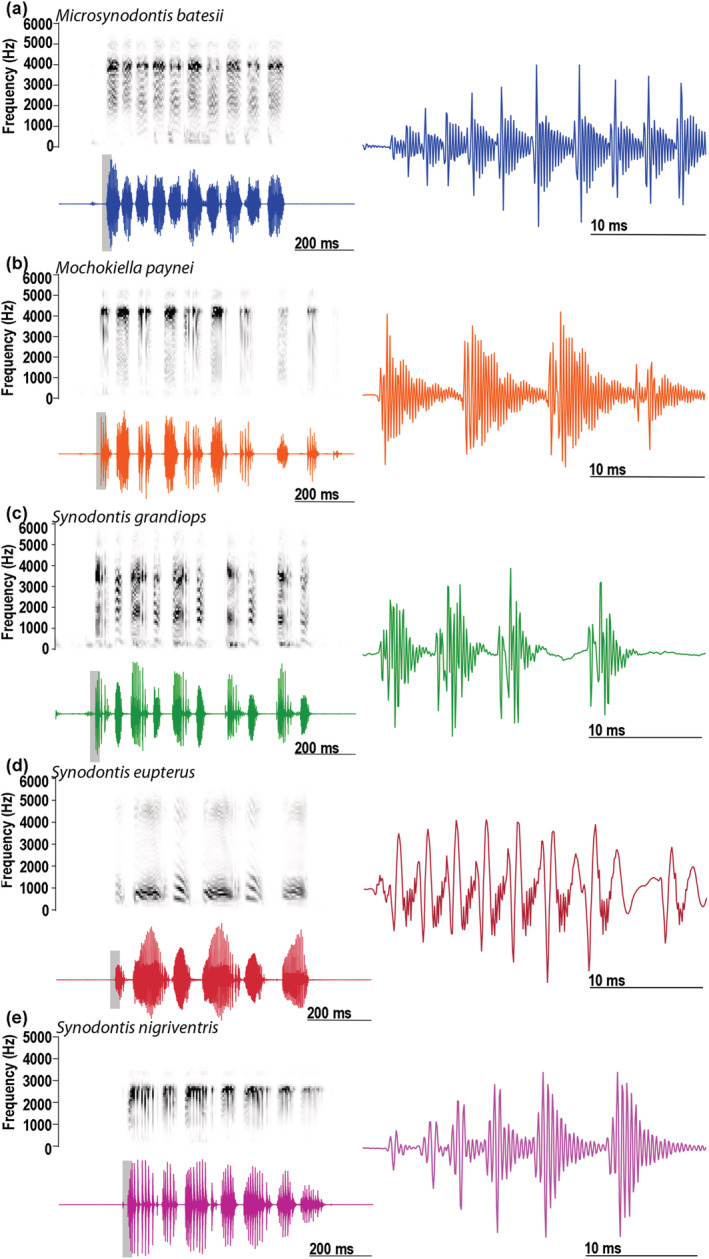
Spectrograms and oscillograms of stridulation sounds produced by the five mochokid species. Stridulation sound produced by (a) a Microsynodontis cf. batesii (standard length, SL: 34 mm), (b) a Mochokiella paynei (SL: 37 mm), (c) a Synodontis grandiops (SL: 74 mm), (d) a S. eupterus (SL: 119 mm), and (e) S. nigriventris (SL: 66 mm). Sound samples were low pass filtered at 4.5 kHz to remove potential resonant frequency (see Akamatsu, Okumura, Novarini, & Yan, 2002) and high‐pass filtered at 150 Hz to remove potential electric noise. Sampling rate of the recording was reduced to 12 kHz to improve the display of the spectrograms. Waveforms to the right show first sound (highlighted by gray shading) in the oscillograms to the left [Color figure can be viewed at wileyonlinelibrary.com]
2.3. Morphology of the ESA
Four Mi. cf. batesii (SL: 31–39 mm), six Mo. paynei (SL: 37–48 mm), ten S. eupterus (SL: 32–125 mm), six S. grandiops (SL: 67–98 mm), and five S. nigriventris (SL: 52–72 mm) were euthanized in 0.025% benzocaine or 0.02% tricaine methanesulfonate dissolved in aquarium water and subsequently fixed in 7% formalin and stored in 70% ethanol. These fish were then dissected except for three specimens that were scanned at resolutions of 50 μm (Mo. paynei of 35 mm SL) or 27 μm (Mo. paynei CUMV 91903 of 48 mm SL and S. eupterus CUMV 89004 of 92 mm SL) using a GE eXplore CT‐120 at Cornell University Imaging Facility or a Bruker SkyScan 1173 at Friday Harbor Laboratories. The MR in all study species was imaged under a stereoscopic microscope (Wild M10 equipped with a MC 170 HD camera, Leica, Wetzlar, Germany) or reconstructed in AMIRA 5.4.0 (VSG, FEI company). The MR's length, plate surface area and thickness, and lengths of the stem and stem process were measured in ImageJ (Wayne Rasband, National Institute of Health) or Photoshop (Adobe, San Jose, CA). The PMs of three Mi. cf. batesii, four Mo. paynei, six S. eupterus, six S. grandiops, and three S. nigriventris were placed overnight in 0.1 M phosphate buffer. The mass and the midline and thickness lengths of the muscle were measured with a precision scale or following the protocol described above for the MR, respectively. While not all animals were sexed, observations of males and females did not reveal any obvious sexual dimorphism in the ESA.
The PMs of two Mi. cf. batesii, three Mo. paynei, one S. eupterus, one S. grandiops, and one S. nigriventris were fixed in 1% glutaraldehyde and stored in 0.1 M sodium cacodylate buffer. These muscles were cut in up to six pieces depending on their size, and sectioned on a Reichert‐Jung Ultracut E ultramicrotome (Leica) into transverse, semithin (1.0 μm) sections and then stained with toluidine blue (1% pH 9) for later imaging under a stereoscopic microscope (Wild M10, Leica) with a camera (Leica Mc170 Hd with LAS EZ). The mean diameter and the proportion of myofibrils were measured in Photoshop for 10 muscle fibers per section.
2.4. Protractor neural circuit
To visualize the ESS motor network, fish were first deeply anesthetized with 0.025% benzocaine or 0.02% tricaine methanesulfonate (MS‐222), placed in a dissection tray, and kept moist with aquarium water. Long‐term anesthetic (0.25% bupivacaine) was applied with a soaked kimwipes tissue placed on top of the surgical spot and the PM was exposed. The PM nerve was cut and labeled at the level of the muscle with crystals of dextran‐rhodamine or Alexa dextran 488 (Invitrogen; methods adapted from Bass, Marchaterre, & Baker, 1994) in three Mi. cf. batesii (standard length, SL: 27–41 mm), four Mo. paynei (SL: 40–45 mm), five S. grandiops (SL: 67–88 mm), three S. eupterus (SL: 39–46 mm), three S. nigriventris (SL: 46–57 mm), and with neurobiotin in four Mi. cf. batesii (SL: 33–39 mm), four Mo. paynei (SL: 40–45 mm), two S. grandiops (SL: 54–58 mm), three S. eupterus (SL: 39–46 mm), and three S. nigriventris (SL: 46–58 mm). In some cases, both tracers were applied simultaneously on the cut end of the nerve. After a survival time of 1–4 days depending on size, fish were deeply anesthetized with benzocaine or MS‐222 and then transcardially perfused with freshwater teleost Ringer solution followed by a solution of 4% paraformaldehyde in 0.1 M PB. The brain and far rostral spinal cord were dissected from the skull, postfixed for 1–2 hr, and stored in 0.1 M PB. Tissue was embedded in 4% agar and sectioned in the transverse plane (100 μm) using a T1200S Vibratome (Leica Microsystems GmbH; Wetzlar, Germany). Floating sections were washed in 0.5% Triton X100 (Sigma Aldrich Chemie GmbH; Munich, Germany) in 0.1 M PB (PB‐T) and incubated overnight in a 1:500 Cy3‐ or Alexa488‐streptavidin in PB‐T solution. Sections were washed the following day three times (30 min each) in 0.1 M PB, mounted on slides, and coverslipped using a fluorescent mounting medium (Vectashield, Vector Labs Inc.; Peterborough, UK) containing 4′,6‐diamidino‐2‐phenylindole.
Sections with backlabeled cells or fibers were imaged using either an epifluorescence (ECLIPSE Ni, Nikon GmbH, Düsseldorf, Germany) or confocal laser microscope (Leica Microsystems). Maximal projections obtained from image stacks were cropped and optimized in Adobe Photoshop CS4 (Adobe, San Jose, CA) for illustrations.
Protractor nucleus (PN) length (i.e., rostral–caudal extent, mm) and volume (mm3) were measured/calculated and the ratio between the volume occupied by motoneurons and the total PN volume was estimated for every specimen. For the 10 specimens that were colabeled with neurobiotin and dextran‐rhodamine, these variables were measured independently for each marker and compared using a paired t test. Since no significant difference was found for any of the three morphometric measures (PN length: df = 9, t = 1.16, p = .276; PN volume: df = 9, t = 2.24, p = .052; MN/PN ratio: df = 9, t = 0.84, p = .421), the values for each measure were combined for specimens labeled with either neurobiotin or dextran‐rhodamine.
In addition, every PN labeled soma was counted, and the cell count was corrected using Abercrombie's equation (Abercrombie, 1946). For three sections per specimen, the average diameters of PN somata (total of 761; 1,036; and 462 somata labeled with dextran‐rhodamine, neurobiotin on the ipsilateral PN, and neurobiotin on the contralateral PN, respectively) were measured in Adobe Photoshop CS4 (Adobe, San Jose, CA). The mean soma diameter per specimen and the distribution of individual soma sizes were determined. For these variables, data obtained with neurobiotin or dextran‐rhodamine were analyzed separately since neurobiotin labeled motoneurons and, in addition, premotor neurons via transneuronal transport (see Bass et al., 1994).
2.5. Statistical analysis
The acoustic features of Mi. cf. batesii and Mo. paynei were compared with Mann–Whitney U tests. The effect of the specimen size on the morphometric variables was tested using linear regressions of the log‐transformed data on the log‐transformed standard lengths. Residuals of linear regressions were used for statistical comparisons (i.e., significance tests and effect sizes) when the fit of the linear model was significant (Tables S1 and S2). Otherwise, the analyses were conducted on log‐transformed data. Interspecific differences in morphometric data collected from the ESA and the PN were assessed using principal component (PC) analyses. Data collected for each variable were compared among the five study species in GraphPad Prism 5 or PAST v3 using significance tests (PERMANOVA followed by pair comparisons for multivariate analyses and Kruskal–Wallis analysis of variance followed by Dunn's post hoc tests for univariate tests). Effect size was also estimated because it can provide a more accurate assessment of interspecific differences when the sample sizes are small for one or more measures in some species. The “median difference” was calculated and displayed based on the method of Ho, Tumkaya, Aryal, Choi, and Claridge‐Chang (2019), with S. nigriventris, the single “electric‐only” species, serving as the control. Using one species as a control provided a more convenient way to compare the five species than paired comparisons. All effect sizes were calculated using the R package “dabestr” (Ho et al., 2019).
3. RESULTS
3.1. Signaling behavior
Mochokiella paynei and Mi. cf. batesii produced ESA sounds (Figure 4); neither species produced electric discharges. Acoustic events were emitted alone or in trains lasting up to 3 s in Mo. paynei and up to 6 s in Mi. cf. batesii. The first and second peak frequencies of these sounds were significantly lower (Mann–Whitney U test on first peak, Z = 2036, p < .0001; Mann–Whitney U test on second peak, Z = 2,443, p < .0001) in Mo. paynei (196 ± 45 Hz and 418 ± 118 Hz) compared to Mi. cf. batesii (296 ± 33 Hz and 609 ± 59 Hz). In both species, acoustic events varied from pulsed (Figure 4a,b) to more tonal sounds composed of repetitive, highly stereotyped pulses (Figure 4c,d) lasting up to 246 and 83 ms in Mo. paynei and Mi. cf. batesii, respectively. Events with two pulses were the most common in both species (Figure 4e,f). The mean duration of the time interval between successive pulses in the tonal sounds (i.e., pulse period) was significantly longer (Mann–Whitney U test, Z = 85,890, p < .0001) in Mo. paynei than in Mi. cf. batesii (5.5 ± 2.1 ms and 3.2 ± 1.0 ms, respectively). As the inverse of the mean first peak frequency (5.1 and 3.4 ms, respectively) almost perfectly matched the pulse period in each species, the contraction rate of the sonic muscle is setting the sound's first peak frequency (fundamental for tonal sounds). The larger size of Mo. paynei individuals compared to Mi. cf. batesii (37 ± 2 mm and 32 ± 5 mm in SL, respectively) may have contributed to species differences in pulse period and peak frequencies (see Connaughton, Taylor, & Fine, 2000; Kéver et al., 2014; Tellechea, Martinez, Fine, & Norbis, 2010; Tellechea & Norbis, 2012; Vasconcelos & Ladich, 2008 for similar effect of fish size on these sound features), but a larger sample size is needed to be more conclusive.
FIGURE 4.
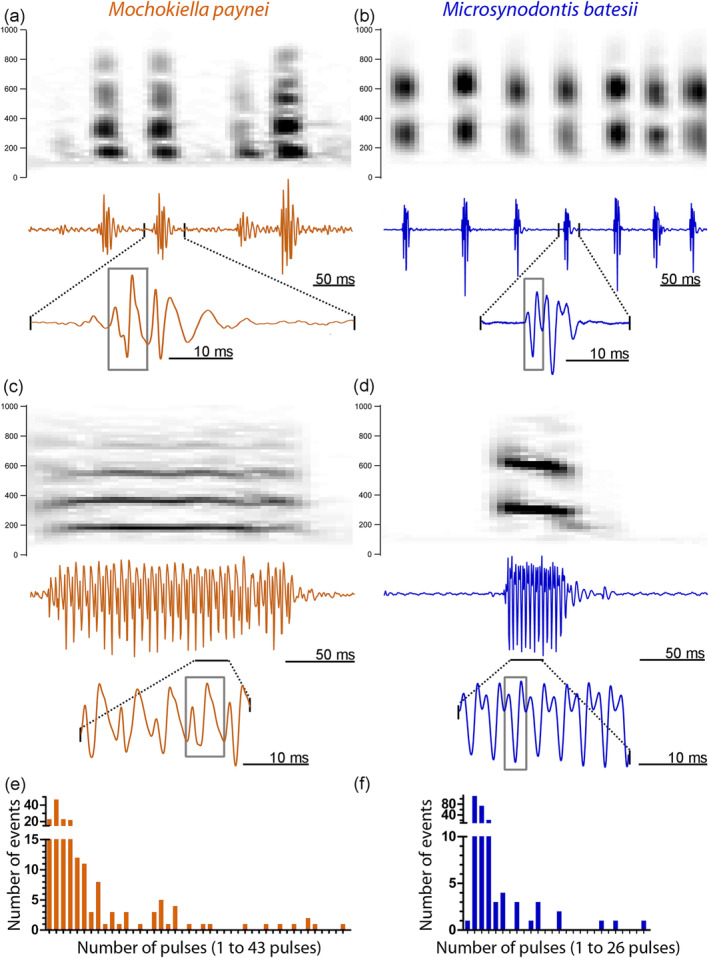
Sounds of Mochokiella paynei and Microsynodontis cf. batesii. Spectrograms and waveforms of short pulse‐like sounds of (a) Mo. paynei and (b) Mi. cf. batesii. Spectrograms and waveforms of a tonal sound of (c) Mo. paynei and (d) Mi. cf. batesii. Histograms of the number of pulses in the acoustic events recorded for Mo. paynei and Mi. cf. batesii. Gray frames delineate oscillation units. Recordings were down sampled at 4,000 Hz and high‐pass filtered at 150 Hz for illustration [Color figure can be viewed at wileyonlinelibrary.com]
3.2. ESA morphology
There were obvious interspecific differences in the insertion point of the PM (Figure 5b). In Mi. cf. batesii and Mo. paynei, the PM originates mainly on the nuchal shield (i.e., bony plates located between to the dorsocaudal part of the neurocrianium and the dorsal fin, NS in Figure 5a), although some fibers were attached to the caudal part of the neurocranium. In the three synodontids, there were also some fibers attached to the neurocranium, but most of them originated more caudally under the dorsal fin (Figure 5). The PM inserts directly on the plate of the MR in Mi. cf. batesii, while in every other species it inserts on a process located on the stem of the MR that was absent in Mi. cf. batesii (Figure 5b).
FIGURE 5.
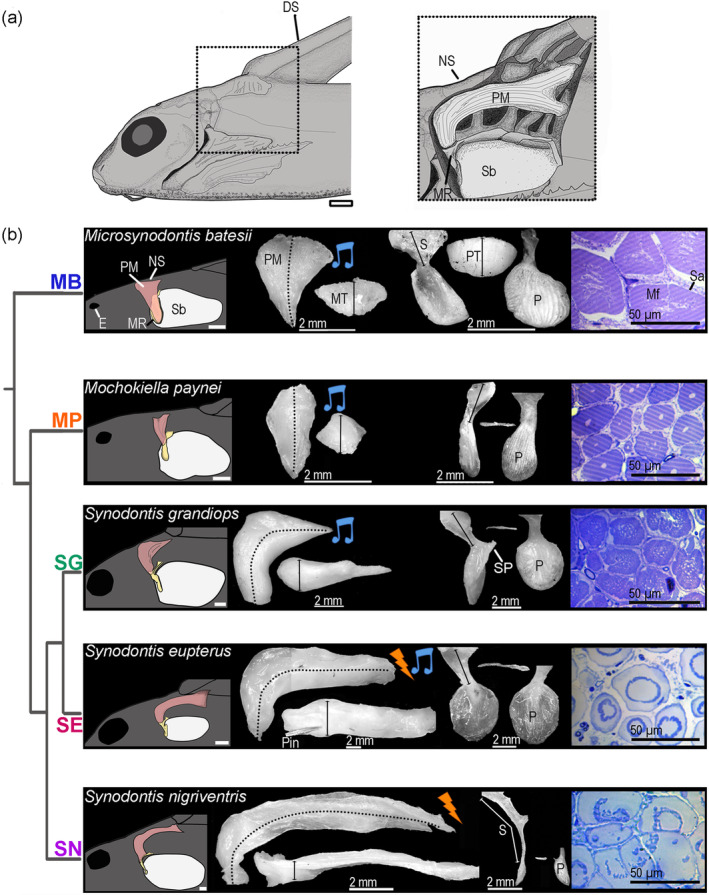
Morphology of the elastic spring apparatus of five mochokid catfish. (a) Schematic of the head and anterior trunk of a Synodontis eupterus in a left lateral view. The position of the elastic spring apparatus (ESA) is outlined in the box. The right part shows a magnified view of the ESA. (b) Drawing of the ESA and the swim bladder (far left); lateral and dorsal views of the protractor muscle (middle left); lateral, ventral, and inner views of the MR (middle right); and transverse section of the protractor muscle (far right) for each of the five mochokid species placed according to their phylogenetic relationship which was inferred from Day et al. (2013). Pictures of the protractor muscle and MR were standardized along the y axis. DS, dorsal spine; E, eye; Mf, myofibrils; MR, Müllerian ramus; MT, muscle thickness; NS, nuchal shield; P, plate; PT, plate thickness; S, stem of the MR; Sa, sarcoplasm; Sb, swim bladder; SP, stem process. Scale bars for far left and two middle panels: 2 mm. Scale bar for far right panels: 50 μm [Color figure can be viewed at wileyonlinelibrary.com]
A PC analysis of the ESA based on the eight morphometric measures showed that individuals tended to cluster by species (Figure 6a; Table S3). Multivariate and univariate significance tests found differences between species (Table S1). Based on the uncorrected univariate tests, the length of the MR did not differ between any species, while the other variables showed significant differences. However, after the sequential Bonferroni correction, only plate surface, stem length, stem process length, and PM mass still showed significant interspecific differences (Table S1).
FIGURE 6.
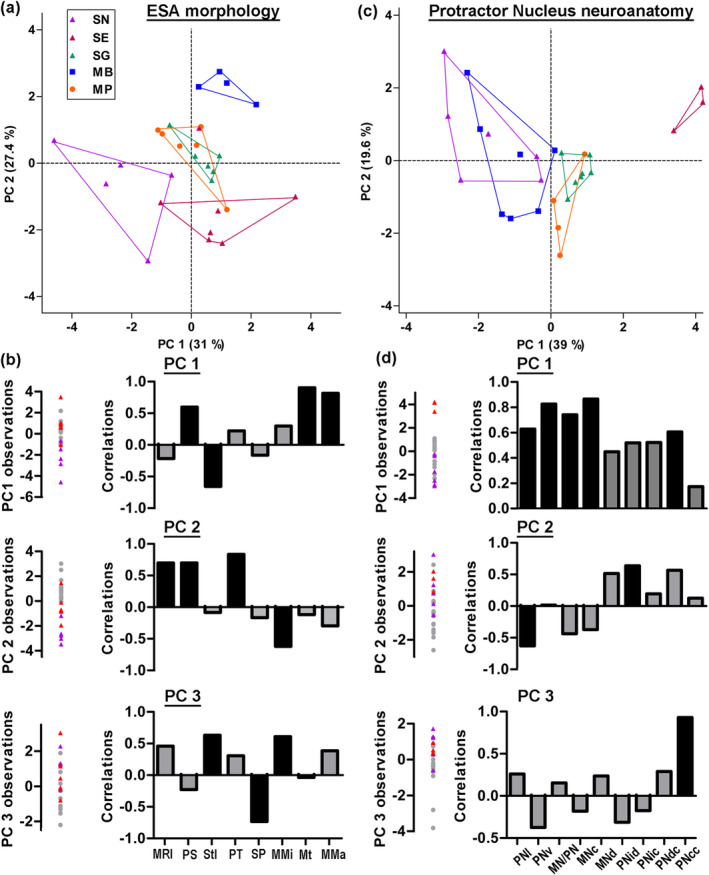
Principal component (PC) analyses of the elastic spring system of five mochokid catfish. PC analyses for the eight variables analyzed for the elastic spring apparatus (a,b) and the nine analyzed for the protractor nucleus neuroanatomy (c,d). (a,c) Coordinates of the individuals on PC 1 and PC 2. (b,d) Coordinates of the individuals for the first three PCs (left) and correlations between these PCs and each variable (right). In (b and d), the three species producing only sounds are identified by gray dots. Species MB, Microsynodontis cf. batesii; MP, Mochokiella paynei; SG, Synodontis grandiops; SE, S. eupterus; SN, S. nigriventris. Morphometric abbreviations—MMa, protractor muscle mass; MMi, midline length of protractor muscle; MNc, number of dextran‐labeled motoneurons in PN; MNd, diameter of dextran‐labeled motoneurons (mean per specimen); MN/PN, ratio between PN volume occupied by MN somata and total PN volume; MR, Müllerian ramus; MRl, MR length; Mt, protractor muscle thickness; PN, protractor nucleus; PNcc, number of neurobiotin‐labeled motor and premotor neurons in contralateral PN; PNcd, mean soma diameter of neurobiotin‐labeled neurons in contralateral PN; PNic, number of neurobiotin‐labeled neurons in ipsilateral PN; PNid, mean soma diameter of neurobiotin‐labeled neurons in ipsilateral PN; PNl, length of PN; PS, surface area of MR plate; PNv, PN volume; PT, thickness of MR plate; SP, length of MR process; Stl, length of MR stem [Color figure can be viewed at wileyonlinelibrary.com]
On the PC1‐PC2 plot, S. nigriventris (electric signal producer) was completely separated from the three species that only produced sound (Figure 6a). The multivariate post hoc comparisons supported this observation since S. nigriventris differed (p < .05) from every other species (Table S1). According to the variable loadings of PC1, S. nigriventris had the MR with the smallest plate but the longest stem, and the lightest and thinnest PM (Figure 6a,b). Along PC2, S. nigriventris and S. eupterus had the smallest MR with the smallest and thinnest plate, but the longest PM. These characteristics of the S. nigriventris plate surface, stem length, and muscle thickness were supported by marked differences in effect sizes (Figures 7 and 8). Post hoc pair comparisons showed that S. nigriventris had a smaller plate than Mi. cf. batesii, Mo. paynei, and S. grandiops, a longer stem than Mo. paynei and S. grandiops, and a shorter process than S. grandiops (Table S1). The effect size for muscle midline length also supported S. nigriventris and S. eupterus having longer PMs than the three species producing only sound (Figure 8).
FIGURE 7.
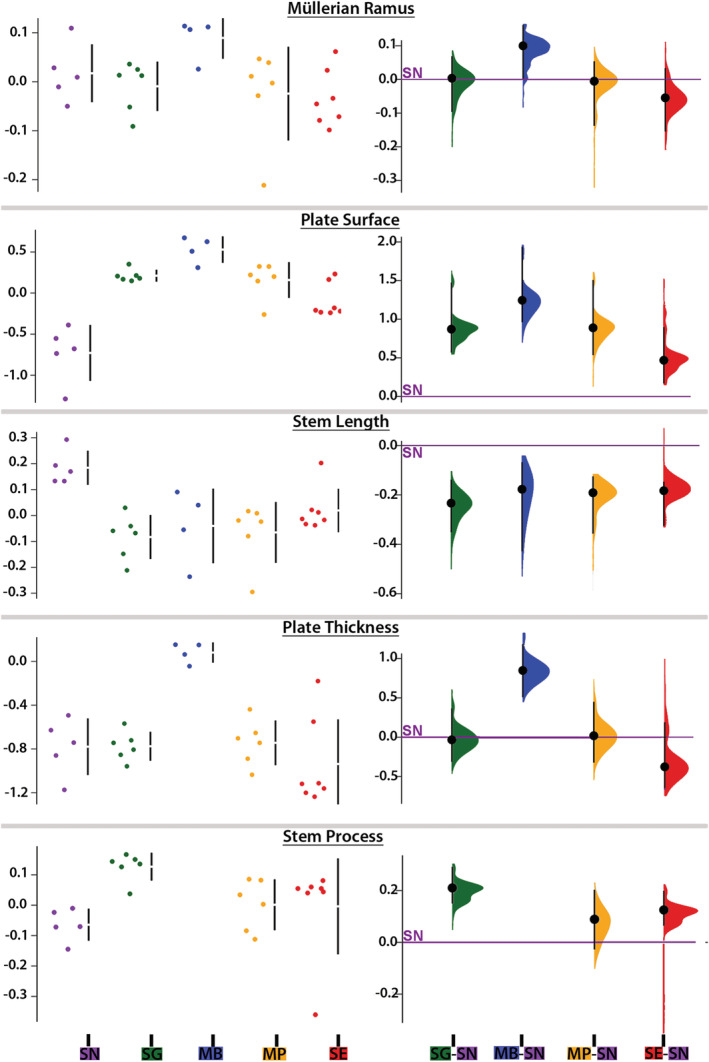
Morphometric features of the Müllerian ramus (MR) of five mochokid catfish. Data (i.e., residuals of the linear regression against standard length when it was significant or log‐transformed values when the linear regression was not significant) distributions (left) and effect sizes (right) computed from pair comparisons with Synodontis nigriventris (zero on the Y axis) for MR length, plate surface, stem length, plate thickness, and length of the stem process. See Figure 4 legend for species abbreviations [Color figure can be viewed at wileyonlinelibrary.com]
FIGURE 8.
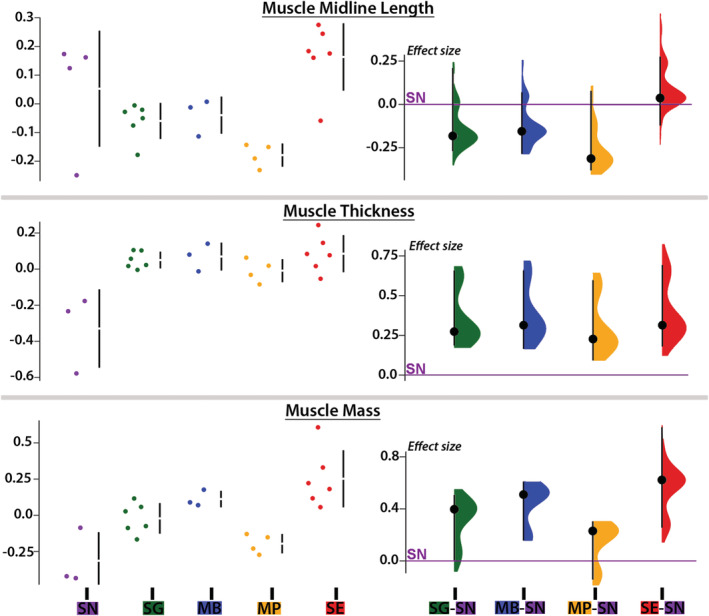
Morphometric features of the protractor muscle of five mochokid catfish. Data (i.e., residuals of the linear regression against standard length when it was significant or log‐transformed values when the linear regression was not significant) distributions (left) and effect sizes (right) computed from pair comparisons with Synodontis nigriventris (zero on the Y axis) for midline length, thickness, and mass of protractor muscle. See Figure 4 legend for species abbreviations [Color figure can be viewed at wileyonlinelibrary.com]
Even though S. eupterus shared features with every other species, it was clearly separated from S. nigriventris along PC1 and from the species that produced only sound along PC2 (Figure 6a). Based on the variable loadings (Figure 6b), S. eupterus had a shorter stem, a larger plate and a thicker PM than S. nigriventris, while its PM was longer, and its plate was smaller and thinner than in the species producing only sounds. These trends were also distinct on the graphs showing the effect sizes for these variables (Figures 7 and 8). Based on the post hoc tests, S. eupterus had a heavier PM than S. nigriventris and Mo. paynei, a longer muscle than Mo. paynei, and a thinner plate than Mi. cf. batesii (Table S1). Along PC3, both S. nigriventris and S. eupterus were separated from the three species that produced only sounds because of their shorter stem process (with the exception of Mi. cf. batesii, which had no process on the stem since the PM inserts on the plate) and their longer stem and PM (Figure 6b). However, the effect size showed that PM length was the only distinguishing feature. Note also that Mi. cf. batesii separated from the other four species along PC2 (Figure 6a; also see multivariate post hoc comparisons, Table S1). This was mostly explained by its much thicker plate (Figure 7). Considering the effect sizes obtained for most of the variables and the obvious interspecific differences observed during the dissections, it is likely that a larger sampling would highlight more significant differences.
The PMs of three species that produced only sound had a higher proportion of myofibrils (Mi. cf. batesii: 87 ± 3%; Mo. paynei: 71 ± 3%; S. grandiops: 62%) compared to the two that were either both sonic and weakly electric (S. eupterus: 18%) or only weakly electric (S. nigriventris: 13%) (Figure 5b). This was consistent with the findings of Boyle et al. (2014) for the three synodontid species. Mean fiber diameters did not follow a similar pattern and were 50 ± 3 μm (Mi. cf. batesii, N fish = 2, N fibers = 32), 25 ± 5 μm (Mo. paynei, N fish = 3, N fibers = 59), 67 ± 20 μm (S. grandiops, N fish, N fibers = 50), 35 ± 4 μm (S. eupterus, N fish = 1, N fibers = 80), and 41 ± 6 μm (S. nigriventris, N fish = 1, N fibers = 30). The linear regression of fiber diameter and fish standard length was not significant (F (1,6) = 1.58, p = .26. r 2 = .21).
3.3. PM neural circuitry
A PC analysis based on the nine morphometric measures of protractor motor and premotor populations showed that S. eupterus, which is both sonic and weakly electric, was separate from the other study species (Figure 6c). This was clearly visible in histological sections (Figure 9b–d) and resulted from five measures that were highly and positively correlated with PC1 (Figure 6d). Synodontis eupterus had a larger (length and volume) PN with a higher proportion and number of motoneurons, as well as a larger mean soma diameter for neurons labeled with neurobiotin in the contralateral PN. The different plots produced during the analysis of the effect sizes (Figures 10 and 11) showed similar trends for these variables with the largest effect sizes generally observed between S. eupterus and S. nigriventris. On the PC1‐PC2 plot, the weakly electric S. nigriventris overlapped with the sound producer Mi. cf. batesii, while the sound producers S. grandiops and Mo. Paynei seemed highly similar (Figure 6c). This was also clearly the case considering the effect sizes for the five variables highly correlated with PC1 (Figures 10 and 11). Based on PC2, the three species producing only sound had a longer PN with a higher mean soma diameter for motor and premotor neurons labeled with neurobiotin in the ipsilateral PN (Figure 6d), but this was not distinct when effect sizes were considered (Figures 10 and 11). Along PC3, the three sound‐producing only species had fewer neurons labeled with neurobiotin in the contralateral PN (Figure 6d); this was mainly due to S. grandiops and, to a lesser extent, Mi. cf. batesii (Figure 11). Multivariate analysis confirmed that there were interspecific differences between every pair of species (Table S2).
FIGURE 9.
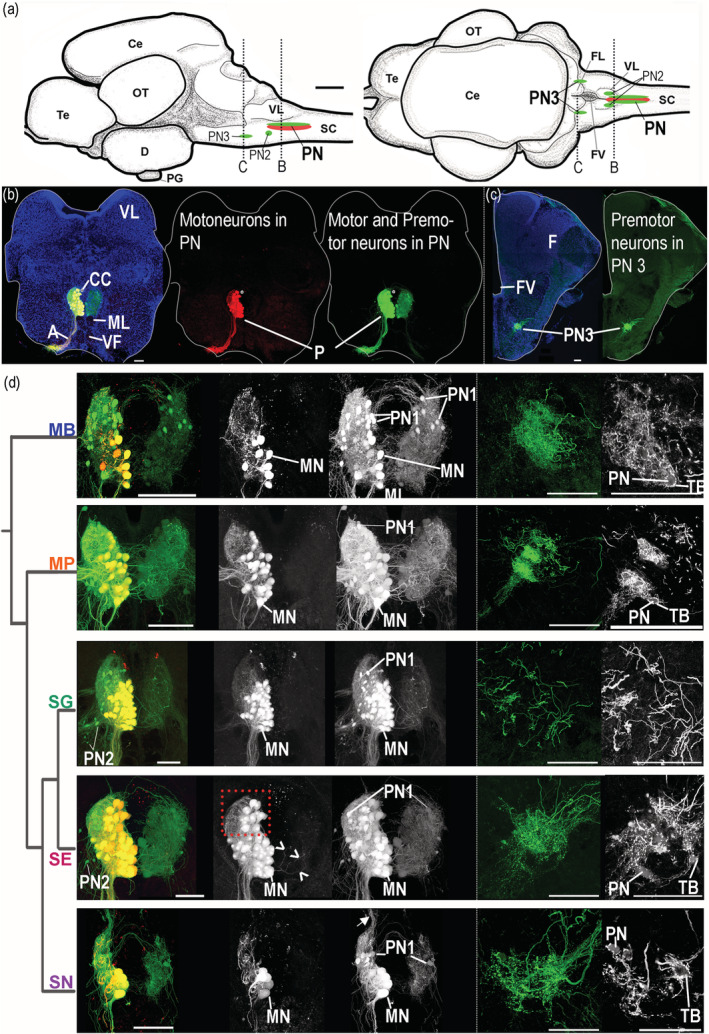
Protractor motor circuit of five mochokid catfish. Neurons labeled with dextran‐rhodamine and/or neurobiotin in Microsynodontis cf. batesii (MB), Mochokiella paynei (MP), Synodontis grandiops (SG), Synodontis eupterus (SE), and Synodontis nigriventris (SN). (a) Schematics of left sagittal and dorsal views of a S. grandiops brain showing the location of two protractor premotor populations that contain the PN2 or the PN3 and the protractor nucleus (PN) that contains motoneurons and PN1. (b) Photomicrographs of transverse hindbrain sections from S. grandiops showing the location of the PN. (c) Photomicrograph of transverse hindbrain section from S. eupterus showing the location of PN3. (d) Photomicrographs of transverse hindbrain sections showing PN and PN3 of the five mochokid species displayed according to their phylogenetic relationships, which was inferred from Day et al. (2013). A fluorescent piece of debris was removed from the Mi. cf. batesii image. Blue: 4′,6‐diamidino‐2‐phenylindole (DAPI). Green: neurobiotin (N). Red: dextran rhodamine (D‐R). a, axons of the motoneurons; CC, central canal; Ce, cerebellum; D, diencephalon; FL, facial lobe; FV, fourth ventricle; MLF, medial longitudinal fasciculus; MN, protractor motoneuron; OT, optic tectum; PG, pituitary gland; Te, telencephalon; SC, spinal cord; TB, putative terminal bouton; VF, ventral fasciculus; VL, vagal lobe. Arrowheads for SE indicate labeled dendrites crossing the midline. Arrow for SN indicates labeled processes projecting dorsally. The dashed red frame highlights the dorsal part of the protractor nucleus of S. eupterus showing that this species had more motoneurons in this region. The dashed white frames highlighted the PN3 areas shown in the far right grayscale pictures. Note that fewer images were projected to produce these grayscale pictures allowing the observation of weakly labeled PN3 somata. White scale bar represents 100 μm for each species [Color figure can be viewed at wileyonlinelibrary.com]
FIGURE 10.
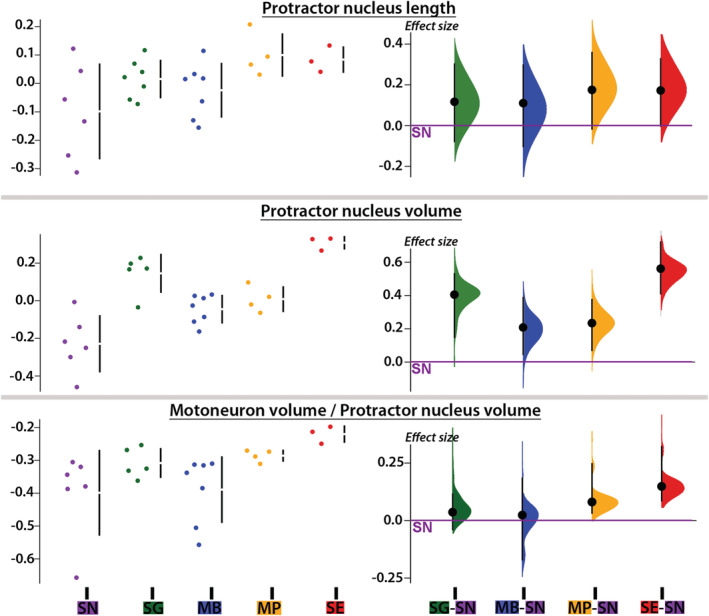
Morphometric features of the protractor nucleus (PN) of five mochokid catfish. Data (i.e., residuals of the linear regression against standard length when it was significant or log‐transformed values when the linear regression was not significant) distributions (left) and effect sizes (right) computed from pair comparisons with Synodontis nigriventris (zero on the Y axis) for PN length and volume, and the ratio between the volume occupied by motoneuron somata in the PN and the total PN volume. See Figure 4 legend for species abbreviations [Color figure can be viewed at wileyonlinelibrary.com]
FIGURE 11.
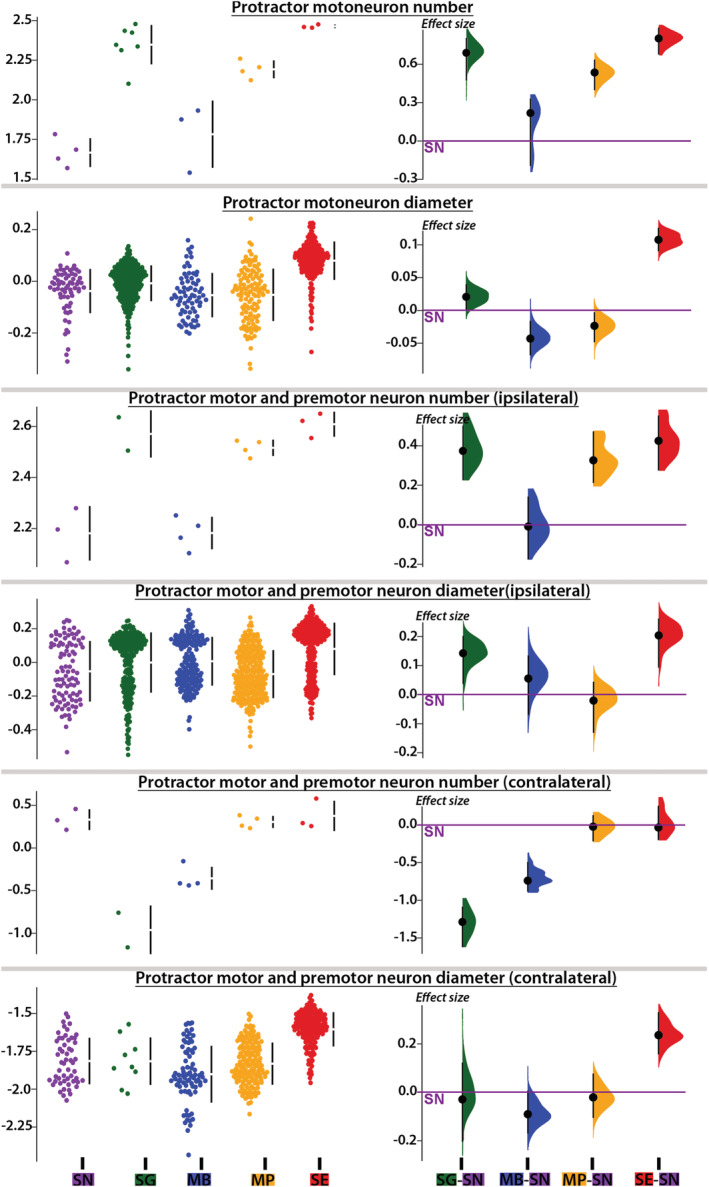
Morphometric features of motor and premotor neurons labeled in the protractor nucleus (PN) of five mochokid catfish. Data (i.e., residuals of the linear regression against standard length when it was significant or log‐transformed values when the linear regression was not significant) distributions (left) and effect sizes (right) computed from pair comparisons with Synodontis nigriventris (zero on the Y axis) for the number and diameter of protractor motoneurons labeled with dextran rhodamine, the number and diameter of motor and premotor somata labeled with neurobiotin in the ipsilateral and contralateral PN. Diameter for every measured neuron was plotted to provide an overview of size distributions. See Figure 4 legend for species abbreviations [Color figure can be viewed at wileyonlinelibrary.com]
3.3.1. Protractor nucleus
Retrograde labeling of ESS motor and premotor neurons in the PN (Figure 9b,d) of the five study species allowed us to calculate the PN's volume (Mi. cf. batesii: 0.021 ± 0.006 mm3; Mo. paynei: 0.033 ± 0.006 mm3; S. grandiops: 0.097 ± 0.013 mm3; S. eupterus: 0.067 ± 0.014 mm3; S. nigriventris: 0.030 ± 0.01 mm3) and length (Mi. cf. batesii: 1129 ± 263 μm; Mo. paynei: 1650 ± 274 μm; S. grandiops: 1640 ± 336 μm; S. eupterus: 1830 ± 144 μm; S. nigriventris: 1258 ± 500 μm). Even though the interspecific differences in the PN length were not significant, the PN volume of S. nigriventris was significantly smaller than that of S. grandiops and S. eupterus (Table S2). The effect sizes supported these results and further suggested that S. eupterus had the largest PN volume (Figure 10).
3.3.2. Protractor motoneurons
Because of its molecular weight, dextran‐rhodamine does not cross synapses and only labeled protractor motoneurons (Figure 9b; also see Bass et al., 1994). In each study species, a vast majority of the motoneurons were located in the PN (Figure 9d), although some were slightly more ventral next to the ventral and medial longitudinal fasciculi (Figures 9b and 12a). Although the diameter of motoneuron somata varied (8–40 μm) within and across the five study species (Figure 13), most ranged from 15 to 30 μm (Mi. cf. batesii: 16 ± 4 μm; Mo. paynei: 19 ± 5 μm; S. grandiops: 28 ± 5; S. eupterus: 26 ± 4 μm; S. nigriventris: 22 ± 4 μm). The motoneuron mean diameter per specimen did not differ among the five species (Table S2). However, the effect size estimated for each motoneuron somata (instead of average per specimen) suggested that soma diameters in the ipsilateral PN were larger in S. eupterus (Figure 11). S. eupterus also had the highest motoneuron count (S. eupterus: 291 ± 70; Mi. cf. batesii: 65. ± 27; Mo. paynei: 157 ± 20; S. grandiops: 230 ± 57; S. nigriventris: 47 ± 10) and the highest proportion of the PN volume occupied by motoneurons (S. eupterus: 60.3 ± 3.6%; Mi. cf. batesii: 41.7 ± 8.8%; Mo. paynei: 51.8 ± 2.2%; S. grandiops: 49.4 ± 9.7%; S. eupterus: 41.2 ± 10%), while S. nigriventris had the lowest. Protractor motoneurons were generally confined to the ventral half of the PN in S. nigriventris, while they were common (Mi. cf. batesii, Mo. paynei, and S. grandiops) or numerous (S. eupterus) in the mediodorsal region of the PN in other species (Figure 9d). The estimated effect sizes supported our observations (Figures 10 and 11) and significance tests found differences between S. eupterus versus S. nigriventris and Mi. cf. batesii for both variables as well as a higher motoneuron count in S. grandiops than S. nigriventris (Table S2).
FIGURE 12.
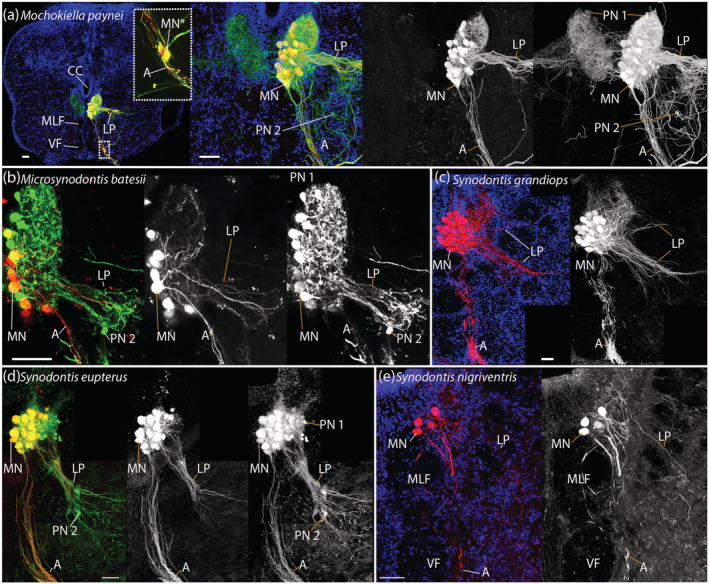
Lateral projections of the protractor motor and premotor neurons in five mochokids. Protractor motoneurons show lateral fiber projections in Mochokiella paynei (a), Microsynodontis cf. batesii (b), Synodontis grandiops (c), Synodontis eupterus (d), and Synodontis nigriventris (e). Those projections were particularly marked in S. grandiops and Mo. paynei. Red: dextran‐rhodamine. Green: neurobiotin. a: axon of a protractor motoneuron; CC, central canal; LP, lateral projections; MLF, medial longitudinal fasciculus; MN, protractor motoneuron located in the protractor nucleus; MN*, protractor motoneuron located outside the nucleus showing a dendrite connecting with the lateral projection; PN 1, Type 1 premotor neuron; PN 2, Type 2 premotor neuron; VF, ventral fasciculus. Scale bar: 50 μm [Color figure can be viewed at wileyonlinelibrary.com]
FIGURE 13.
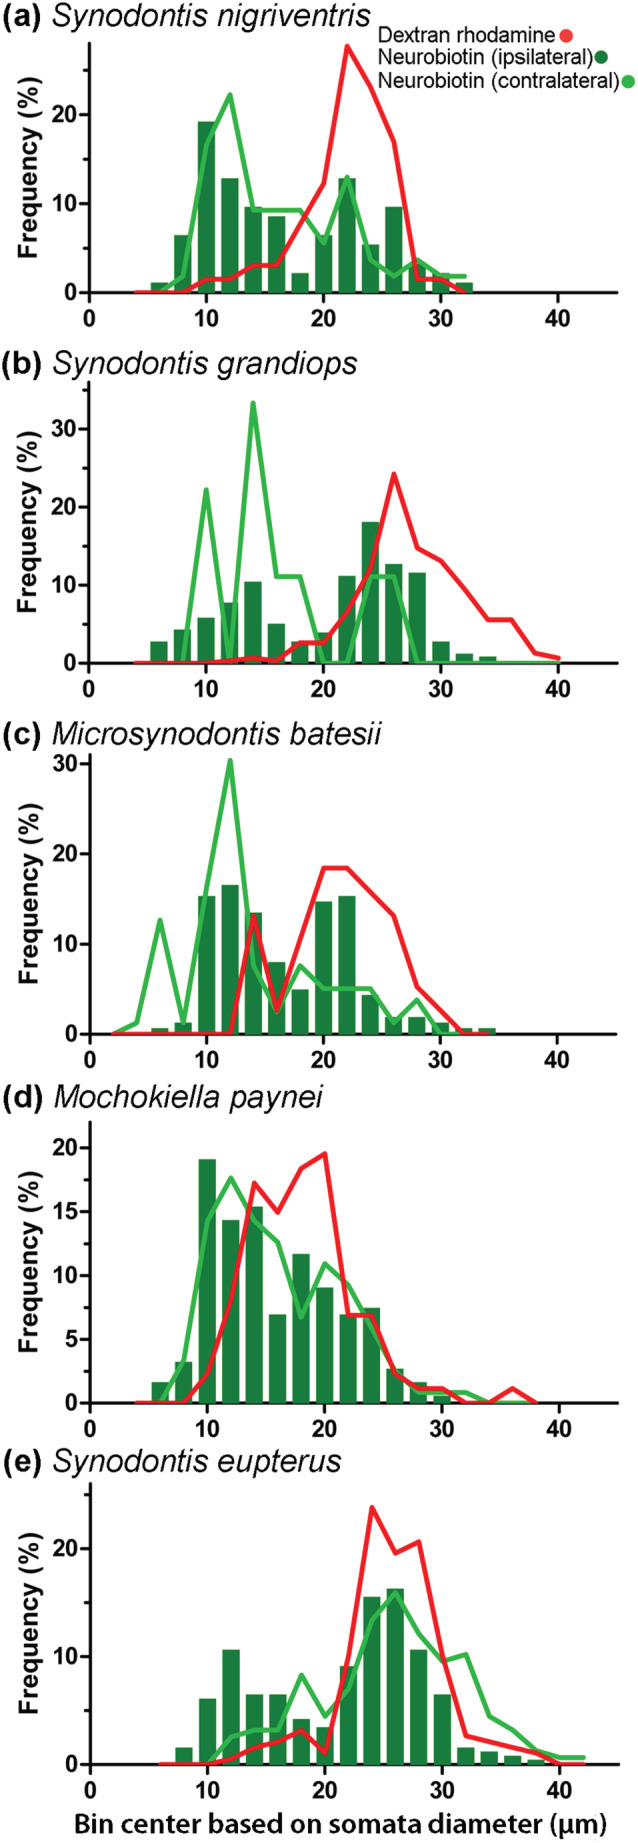
Neuron size in the protractor nucleus (PN) of five mochokid species. (a) Microsynodontis cf. batesii, (b) Mochokiella paynei, (c) Synodontis grandiops, (d) S. eupterus, and (e) S. nigriventris. Distributions of the size of somata are shown for neurobiotin‐labeled neurons in the ipsilateral PN, PN (dark green), neurobiotin‐labeled neurons in the contralateral PN (light green), dextran rhodamine‐labeled neurons (red). Data presented in this graph were not normalized using standard length [Color figure can be viewed at wileyonlinelibrary.com]
In every study species, bundles of axons exited the PN ventrally and then the brain via a ventral root (Figure 9b). Many motoneuron dendrites projected dorsally (Figures 9 and 12). Only occasionally did we observe dendrites of motoneurons that crossed the midline (see arrowheads, Figure 9d).Laterally projecting dendrites were commonly observed in the rostral part of the PN (Figure 12). While these were prominent in S. grandiops and Mo. paynei, they were less prominent in S. eupterus and Mi. cf. batesii, and only scarce in S. nigriventris.
3.3.3. Premotor neurons
In contrast to the dextran rhodamine experiments, retrograde labeling using the lower molecular weight neurobiotin that crosses synapses (see Bass et al., 1994) led to bilateral labeling of both motor and premotor neurons in the five study species (Figure 9b–d). Neurobiotin label revealed a group of cells in the dorsal part of the PN, premotor neuron Group 1 or PN1 (after Ladich & Bass, 1996), with soma diameters ranging from 8 to 16 μm (Figure 13). In all five species, PN1 showed numerous processes projecting to the contralateral PN, some crossing above the central canal (Figure 9d). In S. nigriventris, a bundle of dorsally projecting fibers that did not cross the midline was observed (arrow, Figure 9d). Like some of the protractor motoneuron dendrites, premotor neuron processes projected laterally (Figure 12).
For the ipsilateral PN, mean neuron diameters (motoneurons and PN1) per specimen were larger in S. eupterus than M. paynei (Table S2). The effect size estimated from individual somata suggested that neuron diameters in the ipsilateral PN were also smaller in S. nigriventris (Figure 11). The balance between small and large neurons was clearly biased toward PN1 in S. nigriventris and Mo. paynei and toward motoneurons in S. grandiops and S. eupterus (Figures 11 and 13). For the ipsilateral neuron count, significance tests barely found differences between S. eupterus and Mi. cf. batesii (Table S2). This might be a consequence of the small sample size because, considering the effect sizes calculated for this variable, it seemed that S. nigriventris and Mi. cf. batesii had few neurons compared to the other species, with S. grandiops and S. eupterus having the most (Figure 11).
Many neurons were also labeled in the contralateral PN. However, despite many contralateral fiber projections, S. grandiops appeared to be an exception because of the small number of labeled cells seen on the contralateral side (Figure 9d). Despite the absence of significant differences (Table S2), the effect sizes (Figure 11) suggested that contralateral labeling of the PN is less common in S. grandiops and Mi. cf. batesii than in the three other species. They also suggested that neurons labeled in the contralateral PN are larger in S. eupterus compared to any other species (Figure 11). The PCA analysis suggested a higher mean diameter for somata labeled in the contralateral PN of S. eupterus (Figure 6d). This could be explained by a higher proportion of these neurons being motoneurons as shown by the distribution of individual soma diameters in Figure 11 and the different soma diameter profiles in Figure 13.
As previously described in synodontids (Ladich & Bass, 1996), two additional groups of premotor neurons were identified. Both were located more rostroventrally in the hindbrain (Figure 9a). Premotoneuron population 2 (PN2) was most prominent in S. grandiops (Figure 14). Premotoneuron population 3 (PN3) was located rostral to PN2 at the level of the hindbrain ventricle. Bilaterally, PN3 somata were entangled in a dense web of brightly labeled fibers and putative terminal boutons, including ones directly apposed to the perimeter of PN3 somata (TB, Figure 9c,d). Somata in PN3 were generally very weakly labeled, suggestive of anterograde transneuronal labeling as observed for octavolateralis efferent neurons in S. nigriventris (Ladich & Bass, 1996) and other sound‐producing teleosts (Bass et al., 1994). Those fibers likely predominantly originated from axons from the more caudally located premotor neurons (PN1 or PN2), since they were brighter than PN3 somata and no fibers from the protractor motoneurons reach that area (as shown in the dextran rhodamine experiments).
FIGURE 14.

Premotor neuron population 2 (PN2) in five mochokid species. A second premotor population of neurobiotin‐labeled neurons (green), PN2, was located ventrolateral to the anterior part of the protractor nucleus in the five mochokid study species. PN2 was most extensive in S. grandiops. The positions of protractor motoneuron (MN) and smaller PN1 somata are also apparent in all species except for S. nigriventris (but see Figure 7d). A, axons. CC, central canal. Scale bar represents 50 μm [Color figure can be viewed at wileyonlinelibrary.com]
3.3.4. Rostral hindbrain projections
In some Mi. cf. batesii, Mo. paynei, S. eupterus, and S. nigriventris, labeled processes extended from the PN3 population (Figure 15a) to the rostral hindbrain (Figure 15b–e). More specifically, these appeared to terminate in the medial auditory nucleus (Figure 15b), the electroreceptive lateral line lobe or ELLL (Figure 15c,e), and the eminentia granularis (Figure 15d) (see Finger & Tong, 1984; Ladich & Bass, 1996 for nuclei identification). Fibers projected to ELLL and eminentia granularis in Mi. cf. batesii, Mo. paynei, and S. eupterus (Figure 15c–e); this may also be the case in S. nigriventris because of labeled fibers projecting toward the ELLL (asterisk in Figure 15b). Surprisingly, S. nigriventris was the only species that showed projections to a granule cell population associated with the medial auditory nucleus (Figure 15b) (see Finger & Tong, 1984). Because rostral hindbrain labeling was either weak or absent depending on the specimen, we do not comment on possible interspecific differences.
FIGURE 15.
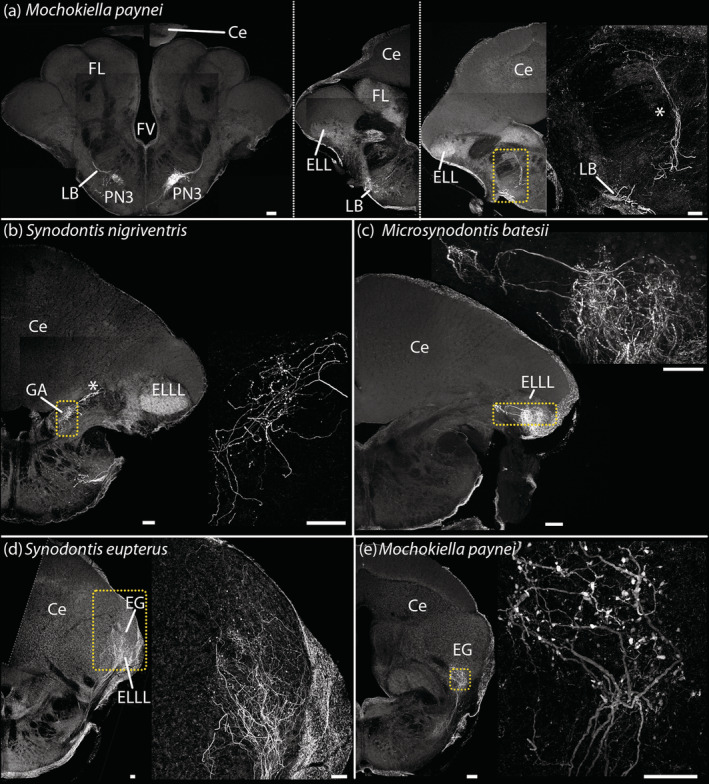
Fiber projections to the rostral hindbrain and cerebellum. (a) Fiber projecting dorsorostrally (left to right) from the nucleus of premotor‐neurons 3 in a Mochokiella paynei. (b) Fibers projecting to the granule cell populations of medial auditory nucleus, some continuing further dorsally in Synodontis nigriventris. Fibers projecting to the electroreceptive lateral line lobe and/or the eminentia granularis in Microsynodontis cf. batesii (c), Synodontis eupterus (d), and a M. paynei (e). Asterisks highlight bundle of projecting neural fibers. Ce, cerebellum, EG, eminentia granularis, ELLL, electroreceptive lateral line lobe; FV, fourth ventricle; GA, granule cell population of medial auditory nucleus; LB, lateral brainstem bundle; PN3, nucleus with premotor neurons 3. Scale bar: 50 μm [Color figure can be viewed at wileyonlinelibrary.com]
4. DISCUSSION
Mochokid catfish present a distinct opportunity to identify transitional states in the evolution of a new communication channel and underlying mechanisms within a single family and genus of vertebrates. Our earlier study of the ESS identified several prominent characters distinguishing a sonic‐only from a weakly electric‐only species within a single genus of mochokid catfish, Synodontis (Kéver et al., 2020; also see Boyle et al., 2014; Hagedorn et al., 1990; Ladich & Bass, 1996). The current report compares the ESS morphology of these two synodontids to a third synodontid that is both sonic and weakly electric and to sonic‐only species in two other mochokid genera. Together, the results indicate that both peripheral (ESA) and central components of the ESS are largely conserved across all five study species. As discussed, species differences may support the hypothesis that the electrogenic ESS of mochokids evolved from an ancestral sonic ESS.
4.1. ESA morphology
Microsynodontis cf. batesii and Mo. paynei only produced sound. The ESA of these two species shared several features with the ESA of the sonic‐only S. grandiops: a MR with a large plate and a short stem, a large PM that inserts on the MR, and PM fibers mostly oriented dorsoventrally with a high proportion of myofibrils compared to the surrounding sarcoplasm. Since three species, together with S. eupterus that also produces sounds (and electric discharges) had a MR with a medium to large plate and a short stem, as well as a thick PM (Table 1), we suggest that these are shared ESA characters for mochokids that generate sounds dependent on the ESA and swim bladder.
TABLE 1.
Prominent characters of ESS of mochokid catfish associated with the production of sound, weakly electric discharges, or both
| Swim bladder sounds | Electric discharges | Both | |
|---|---|---|---|
| Plate surface | Large | Small | Medium |
| Stem length | Short | Long | Short |
| PM orientation | Mostly vertical | Mostly horizontal | Mostly horizontal |
| PM length | Short | Long | Long |
| PM thickness | Thick | Thin | Thick |
| % myofibrils in PM fibers | High | Low | Intermediate to low |
| PN volume | Medium | Small | Large |
| MN count in PN | Medium to large | Small | Large |
| MN count in PNc | Small | Small | Large |
Note: Shared characters are underlined.
Abbreviations: ESS, elastic spring system; M, motoneurons; PM, protractor muscle; PN, protractor nucleus; PNc, contralateral PN.
Although the ESA of the species producing only sounds shared several traits, they also showed differences. For example, the origin of the PM in Mi. cf. batesii and Mo. paynei was under the nuchal shield and not under the dorsal fin as reported for other synodontids investigated so far (Fine & Ladich, 2003; Hagedorn et al., 1990; Kéver et al., 2020; Ladich & Bass, 1996). In addition, the PM of Mi. cf. batesii did not insert on a process of the stem of the MR, but directly on the plate that was much thicker than in all other species.
How might the three synodontid species studied so far that include two capable of producing electric discharges further inform us about ESA adaptations related to electrogenesis? The PM of S. eupterus that is both weakly electric and sonic had a shape that was intermediate (i.e., mostly horizontal, but thick) between that of S. nigriventris, which is only weakly electric, and S. grandiops, which is only sonic, while its MR had a rather large plate and a short stem resembling that of S. grandiops and other sound‐producing mochokids (see above, Figure 5; Table 1). Despite the shape, insertions, and myofibril content of the PM in S. eupterus seemed far from optimal when it comes to generate movements, this species most likely retained the ability to generate swim bladder sounds due to the large volume and surface of its PM and ESA plate, respectively. According to Boyle et al. (2014), sounds produced by S. eupterus were, however, weaker than those produced by S. grandiops which tend to support our suggestion that the ESA of the latter species is better suited for sound production. Since both S. eupterus and S. nigriventris are weakly electric and have a longer PM with a large portion of fibers oriented along the rostrocaudal rather than the dorsoventral axis in association with a long stem of the MR (Table 1), we propose that these ESA characters are associated with electric signaling in synodontids. Weakly electric gymnotiforms and mormyroids have electric organs composed of columns of serially arranged electrocytes oriented perpendicular to the head–tail body axis that generate electric fields with positive and negative polarities (Bass, 1986a; Caputi, Carlson, & Macadar, 2005). The more rostrocaudal orientation of PM fibers in S. eupterus and S. nigriventris may turn out to be an adaptation for generating electrical fields with positive and negative polarities oriented along the head–tail body axis (Bass, 1986b, Bass, 1986a; see Bennett, 1971). Future studies should consider investigating the anatomy (e.g., membrane surface area) and physiology (e.g., electrical excitability) of the muscle fibers as well as the innervation pattern in the PM to support or refute this hypothesis (Bass, 1986b; see Bennett, 1971; Swapna et al., 2018).
4.2. ESS circuitry
All study species exhibited an ESS circuit with three topographically separate populations in the same locations: a caudal hindbrain PN that includes motoneurons and one premotor population (PN1), and two premotor nuclei external to PN (PN2, PN3). S. eupterus had the largest PN volume, the largest pool of PN motoneurons, and the most extensive contralateral labeling of PN motoneurons (Table 1). Many motoneurons in this species were in the dorsal part of the PN, which was not the case in the other species, especially the electrogenic S. nigriventris (Figure 9d). This suggested that part of the ancestral sonic motoneuron pool may have been lost in weakly electric‐only synodontid species. The larger pool of motoneurons in S. eupterus may be related to the ESA's dual function, reflecting separate pools of sonic and electrogenic motoneurons with different electroresponsive properties and/or network connections. The dual ability of some synodontids to generate both electric discharges and sounds dependent on two functional groups of PN motoneurons remains to be tested. While this is highly speculative, redundancy in some constituents of a network can allow some elements adopting new functions while preserving the original behavioral phenotype (Hoke, Adkins‐Regan, Bass, McCune, & Wolfner, 2019). For example, sodium channel duplication has most probably been pivotal in the convergent evolutionary pathways that led to the myogenic electric organs of adult gymnotiforms and mormyroids (Arnegard, Zwickl, Lu, & Zakon, 2010; Zakon, Lu, Zwickl, & Hillis, 2006).
Among the five study species, the four sonic species shared medium to large PN volumes and motoneuron pools, while the weakly electric‐only S. nigriventris had the smallest PN volumes and motoneuron pools. Strongly electric catfish (Malapterurus spp.) only have a single bilateral pair of electromotoneurons that innervate all electrocytes (Bennett, Nakajima, & Pappas, 1967). In many electric fish, highly synchronized activation of premotor and motoneurons is achieved via electrical coupling (Bennett, 1971; Bennett, Pappas, Aljure, & Nakajima, 1967; Bennett, Pappas, Giménez, & Nakajima, 1967; Carlson, 2006; Elekes & Szabo, 1985). Reducing the number of neurons, while increasing the extent of electric coupling could thus be a general adaptation in the evolution of electric signaling. Future studies should thus focus on investigating differences at the level of individual neurons such as the strength of electrical coupling.
4.3. Concluding comments
Together, our results provide strong support for the hypothesis that the ESS of sound‐producing and/or weakly electric signaling systems of mochokid catfish is highly conserved. How the morphological differences reported here and in prior reports (see Introduction) contribute to different sonic and/or weakly electric behaviors among mochokids largely awaits further physiological studies of both the ESA and the premotor‐motor circuit (e.g., see Kéver et al., 2020).
In this report, we identified several morphological characters of the mochokid ESS that are likely associated with the production of swim bladder sounds, electric discharges, or both. For example, S. eupterus that is both sound‐producing and weakly electric had the largest PN volume and pool of motoneurons, while all sound‐producing species (including S. eupterus that is both sonic and weakly electric) had an MR with a short stem but a large plate, a thick PM, and a medium to large PN volume. However, the three sound producing‐only species also showed some differences in other ESS characters including thickness of the MR plate, PM insertion points, and the extent of contralateral labeling of PN neurons.
Exaptation has been proposed as a mechanism explaining the evolution of novel characters (Cieri, Hatch, Capano, & Brainerd, 2020; Emberts et al., 2020; Hoffman, Taylor, & Harris, 2016; Schaefer & Lauder, 1986), including the sound‐producing organs of fishes (Parmentier, Diogo, & Fine, 2017). The ESS premotor‐motor circuit, like molluscan central pattern generators (Katz, 2016a), offers the opportunity to identify transformations in neuronal properties linked to divergent behavioral phenotypes (also see Anderson, 2010; Stephenson‐Jones, Samuelsson, Ericsson, Robertson, & Grillner, 2011). Studies of other sonic (vocal) and electrogenic teleosts show that discrete populations of motor and premotor neurons directly determine the physical attributes of sounds or electric discharges (e.g., Bass & Zakon, 2005). The evidence so far indicates that the ESS neural circuitry will exhibit these same functional characters (Hagedorn et al., 1990; Kéver et al., 2020; this report; F. Ladich & Bass, 1996). The ability to recognize neuronal homologues between closely related species holds great promise to identify the developmental, cellular, and molecular mechanisms leading to the origins of a novel behavior, in this case electrogenesis, from an ancestral phenotype, in this case a sound‐producing motor system.
Behavioral signaling systems producing electric discharges depend upon highly derived muscles and motoneuron populations located within the brain or spinal cord (e.g. Bass, 1986a, 1989; Bennett, 1971). In most cases, it remains challenging to resolve the evolutionary origins of these signaling systems because extant species that represent transitional steps between ancestral and derived states within a single genus are typically not available for investigation. Mochokids provide an opportunity to trace origins on both developmental and evolutionary timescales of transitional states in neural mechanisms and functions of modality‐specific behaviors, in this case from ancestral acoustic to more derived weakly electric discharges. Molluscan nervous systems have provided elegant examples of how neuronal circuitry has been “repurposed for new functions” (Katz, 2016a, 2016b). Similarly, anatomical studies of the mushroom body, which processes olfaction in most insects, support a shift to visual integration in the aquatic whirligig beetle (Lin & Strausfeld, 2012). Mochokids may now provide a model investigating how exaptations during successive transitional states can lead to the repurposing of neuronal mechanisms underlying sound production in fishes, e.g., synchronous activation of motoneurons and muscle fibers, to ones engaged in electromotor function (also see Bass, 1989; Bass & Baker, 1997; Bass & Zakon, 2005; Parmentier et al., 2017).
PEER REVIEW
The peer review history for this article is available at https://publons.com/publon/10.1002/cne.25057.
Supporting information
TABLE S1 Comparison of eight morphometric measures for the Elastic Spring Apparatus of five mochokid catfish species. All data were log‐transformed and linear regressions over the logarithm of the standard length were used to determine if they should be corrected for size. When the model of linear regression was significant, residuals of the regression were used for the interspecific comparisons. Sequential Bonferroni corrections were used for the alpha levels of the Kruskal‐Wallis tests. Significant differences of post‐hoc tests (p < .05) are in bold. Abbreviations: MB, Microsynodontis cf. batesii; MP, Mochokiella paynei; SG, Synodontis grandiops; SE, S. eupterus; SN, S. nigriventris.
TABLE S2 Comparison of the nine morphometric features measured for the protractor nucleus (PN) of five mochokid species. All data were log‐transformed and linear regressions over the logarithm of the standard length were used to determine if they should be corrected for size. When the model of linear regression was significant, residuals of the regression were used for the interspecific comparisons. Sequential Bonferroni corrections were used for the alpha levels of the Kruskal‐Wallis tests. Abbreviations: MB, Microsynodontis cf. batesii; MN, motoneurons; M: Mochokiella paynei; Neuro, neurobiotin; SG, Synodontis grandiops; SE, S. eupterus; SN, S. nigriventris.
TABLE S3 Principal Component Analysis for morphometric measures of the Elastic spring Apparatus of five mochokid catfish species. Based on the Kaiser‐Guttman rule, the first three principal components were kept.
TABLE S4 Principal Component Analysis of nine variables measured for protractor nucleus. Based on the Kaiser‐Guttman rule the first three principal components were kept.
ACKNOWLEDGMENTS
The authors would like to thank J. P. Friel (Alabama Museum of Natural History) for the μCT‐scan of a M. paynei, C. B. Dillman (Cornell University Museum of Vertebrates) for specimens of M. paynei and Synodontis eupterus that were X‐rayed at Friday Harbor Laboratories, University of Washington by M. Kolmann and A. Summers. The authors are also grateful to K.S. Boyle for sound recording of S. eupterus and advice on electric discharge recordings, and M. Marchaterre, O. Alexandrova, and H. Wohlfrom for technical assistance. L. K. is a F.R.S.‐FNRS Research Associate. Photograph of M. paynei in Figure 1 was modified with permission of www.amazon-exotic-import.de; all others courtesy of Wolfgang Gessl (University of Graz). Research support from F.R.S.‐FNRS to L. K., DFG (CRC870) and the University of Graz to B. P. C., and the US National Science Foundation to A. H. B. (IOS 1457108).
Kéver L, Parmentier E, Bass AH, Chagnaud BP. Morphological diversity of acoustic and electric communication systems of mochokid catfish. J Comp Neurol. 2021;529:1787–1809. 10.1002/cne.25057
Funding information Deutsche Forschungsgemeinschaft, Grant/Award Number: CRC870; Fonds De La Recherche Scientifique ‐ FNRS; National Science Foundation, Grant/Award Number: IOS 1457108
DATA AVAILABILITY STATEMENT
The data that support the findings of this study are available from the corresponding author upon request.
REFERENCES
- Abercrombie, M. (1946). Estimation of nuclear population from microtome sections. Anatomical Record, 94(2), 239–247. 10.1002/ar.1090940210 [DOI] [PubMed] [Google Scholar]
- Akamatsu, T. , Okumura, T. , Novarini, N. , & Yan, H. Y. (2002). Empirical refinements applicable to the recording of fish sounds in small tanks. Journal of the Acoustical Society of America, 112(6), 3073–3082. 10.1121/1.1515799 [DOI] [PubMed] [Google Scholar]
- Anderson, M. L. (2010). Neural reuse: A fundamental organizational principle of the brain. Behavioral and Brain Science, 33(4), 245–266. 10.1017/S0140525X10000853 [DOI] [PubMed] [Google Scholar]
- Arnegard, M. E. , Zwickl, D. J. , Lu, Y. , & Zakon, H. H. (2010). Old gene duplication facilitates origin and diversification of an innovative communication system ‐ twice. Proceedings of the National Academy of Sciences of the United States of America, 107(51), 22172–22177. 10.1073/pnas.1011803107 [DOI] [PMC free article] [PubMed] [Google Scholar]
- Bass, A. H. (1986a). Electric organs revisited: Evolution of a vertebrate communication and orientation organ. In Bullock T. H. & Heiligenberg W. (Eds.), Electroreception (pp. 13–70). New York: Wiley and Sons. 10.1016/j.cub.2015.09.062 [DOI] [Google Scholar]
- Bass, A. H. (1986b). Species differences in electric organs of mormyrids: Substrates for species‐typical electric organ discharge waveforms. The Journal of Comparative Neurology, 330, 313–330. 10.1002/cne.902440305 [DOI] [PubMed] [Google Scholar]
- Bass, A. H. (1989). The evolution of vertebrate motor systems for acoustic and electric communication: Peripheral and central elements. Brain, Behavior and Evolution, 33, 237–247. 10.1159/000115931 [DOI] [PubMed] [Google Scholar]
- Bass, A. H. , & Baker, R. (1997). Phenotypic specification of hindbrain rhombomeres and the origins of rhythmic circuits in vertebrates. Brain Behavior and Evolution, 50(Suppl 1), 3–16. 10.1159/000113351 [DOI] [PMC free article] [PubMed] [Google Scholar]
- Bass, A. H. , Marchaterre, M. A. , & Baker, R. (1994). Vocal‐acoustic pathways in a teleost fish. Journal of Neuroscience, 14(7), 4025–4039. 10.1016/J.TICS.2017.10.001 [DOI] [PMC free article] [PubMed] [Google Scholar]
- Bass, A. H. , & Zakon, H. H. (2005). Sonic and electric fish: At the crossroads of neuroethology and behavioral neuroendocrinology. Hormones and Behavior, 48(4), 360–372. 10.1016/j.yhbeh.2005.05.022 [DOI] [PubMed] [Google Scholar]
- Bennett, M. V. (1971). Electric organs. In Hoar W. & Randall D. (Eds.), Fish physiology (Vol. 5, pp. 347–491). London, England: Academic Press. [Google Scholar]
- Bennett, M. V. , Nakajima, Y. , & Pappas, G. D. (1967). Physiology and ultrastructure of electrotonic junctions. 3. Giant electromotor neurons of Malapterurus electricus . Journal of Neurophysiology, 30, 209–235. 10.1152/jn.1967.30.2.161 [DOI] [PubMed] [Google Scholar]
- Bennett, M. V. , Pappas, G. D. , Aljure, E. , & Nakajima, Y. (1967). Physiology and ultrastructure of electrotonic junctions. II. Spinal and medullary electromotor nuclei in mormyrid fish. Journal of Neurophysiology, 30(2), 180–208. 10.1152/jn.1967.30.2.180 [DOI] [PubMed] [Google Scholar]
- Bennett, M. V. , Pappas, G. D. , Giménez, M. , & Nakajima, Y. (1967). Physiology and ultrastructure of electrotonic junctions. IV. Medullary electromotor nuclei in gymnotid fish. Journal of Neurophysiology, 30, 236–300. 10.1152/jn.1967.30.2.236 [DOI] [PubMed] [Google Scholar]
- Boyle, K. S. , Colleye, O. , & Parmentier, E. (2014). Sound production to electric discharge: Sonic muscle evolution in progress in Synodontis spp. catfishes (Mochokidae). Proceedings of the Royal Society Biological Sciences Series B, 281, 1–9. 10.1098/rspb.2014.1197 [DOI] [PMC free article] [PubMed] [Google Scholar]
- Caputi, A. A. , Carlson, B. A. , & Macadar, O. (2005). Electric organs and their control. In Bullock T. H., Hopkins C. D., Popper A. N., & Fay R. R. (Eds.), Electroreception (pp. 410–445). New York, NY: Springer. [Google Scholar]
- Carlson, B. A. (2006). A neuroethology of electrocommunication. In Friedrich Ladich S. P., Colin P. M., & Kapoor B. G. (Eds.), Communication in fishes (pp. 805–848). Enfield, NH: Science Publishers. [Google Scholar]
- Cieri, R. L. , Hatch, S. T. , Capano, J. G. , & Brainerd, E. L. (2020). Locomotor rib kinematics in two species of lizards and a new hypothesis for the evolution of aspiration breathing in amniotes. Scientific Reports, 10(1), 1–10. 10.1038/s41598-020-64140-y [DOI] [PMC free article] [PubMed] [Google Scholar]
- Connaughton, M. A. , Taylor, M. H. , & Fine, M. L. (2000). Effects of fish size and temperature on weakfish disturbance calls: Implications for the mechanism of sound generation. Journal of Experimental Biology, 203(Pt 9), 1503–1512. [DOI] [PubMed] [Google Scholar]
- Day, J. J. , Peart, C. R. , Brown, K. J. , Friel, J. P. , Bills, R. , & Moritz, T. (2013). Continental diversification of an African catfish radiation (Mochokidae: Synodontis). Systematic Biology, 62(3), 351–365. 10.1093/sysbio/syt001 [DOI] [PubMed] [Google Scholar]
- Elekes, K. , & Szabo, T. (1985). Synaptology of the medullary command (pacemaker) nucleus of the weakly electric fish (Apteronotus leptorhynchus) with particular reference to comparative aspects. Experimental Brain Research, 60, 509–520. 10.1016/0306-4522(81)90137-8 [DOI] [PubMed] [Google Scholar]
- Emberts, Z. , St. Mary, C. M. , Howard, C. C. , Forthman, M. , Bateman, P. W. , Somjee, U. , … Miller, C. W. (2020). The evolution of autotomy in leaf‐footed bugs. Evolution, 74(5), 897–910. 10.1111/evo.13948 [DOI] [PMC free article] [PubMed] [Google Scholar]
- Fine, M. L. , & Ladich, F. (2003). Sound production, spine locking, and related adaptations. In Arratia G., Kapoor B. G., Chardon M., & Diogo R. (Eds.), Catfishes (Vol. 1). Enfield, NH: Sciences Publishers, Inc.. [Google Scholar]
- Finger, T. E. , & Tong, S. (1984). Central organization of eighth nerve and mechanosensory lateral line systems in the brainstem of ictalurid catfish. Journal of Comparative Neurology, 151, 129–151. 10.1002/cne.902290110 [DOI] [PubMed] [Google Scholar]
- Hagedorn, M. , Womble, M. , & Finger, T. E. (1990). Synodontid catfish: A new group of weakly electric fish. Brain Behavior and Evolution, 35, 268–277. 10.1159/000115873 [DOI] [PubMed] [Google Scholar]
- Ho, J. , Tumkaya, T. , Aryal, S. , Choi, H. , & Claridge‐Chang, A. (2019). Moving beyond P values: Everyday data analysis with estimation plots. Nature Methods, 16, 565–566. 10.1038/s41592-019-0470-3 [DOI] [PubMed] [Google Scholar]
- Hoffman, M. , Taylor, B. E. , & Harris, M. B. (2016). Evolution of lung breathing from a lungless primitive vertebrate. Respiratory Physiology and Neurobiology, 224, 11–16. 10.1016/j.resp.2015.09.016 [DOI] [PMC free article] [PubMed] [Google Scholar]
- Hoke, K. L. , Adkins‐Regan, E. , Bass, A. H. , McCune, A. R. , & Wolfner, M. F. (2019). Co‐opting evo‐devo concepts for new insights into mechanisms of behavioural diversity. The Journal of Experimental Biology, 222(8), jeb190058. 10.1242/jeb.190058 [DOI] [PMC free article] [PubMed] [Google Scholar]
- Katz, P. S. (2016a). Evolution of central pattern generators and rhythmic behaviours. Philosophical Transactions of the Royal Society of London, 371, 20150057. 10.1098/rstb.2015.0057 [DOI] [PMC free article] [PubMed] [Google Scholar]
- Katz, P. S. (2016b). Phylogenetic plasticity in the evolution of molluscan neural circuits. Current Opinion in Neurobiology, 41, 8–16. 10.1016/j.conb.2016.07.004 [DOI] [PubMed] [Google Scholar]
- Kéver, L. , Bass, A. H. , Parmentier, E. , & Chagnaud, B. P. (2020). Neuroanatomical and neurophysiological mechanisms of acoustic and weakly electric signaling in synodontid catfish. Journal of Comparative Neurology, 528(15), 2602–2619. 10.1002/cne.24920 [DOI] [PMC free article] [PubMed] [Google Scholar]
- Kéver, L. , Boyle, K. S. , Bolen, G. , Dragičević, B. , Dulčić, J. , & Parmentier, E. (2014). Modifications in call characteristics and sonic apparatus morphology during puberty in Ophidion rochei (Actinopterygii: Ophidiidae). Journal of Morphology, 275(6), 650–660. 10.1002/jmor.20245 [DOI] [PubMed] [Google Scholar]
- Ladich, F. , & Bass, A. H. (1996). Sonic/vocal‐acousticolateralis pathways in teleost fishes: A transneuronal biocytin study in mochokid catfish. Journal of Comparative Neurology, 374(4), 493–505. [DOI] [PubMed] [Google Scholar]
- Lin, C. , & Strausfeld, N. J. (2012). Visual inputs to the mushroom body calyces of the whirligig beetle Dineutus sublineatus: Modality switching in an insect. The Journal of Comparative Neurology, 520, 2562–2574. 10.1002/cne.23092 [DOI] [PubMed] [Google Scholar]
- Parmentier, E. , & Diogo, R. (2006). Evolutionary trends of swimbladder sound mechanisms in some teleost fishes. In Ladich F., Collin S. P., Moller P., & Kapoor B. G. (Eds.), Communication in fishes (Vol. 1, pp. 45–70). Enfield, NH: Science Publisher. [Google Scholar]
- Parmentier, E. , Diogo, R. , & Fine, M. L. (2017). Multiple exaptations leading to fish sound production. Fish and fisheries, 18(5), 958–966. 10.1111/faf.12217 [DOI] [Google Scholar]
- Poll, M. (1971). Révision des Synodontis africains (famille Mochocidae). Annales Museum Royal d'Afrique Centrale, 191, 397–402. [Google Scholar]
- Reichard, M. (2019). Cuckoo catfish. Current Biology, 29(15), R722–R723. 10.1016/j.cub.2019.05.067 [DOI] [PubMed] [Google Scholar]
- Schaefer, S. A. , & Lauder, G. V. (1986). Historical transformation of functional design: Evolutionary morphology of feeding mechanisms in loricarioid catfishes. Systematic Biology, 35(4), 489–508. 10.2307/2413111 [DOI] [Google Scholar]
- Stephenson‐Jones, M. , Samuelsson, E. , Ericsson, J. , Robertson, B. , & Grillner, S. (2011). Evolutionary conservation of the basal ganglia as a common vertebrate mechanism for action selection. Current Biology, 21(13), 1081–1091. 10.1016/j.cub.2011.05.001 [DOI] [PubMed] [Google Scholar]
- Swapna, I. , Ghezzi, A. , York, J. M. , Markham, M. R. , Halling, D. B. , Lu, Y. , … Zakon, H. H. (2018). Electrostatic tuning of a potassium channel in electric fish. Current Biology, 28(13), 2094–2102.e5. 10.1016/j.cub.2018.05.012 [DOI] [PMC free article] [PubMed] [Google Scholar]
- Tellechea, J. S. , Martinez, C. , Fine, M. L. , & Norbis, W. (2010). Sound production in the whitemouth croaker and relationship between fish size and disturbance call characteristics. Environmental Biology of Fishes, 89(2), 163–172. 10.1007/s10641-010-9709-7 [DOI] [Google Scholar]
- Tellechea, J. S. , & Norbis, W. (2012). Sexual dimorphism in sound production and call characteristics in the striped weakfish Cynoscion guatucupa . Zoological Studies, 51(7), 946–955. [Google Scholar]
- Vasconcelos, R. O. , & Ladich, F. (2008). Development of vocalization, auditory sentivity and acoustic communication in the lusitanian toadfish Halobatrachus didactylus . Journal of Experimental Biology, 211(Pt 4), 502–509. 10.1242/jeb.008474 [DOI] [PubMed] [Google Scholar]
- Vigliotta, T. R. (2008). A phylogenetic study of the African catfish family Mochokidae (Osteichthyes, Ostariophysi, Siluriformes), with a key to genera. Proceedings of the Academy of Natural Sciences of Philadelphia, 157(1), 73–136. 10.1635/0097-3157(2008)157 [DOI] [Google Scholar]
- Zakon, H. H. , Lu, Y. , Zwickl, D. J. , & Hillis, D. M. (2006). Sodium channel genes and the evolution of diversity in communication signals of electric fishes: Convergent molecular evolution. Proceedings of the National Academy of Sciences of the United States of America, 103(10), 3675–3680. 10.1073/pnas.0600160103 [DOI] [PMC free article] [PubMed] [Google Scholar]
Associated Data
This section collects any data citations, data availability statements, or supplementary materials included in this article.
Supplementary Materials
TABLE S1 Comparison of eight morphometric measures for the Elastic Spring Apparatus of five mochokid catfish species. All data were log‐transformed and linear regressions over the logarithm of the standard length were used to determine if they should be corrected for size. When the model of linear regression was significant, residuals of the regression were used for the interspecific comparisons. Sequential Bonferroni corrections were used for the alpha levels of the Kruskal‐Wallis tests. Significant differences of post‐hoc tests (p < .05) are in bold. Abbreviations: MB, Microsynodontis cf. batesii; MP, Mochokiella paynei; SG, Synodontis grandiops; SE, S. eupterus; SN, S. nigriventris.
TABLE S2 Comparison of the nine morphometric features measured for the protractor nucleus (PN) of five mochokid species. All data were log‐transformed and linear regressions over the logarithm of the standard length were used to determine if they should be corrected for size. When the model of linear regression was significant, residuals of the regression were used for the interspecific comparisons. Sequential Bonferroni corrections were used for the alpha levels of the Kruskal‐Wallis tests. Abbreviations: MB, Microsynodontis cf. batesii; MN, motoneurons; M: Mochokiella paynei; Neuro, neurobiotin; SG, Synodontis grandiops; SE, S. eupterus; SN, S. nigriventris.
TABLE S3 Principal Component Analysis for morphometric measures of the Elastic spring Apparatus of five mochokid catfish species. Based on the Kaiser‐Guttman rule, the first three principal components were kept.
TABLE S4 Principal Component Analysis of nine variables measured for protractor nucleus. Based on the Kaiser‐Guttman rule the first three principal components were kept.
Data Availability Statement
The data that support the findings of this study are available from the corresponding author upon request.


