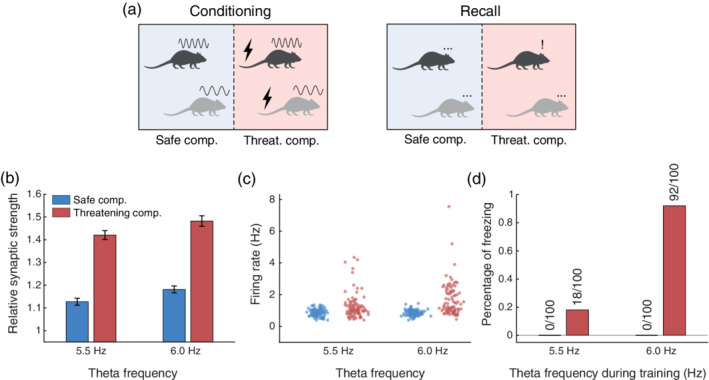
FIGURE 3.

(a) Schematic of the simulated experimental protocol. Conditioning: High and low frequency sinusoids above the rodent's head represent conditioning at either high or low theta frequency, respectively, whereas the bolt symbol indicates the presence of noxious stimuli. Recall: The symbols above the rodent's head illustrate the behavior predicted by the model, with the three dots indicating no behavioral response and the exclamation mark a freezing response to the contextual cue. (b) Relative average synaptic strength obtained after simulating contextual conditioning during epochs of theta activity at 5.5 or 6 Hz in the threatening and safe compartment; error bars represent SEM. (c) Firing rate distribution of fear cells during recall at both theta frequencies in both compartments. (d) Percentage probability of freezing over 100 simulations
