

Abstract
Purpose:
This study aimed to investigate the role of regional f0 inhomogeneity in spiral hyperpolarized 13C image quality and to develop measures to alleviate these effects
Methods:
Field map correction of hyperpolarized 13C cardiac imaging using spiral readouts was evaluated in healthy subjects. Spiral readouts with differing duration (26 and 45 ms) but similar resolution were compared with respect to off-resonance performance and image quality. An f0 map-based image correction based on the multi-frequency interpolation (MFI) method was implemented and compared to correction using a global frequency shift alone. Estimation of an unknown frequency shift was performed by maximizing a sharpness objective based on the Sobel variance. The apparent full width half at maximum (FWHM) of the myocardial wall on [13C]bicarbonate was used to estimate blur.
Results:
Mean myocardial wall FWHM measurements were unchanged with the short readout pre-correction (14.1 ± 2.9 mm) and post-MFI correction (14.1 ± 3.4 mm), but significantly decreased in the long waveform (20.6 ± 6.6 mm uncorrected, 17.7 ± 7.0 corrected, p = .007). Bicarbonate signal-to-noise ratio (SNR) of the images acquired with the long waveform were increased by 1.4 ± 0.3 compared to those acquired with the short waveform (predicted 1.32). Improvement of image quality was observed for all metabolites with f0 correction.
Conclusion:
f0-map correction reduced blur and recovered signal from dropouts, particularly along the posterior myocardial wall. The low image SNR of [13C]bicarbonate can be compensated with longer duration readouts but at the expense of increased f0 artifacts. which can be partially corrected for with the proposed methods.
Keywords: spiral, artifacts, hyperpolarized, cardiac, f0, B0, main field inhomogeneity, bicarbonate, myocardium, multi frequency interpolation
Introduction
Ischemic heart disease, hypertrophy, heart failure, and multiple genetic defects all cause abnormal mitochondrial function in the human myocardium. Imaging with hyperpolarized (HP) agents is a technique in clinical translation [1, 2] that offers biochemical specificity, in contrast to radiotracer-based methods. Earlier studies demonstrated that production of HP [13C]bicarbonate after injection of HP [1-13C1]pyruvate provides a direct index of pyruvate oxidation by the citric acid cycle in cardiac mitochondria [2, 3, 4]. Nonuniform HP[13C]bicarbonate was observed on short axis images of the left ventricular myocardium [5], and we made similar observations in our initial human studies. For clinical translation, it is important to understand the mechanism of heterogeneous or absent HP[13C]bicarbonate signal in the myocardium. A defect in the bicarbonate image may arise from clinically important factors such as coronary artery disease, or from technical issues such as transmit/receive B1 imperfections [6] or B0 inhomogeneity. Since flux in the citric acid cycle is homogeneous in the healthy human heart based on [11C]acetate studies [7], we anticipate that HP[13C]bicarbonate signal should be homogeneous as well, and any signal dropouts suggest artifact. Translation of hyperpolarized technology to clinical cardiology will require characterization of these artifacts, which has received little attention to date.
It is well-known that significant center frequency (f0) shifts may occur from B0 distortions at susceptibility interfaces such as that between the lung and myocardium [8, 9, 10], typically manifesting as signal dropouts in 1H steady state free procession (SSFP) acquisitions. In hyperpolarized 13C imaging the low gyromagnetic ratio (γ) of 13C is advantageous because the f0 response to B0 fluctuations is reduced compared to 1H. However, since hyperpolarized 13C images are typically limited by their intrinsic signal-to-noise ratio (SNR) instead of the system hardware, the readout gradient waveforms are typically not played out with maximal speed in order to increase data acquisition periods for SNR [11]. The majority of cardiac imaging studies using hyperpolarized [1-13C]pyruvate have utilized a gradient echo sequence consisting of a single-frequency spectral spatial excitation and spiral readout [12, 2, 13, 14, 15, 16, 5]. The spiral readout is highly efficient in acquiring a large portion of k space in a single repetition time (T R), but it is particularly susceptible to artifacts arising from f0 shifts. This effect worsens as the readout duration is extended.
Designing spiral readouts requires accounting for numerous parameters such as gradient system constraints, image resolution, field-of-view (FOV), f0 inhomogeneity, , and peripheral nerve stimulation. Constant f0 shifts causes deterministic distortions in the readout point spread function (PSF) which can be corrected during image reconstruction by a frequency demodulation which compensates the off resonance. Spatially varying shifts f0(r) can be addressed by reconstructing the images at a range of off demodulation frequencies, then combining the demodulated images by using a map of f0(r), either by choosing the pixel from the reconstruction that most closely matches f0(r) at each pixel (frequency segmented reconstruction), or by using a weighted combinations of all reconstructions such as in the multi-frequency interpolation (MFI) method [17]. However, such corrections are only possible when f0(r) varies slowly over the width of a voxel, as shortened would otherwise cause irrevocable signal loss.
In this study, we acquired 1H f0 maps with hyperpolarized 13C imaging in healthy volunteers. 13C imaging was performed with waveforms of two different durations (26 and 45 ms) but comparable resolution to estimate sensitivity to off resonance. Two methods of off-resonance correction - a global constant frequency shift, and a shift plus MFI f0(r) map corrections - were applied to the data. Unknown frequency shifts were solved for by maximizing autofocus metrics based on image gradient variance. The apparent myocardial wall full width at half maximum (FWHM) was assessed by taking 1D radial line projection of the images pre- and post-correction, and the signal response of the short and long waveforms was investigated.
Methods
Acquisition
Human Imaging and Dynamic Nuclear Polarization
Healthy volunteers were studied in the postprandial state with ECG gating using a 3 Tesla GE MR750w MRI system (GE Healthcare, Waukesha, WI). Subjects were positioned supine and entered the magnet head first. Cardiac gating was achieved with conventional ECG leads. All subjects were studied after written informed consent was obtained, under a protocol approved by the Institutional Review Board (IRB) of UT Southwestern Medical Center. Six volunteers volunteers were studied and 8 sets of HP images were acquired. All 8 data sets were included in the evaluation f0 correction. Two data sets from 2 additional volunteers were excluded from analysis due to the lack of observable bicarbonate signal.
1H Imaging Protocol
1H imaging was acquired with the body coil. Gradient shim values were optimized to a 12 cm FOV rectangular prism region enclosing the entire heart. The imaging protocol included SSFP localizers acquired on axial, horizontal long-axis, vertical long-axis, and short axis views all triggered to mid-diastole and acquired during expiration breath hold. A single-slice short axis prescription, acquired from mid left ventricle, was used for the SSFP localizer, B0 mapping, and 13C imaging. The f0 mapping sequence consisted of a single-slice gradient echo acquired at 2 echo times differing by 3.3 ms, 390 mm FOV, 6.09 mm pixel size. Margins of the entire heart as well as an approximately 2 cm length segment of posterior-lateral myocardium were delineated, and the f0 values within these ROIs were analyzed.
13C Imaging Protocol
[1-13C]pyruvic acid (Isotec) was mixed with 15 mM AH111501. Polarization and quality assurance were performed with a 5 Tesla SPINLab polarizer (General Electric, Niskayuna, NY). The polarized medium (nominal 240 mM pyruvate, 0.43 mL/kg) was injected at 5 mL per second using a Medrad injector (Medrad, Warrendale, PA) via antecubital IV line, followed by a 25 mL saline flush. For 7 acquisitions, 13C imaging was performed with a two-loop coil with 20 cm diameter and transmit-receive capabilities (PulseTeq Limited, Chobham, Surrey, UK) that was positioned with one loop over the anterior chest ventricle and one loop below the scapula. One additional dataset was acquired from a flexible transmit and 8 channel receive coil (Clinical MR Solutions, Brookfield, WI, USA), and only data from the 3 proximal channels to the heart were included in analysis.
A cardiac-triggered 13C sequence with spectral-spatial excitation and spiral gradient echo readout similar to that described previously [12] was implemented into the MNS Research Pack [11]. The sequence consisted of either a short- or long-duration constant-density spiral readout preceded by a spectral-spatial excitation (134 Hz FWHM pass bandwidth, 24 ms duration). All waveforms were designed to be compatible with the gradient performance of the MR scanner (33 mT/m peak amplitude, 120 mT/m/s peak slew rate). The long spiral was designed with the following parameters: FOV = 40cm, Gmax = 23 mT/m, Smax = 74 T/m/s, duration = 45 ms, resolution = 6.1 mm. The short spiral had the following parameters: FOV = 30 cm, Gmax = 33 mT/m, Smax = 100 mT/m/s, duration = 26 ms, resolution = 6.67 mm. The effective resolution after k-space apodization was 10.5 mm. Figure 1 shows both waveforms along with their corresponding point-spread functions. The center frequency of the water protons was used to determine the 13C frequency by assuming the two differ by a constant scale factor. In vivo measurements showed the proportionality between water and [1–13C]lactate to be 0.2514949. The 1H f0 map was first run to make sure the cardiac pixels were close to resonance, and then the conversion factor was applied to determine 13C frequency. Predetermined in vivo frequency shifts of [13C]bicarbonate (−713 Hz) and [1-13C]pyruvate (−393 Hz) relative to [1–13C]lactate were programmed in the sequence. Transmit B1 power was estimated using the natural abundance 13C signal of saline-loaded dimethyl silicone phantoms prior to volunteer imaging. The breath hold expiration command was given at the start of injection, and imaging started at the end of the flush. A single slice was acquired at two R-R intervals, alternating frequencies between [13C]bicarbonate (flip = 45°), [1-13C]lactate (flip = 45°), and[1-13C]pyruvate (flip = 25°), 8 repetitions at each metabolite, for approximately 50 s total imaging time. Reconstruction consisted of gridding [18], k space apodization with a Gaussian function, and sample density compensation.
Figure 1:
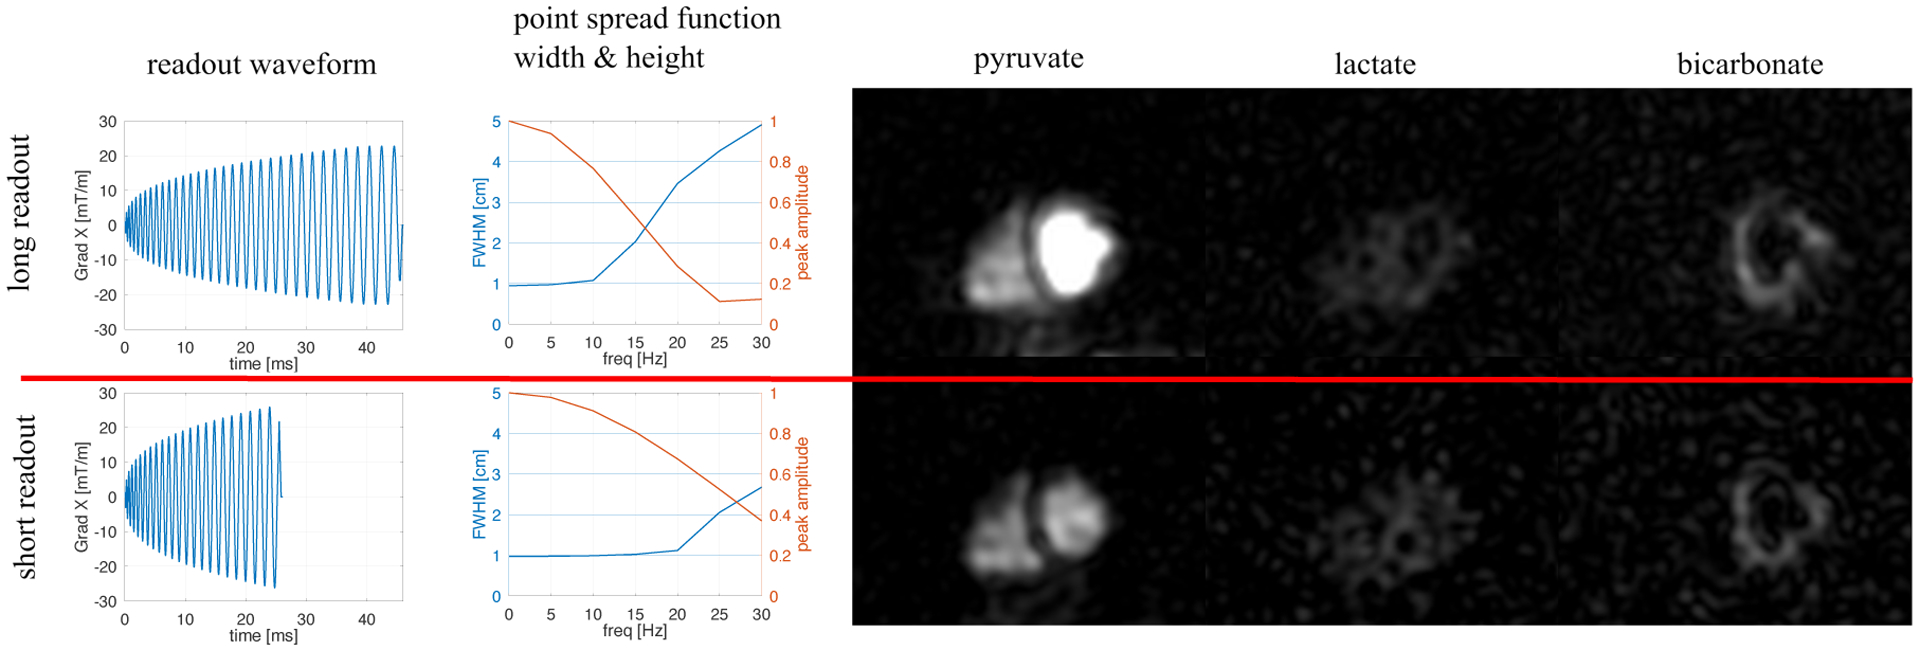
The 2 spiral waveforms tested had durations 45 and 26 ms. Both had comparable nominal resolutions (1.0 cm after k space apodization) but differing FOV (40 cm and 30 cm, respectively). As shown by the PSF width and height, the longer waveform is much more sensitive to even slight f0 offsets. However, the SNR is theoretically increased by 32% (experimentally 40 ± 30% measured in back-to-back injections in two volunteers). This is evidenced in a back to back comparison of these 2 readouts in the same volunteer (right). Image sharpness is better preserved in the bicarbonate image with the shorter waveform, but SNR is reduced.
Back to Back Waveform Comparison
Two volunteers received two injections in the same session (spaced by 30 minutes), where the 13C acquisition had identical parameters aside from readout waveform. To compare image SNR, a 1 cm2 region of interest was selected on the peak signal in the image with peak bicarbonate. ROIs were compared as mean ± standard deviation in SNR units.
Reconstruction and Analysis
13C Off-Resonance Correction
The spiral reconstruction was applied to data demodulated over a frequency range from −45 Hz to +45 Hz in 5 Hz steps, creating a complex-valued image Ij(r) at each frequency step fj. The f0 map was used to recombine these demodulated reconstructions. First, the f0 map pixels were passed through a median filter (3 × 3 kernel size) to eliminate noise spikes. Then the pixels were resampled to the resolution and FOV of the 13C acquisition using a B-spline interpolation function. Resampling was performed using the Python implementation of the Simple Insight Segmentation and Registration Toolkit (SimpleITK). The pixel values (in Hz) were then scaled by a ratio of the gyromagnetic ratios so that their values match to the 13C resonance frequency. After filtering and resampling, we define this frequency map f0(r), which corresponds to the estimated 13C off resonance detected by 1H.
To combine the images Ij(r) based on the frequency map f0(r), we implemented the multi-frequency interpolation (MFI) algorithm, where the final image pixels are a weighted sum of the image pixels from Ij(r)
| (1) |
where the coefficients cj are solutions to the system
| (2) |
and tk is the discretized sampling time domain during readout, k the readout sample index, and j the frequency index. See reference [17] for a detailed description. The Moore-Penrose pseudo inverse was used to solve for the coefficients in Equation 2, and the final image was reconstructed using Equation 1. A constant shift frequency fs added to the field map f(r) to compensate for small (< 20 Hz) errors in frequency setting. In principle, a real-time calibration [19] would eliminate the need for this fine-tuning step. However, experiments presented here were performed with an open loop controller. Therefore, the MFI in Equation 1 was performed with the offset frequency
| (3) |
An overview of the pipeline used for reconstruction is shown in Figure 2, and a copy of the source code performing these operations on a sample data set may be accessed at this link [20].
Figure 2:

Schematic of the f0 correction. The f0 map was first scaled by γ the ratio in order to be used for MFI on 13C. In addition to the standard MFI, an additional pipeline was added to account for global frequency offsets. This pipeline estimates the image sharpness using the gradient, and finds the shift frequency fs that gives the peak of this metric.
Autofocus Using Image Sharpness Estimation
To solve for the unknown shift fs, an autofocus algorithm was implemented which maximized an image sharpness objective. Several autofocus metrics presented in reference [21] were tested, including the Tenengrad algorithm (sum of gradient pixels above a threshold) and pixel variance (variance of the grayscale values). We used the Sobel variance method, in which the sharpness ϕ is defined as the variance of the image gradient pixels above a certain threshold T:
| (4) |
where ∇I(r) was calculated using the 3 × 3 Sobel operator, and T was defined as SNR = 5 cutoff. See Figure 3 for example 13C images and their corresponding Sobel gradients. The Sobel variance as well as the Sobel mean were found to yield ϕ(fs) curves with clear peaks and obvious maxima (see Figure 3). We found these metrics to be easier to optimize on than the imaginary signal component as has been previously used [12]. In theory, maximization of the ϕ(fs) curve can be performed separately for each metabolite. However, in practice, optimization of either the pyruvate or bicarbonate images was much more robust, as the lactate images often had very little definition and therefore non-convex ϕ(fs) curves (Figure 3). Since the units of ϕ are arbitrary, this function was normalized to the pre-correction value (ϕ(0)).
Figure 3:
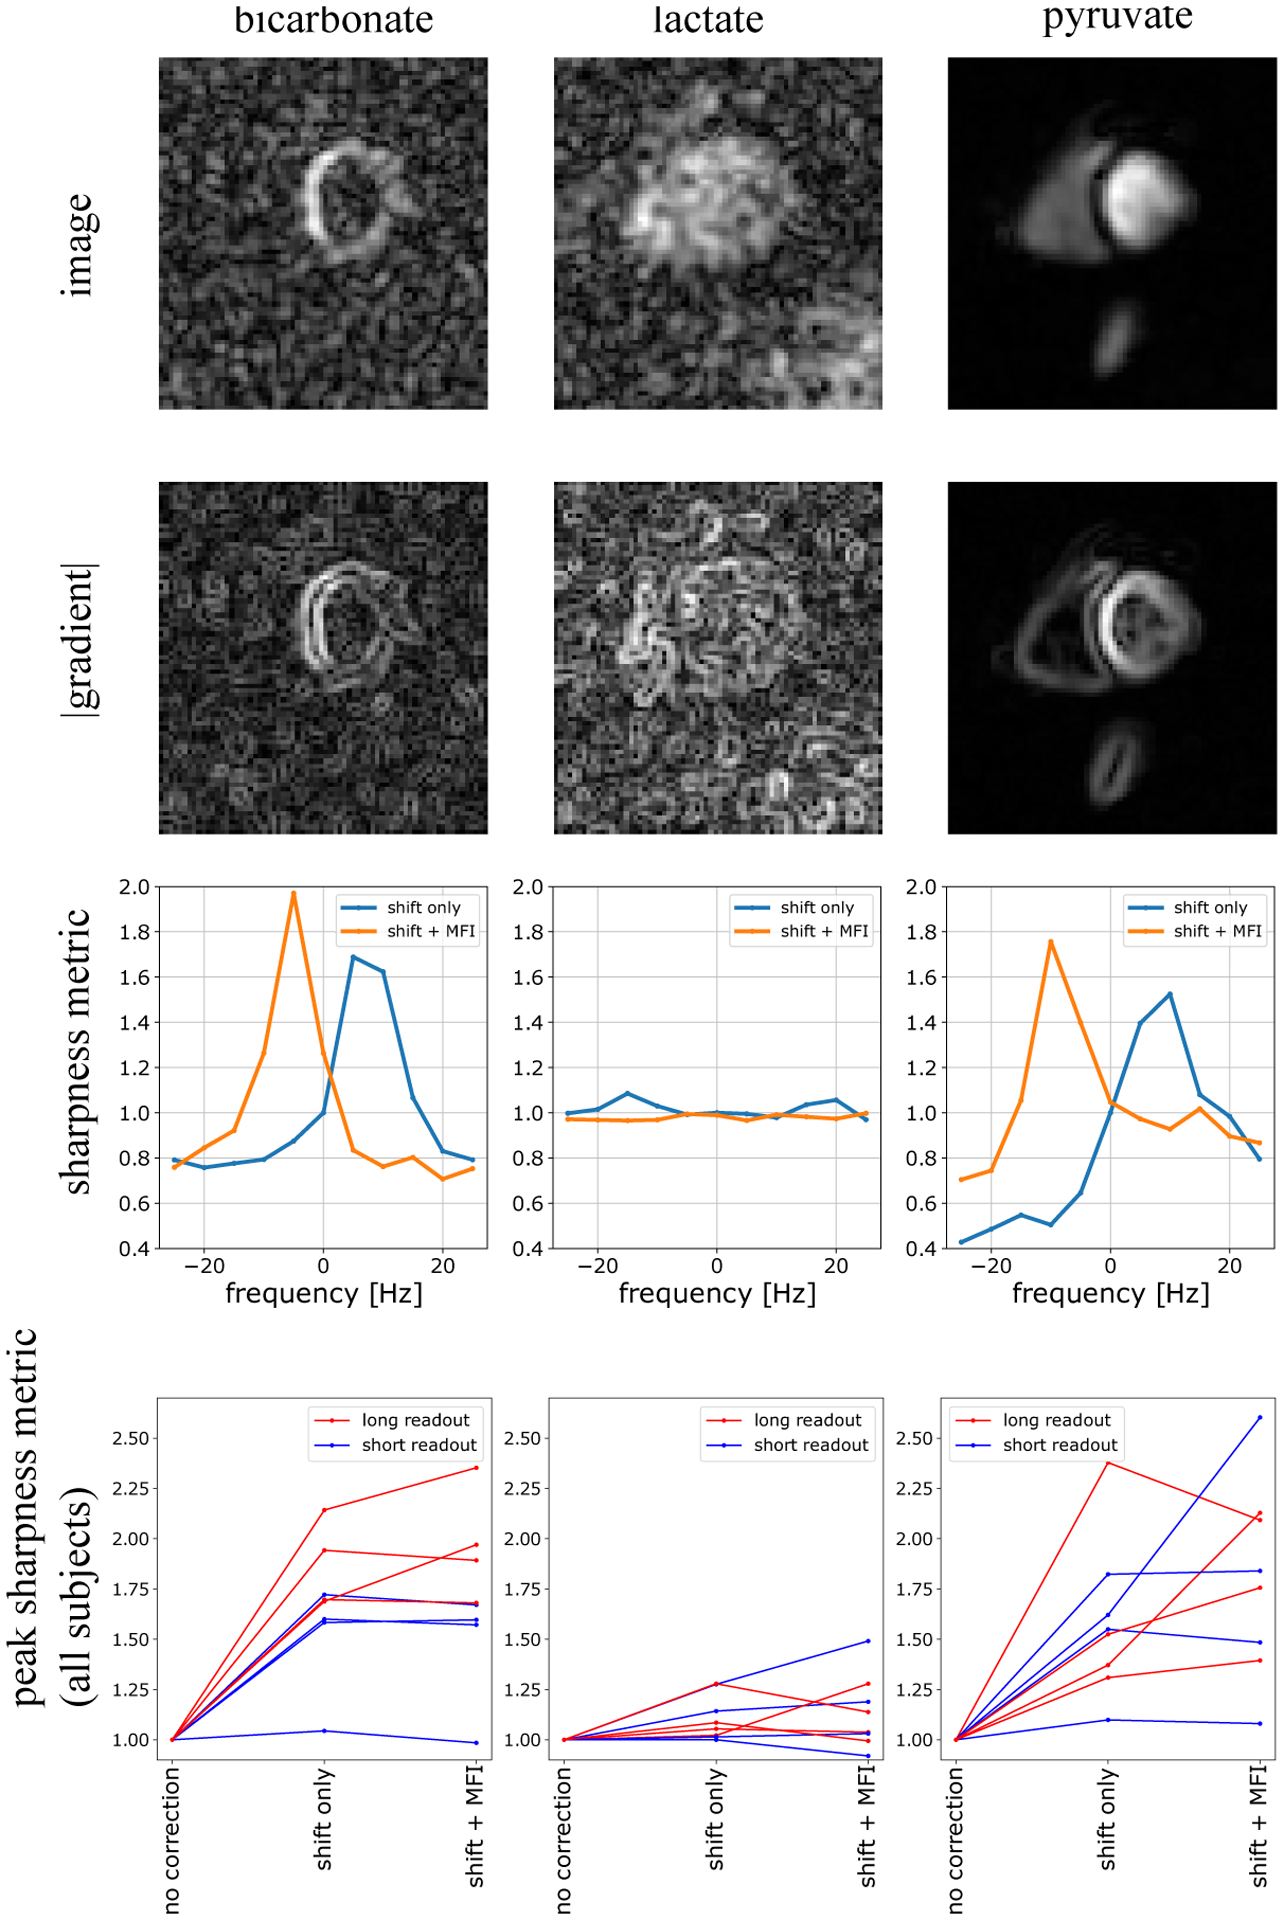
Using gradients to measure image sharpness improvement from f0 correction. Bicarbonate, lactate, and pyruvate images are shown on the top panel, and their corresponding gradients are displayed immediately below. Below these images is the sharpness metric ϕ derived from the gradient images, plotted as a function of shift frequency fs. As can be seen here, both pyruvate and bicarbonate gradients give ϕ(fs) curve shapes which have clear maxima, thus enabling determination of the best fs. This was more difficult for the lactate images which typically had very low sharpness. The bottom panel displays the sharpness before and after correction, normalized to the pre-correction value. All images benefited from the shift demodulation. In most cases, particularly those acquired with the long readout waveform, the f0 map correction further improved the sharpness.
FWHM Measurements on Bicarbonate Images
For each subject, the center coordinates of the left ventricular chamber were manually determined. From this center, 2.5-cm 1-dimensional line profiles were measured at 10 equally spaced projections on the bicarbonate images (see Figure 4, a). The full width half maximum (FWHM) of these line profiles was then calculated using a simple algorithm that finds the peak signal and steps in either direction until half maximum is achieved. Segments were excluded if half maximum was not found, or if the maxima were at the segment edges. This was calculated for all subjects on uncorrected, shift-corrected, and MFI-corrected data sets.
Figure 4:
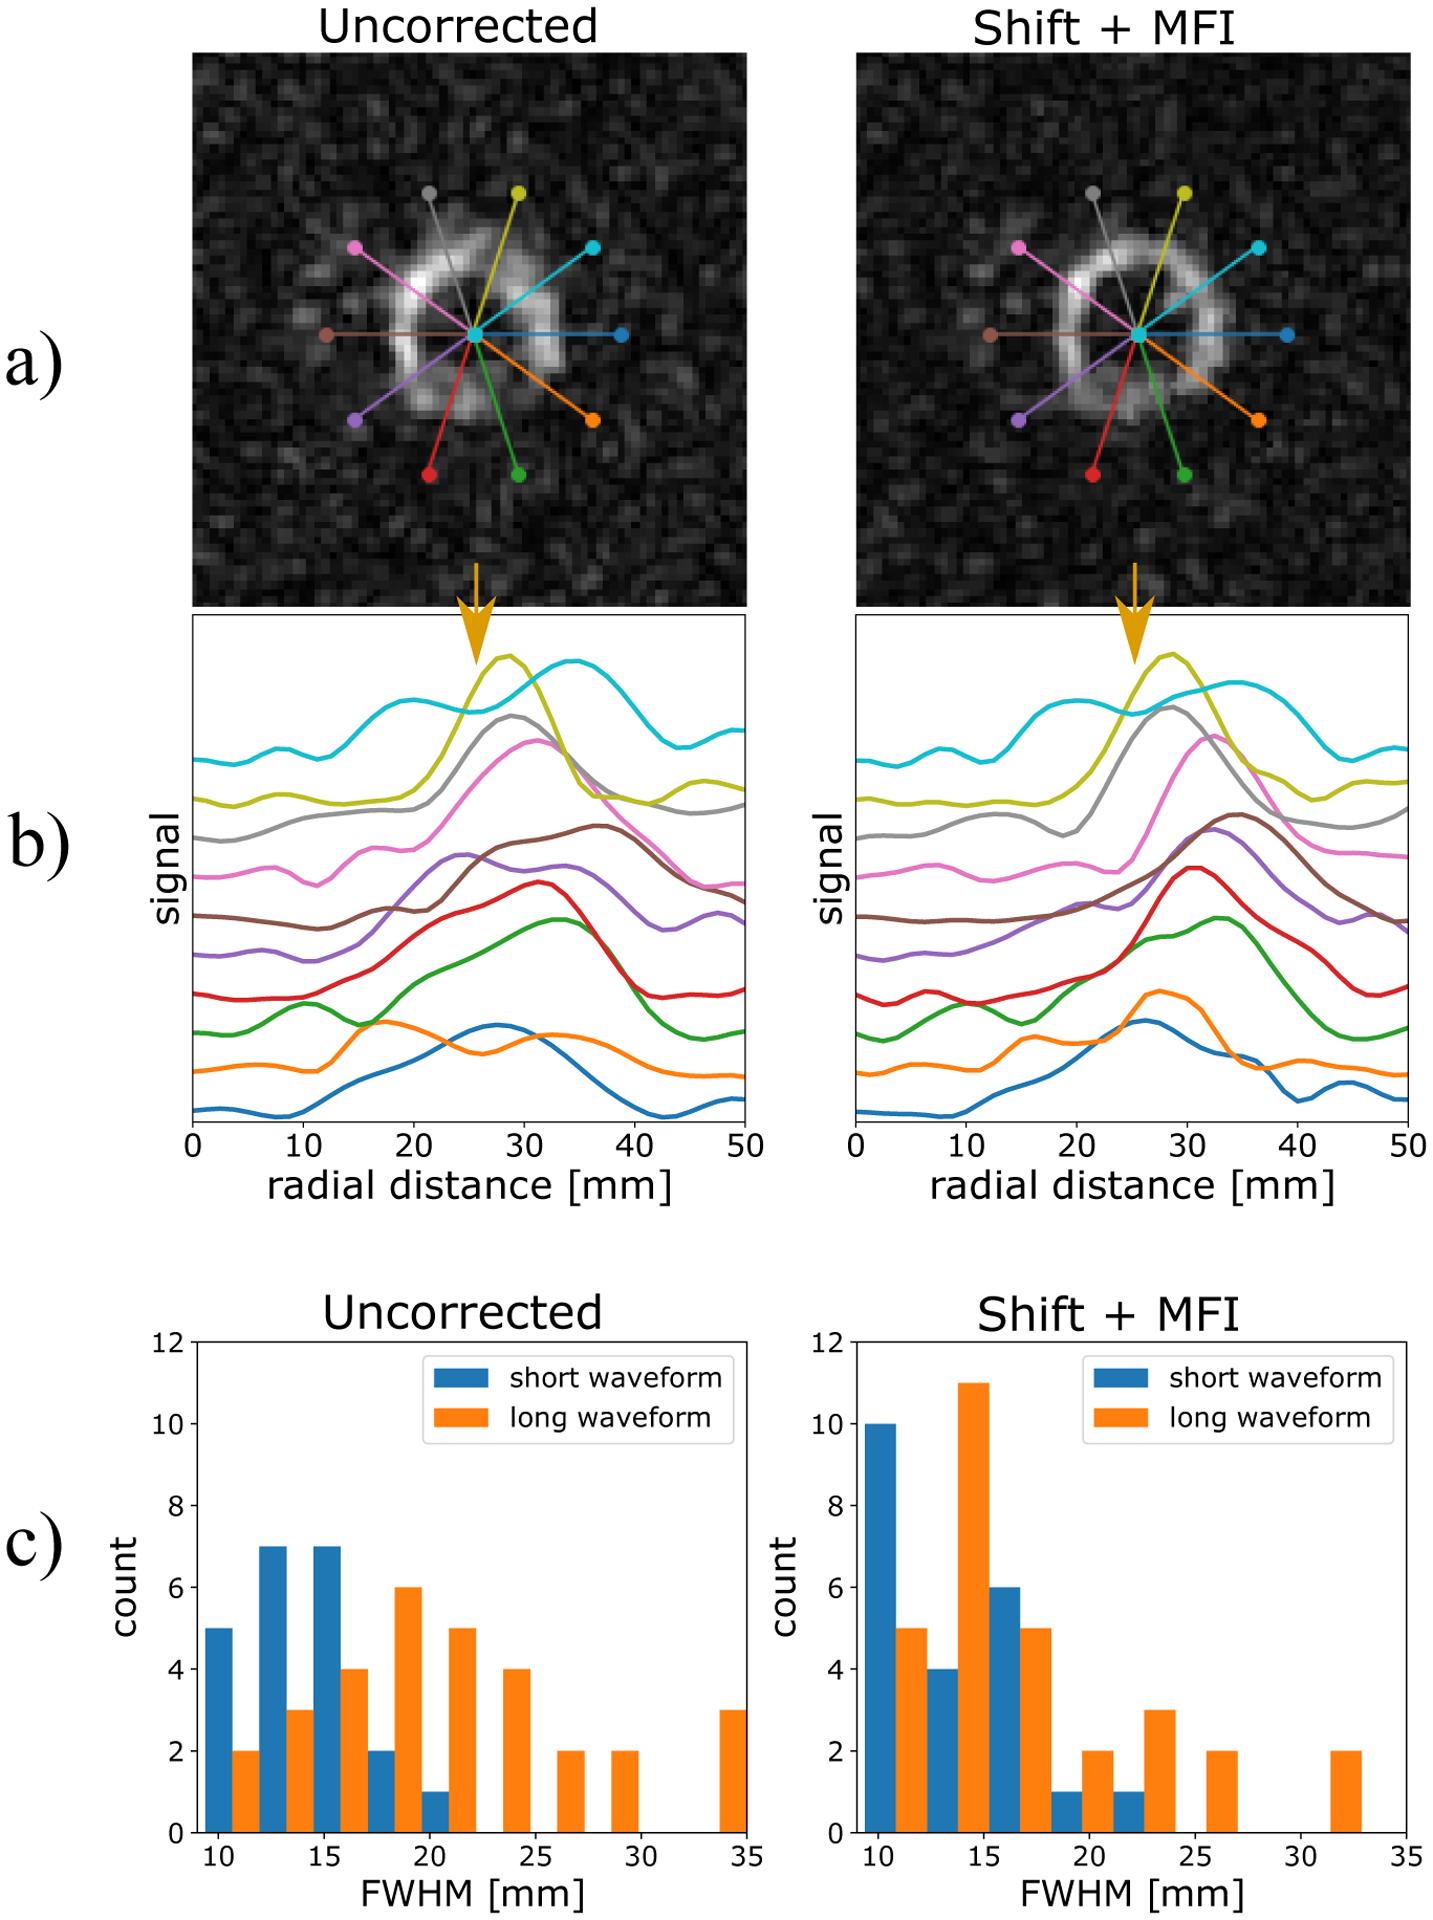
a) bicarbonate images pre- and post-correction. b) line profiles corresponding to the overlays in part a. c) Histograms of the FWHM of all segments of all 8 scans included in this study. FWHM were essentially unchanged with the short readout pre-correction (14.1 ± 2.9 mm) and post-MFI correction (14.1 ± 3.4 mm). With the long readout, FWHM decreased from 20.6 ± 6.6 mm uncorrected, 19.4 ± 8.9 after shift correction, and 17.7 ± 7.0 after MFI. The MFI-corrected FWHM values were significantly lower than the uncorrected values (p = .007), but still larger than those measured with the short readout.
Results
The back-to-back short- and long-readout comparisons were illustrated in Figure 1. Although the shorter waveform gave sharper depiction of bicarbonate, this was at the cost of SNR. Peak bicarbonate SNR increased by 1.6 ± 0.3 in the first volunteer (9.4 ± 1.4 with the short readout compared with 14.9 ± 1.8 with the long readout) and 1.1 ± .4 in the second volunteer (6.8 ± 1.3 with the short readout compared with 7.8 ± 1.6 with the long readout). The mean increase 1.4 ± 0.3 observed with the 45 ms readout compared to the 26 ms readout is in good agreement with the expected value of 1.32 from scaling SNR by the square root of the total read time.
13C images, their corresponding gradients, and sharpness measurements as a function of shift frequency ϕ(fs) and shift plus MFI correction ϕ(fs + f(r)) are shown in Figure 3. Data were normalized to their uncorrected values ϕ(fs = 0). Bicarbonate and pyruvate images yielded ϕ(f) curves with well-defined maxima from which the peak could easily be selected. Adjusting the center frequency alone typically gave a sharpness improvement of 1.68 ± .29 for bicarbonate, 1.11 ± .11 for lactate, and 1.58 ± .36 for pyruvate compared to uncorrected. Adding the f0 map-based correction further increased the sharpness for all metabolites: 1.72 ± .37 for bicarbonate, 1.13 ± .17 for lactate, and 1.79 ± .45 for pyruvate compared to uncorrected. Even though the means are shifted up when adding MFI, the inter-subject spreads are quite large so increases are not statistically significant compared to using shift-correction alone.
13C bicarbonate images, before and after correction, are shown in Figure 4 along with overlaid line profile locations. The signal profiles are plotted in Figure 4b. Although some projections are similar, many are made much narrower after correction. Binning these segments from all volunteers pre- and post- correction is shown in the histograms in Figure 4c. Mean FWHM were essentially unchanged with the short readout pre-correction (14.1 ± 2.9 mm) and post-MFI correction (14.1 ± 3.4 mm). With the long readout, FWHM decreased from 20.6 ± 6.6 mm uncorrected, 19.4 ± 8.9 after shift correction, and 17.7 ± 7.0 after MFI. The MFI-corrected FWHM values were significantly lower than the uncorrected values (p = .007), but still larger than those measured with the short readout. Furthermore, as the right histogram in Figure 4c shows, many long-readout segments remained with large FWHM values even after correction.
In all pyruvate images, the interventricular septum was sharper with MFI. Furthermore, structures outside of the heart were much better resolved as demonstrated in Figure 5. The aorta and spleen showed unresolved signal pre-correction, and only after MFI correction could the anatomy be identified. Lactate images were generally unchanged, although Figure 5 shows a case where the septum could only be resolved post-correction. Figure 5 also shows typical changes in bicarbonate images. Even if images were well-resolved pre-correction, many showed signal dropout at the posterior myocardium. In nearly every case, this corresponded to a divot of sharply decreased frequency on f0 maps, a phenomenon commonly observed at 3T [8]. The range (mean ± standard deviation of the maximum - minimum) of single slice, intra-cardiac f0 was 221 ± 35 Hz. These distributions tended to be narrow (30 ± 8 Hz inter-quartile range), but had long tails at lower frequency which corresponded to this later myocardium lung interface. 6 cm2 ROIs taken from this region showed a bias to lower frequency (−35 ± 9 Hz from resonance) and with much greater spread (−49 ± 6 Hz interquartile range).
Figure 5:
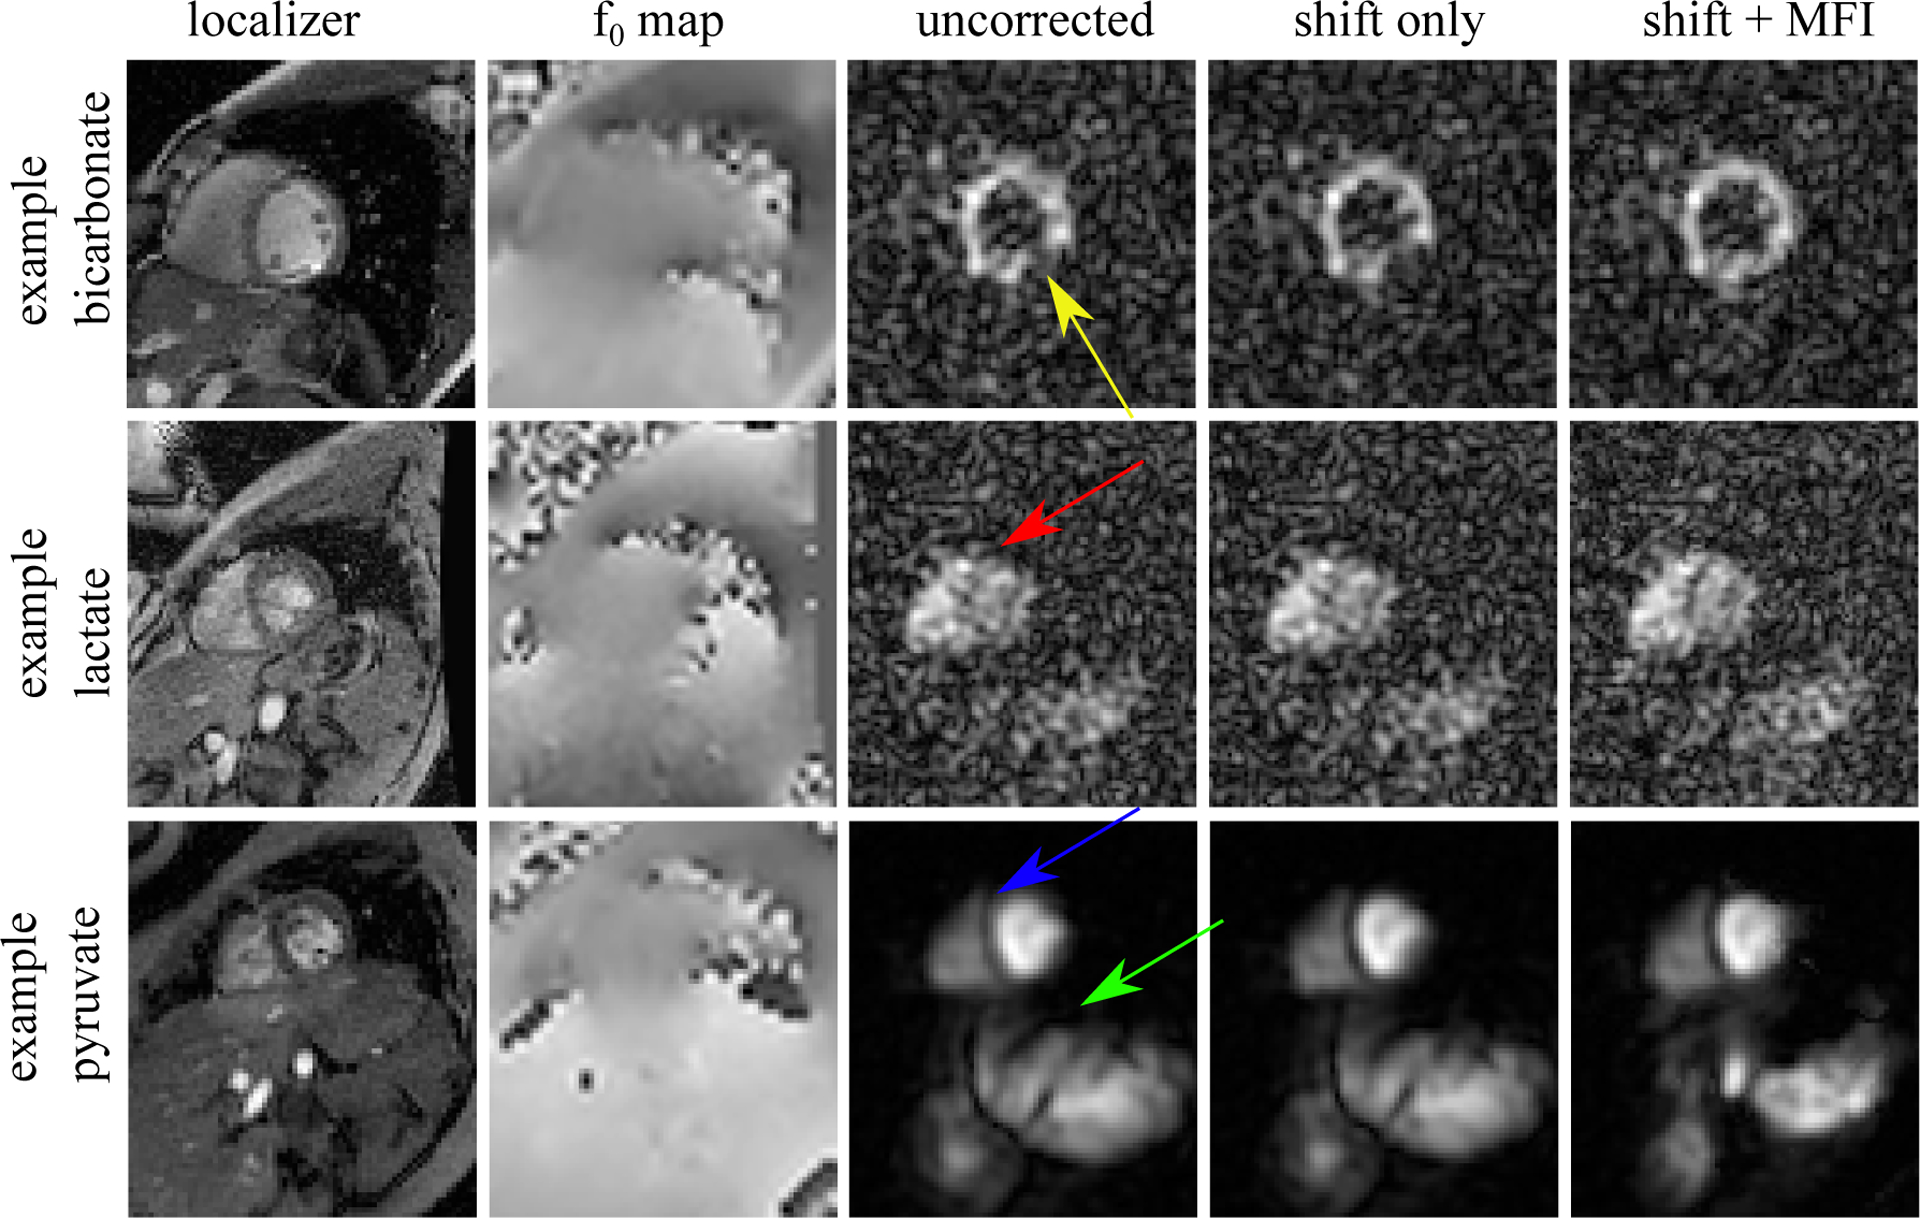
Example image improvement with f0 correction. The top panel shows a bicarbonate image with a large defect in the posterior myocardium (yellow arrow) which persisted after a global frequency shift correction. However, using the MFI f0 map-based correction, the defect disappeared indicating that it stemmed entirely from f0 inhomogeneity. Pyruvate and - to a lesser degree - lactate images also improved with MFI correction. The myocardial septum showed improved clarity in both lactate (red arrow) and pyruvate (blue arrow) after MFI. Furthermore, the aorta and splene (green arrow) were entirely out of focus pre-correction, and could only be resolved after MFI. This suggests that f0-map-based correction will be necessary for any large FOV imaging.
Discussion
Bicarbonate imaging was proposed as a novel method for monitoring regional myocardial ischemia and the metabolic consequences of coronary artery disease. Defects in the infero-lateral wall of the myocardium in porcine models were attributed to abnormal citric acid cycle function [22]. The current study found that the absence or heterogeneity of bicarbonate signal in some HP images of the healthy human myocardium in the same region (for example, yellow arrow in Figure 5) was due at least in part to f0 inhomogeneity. Since it will be important to distinguish clinically significant coronary artery disease from technical issues, two general mitigation strategies were investigated including shorter readouts and post-acquisition correction.
The FWHM measurements pre- and post-correction on the bicarbonate images suggest that long-readout data is greatly improved with MFI correction, but resolution is still shy of that achieved with the short spiral. This could be due to imperfect correction, errors in f0 maps, or possibly some non-negligible contribution from which would impact the longer readout more. 13C line shape measurements gave estimates of 58 ± 20 ms, but this value must be taken as a lower limit on as this parameter is likely highly resolution-dependent, particularly within the heart. The best case FWHM values (14.1 ± 2.9 mm with the short waveform, 17.7 ± 7.0 with the long waveform) in these healthy subjects are both greater than the upper limit of normal for left ventricular myocardium thickness measured at mid cavity with MRI previously (9 mm in women, 10 mm in men) [23]. This can be partially attributed to the large slice thickness used here combined with the curvature of the ventricular wall which caused partial volume effects. However, the challenge remains to achieve a point spread that preserves the myocardial wall thickness with 13C bicarbonate images. SNR currently limits pushing this resolution further, as other authors have reported the need to degrade resolution in order to encode bicarbonate with reliable SNR [24].
f0 correction improved some apparent regional defects in the bicarbonate images, but other factors such as transmit and receive B1 inhomogeneity may contribute to signal dropout. Based on measurements of B1 transmit and receive profiles of the coils used in this study, B1 inhomogeneities impart much less signal shading, while f0 artifact tends to manifest as a blur or a signal dropout. This coil shading was observed in the current study (for example, in the bicarbonate images in Figure 4), and can be seen on the porcine images shown previously, such as in Figure 8 of reference [22]. The images presented in this reference acquired on a Cartesian grid and were likely much less susceptible to the same f0 artifacts as spiral readouts.
The frequency segmented algorithm was implemented along with MFI for f0 map correction, but data were not independently reported here since they performed identically with respect to sharpness, FWHM, and qualitative image evaluation. MFI and frequency-segmented both require multiple frequency reconstructions, although MFI has been shown to give smaller error with fewer frequency samples. It is likely that the 5 Hz sampling used here is much greater than the critical sampling rate for observable breakdown of either segmented and MFI for images of this quality.
Prior positron imaging studies of glucose metabolism in the heart with the widely-used tracer, [18F] fluorodeoxyglucose, found regional heterogeneity in tracer uptake and phosphorylation even in subjects without known cardiac disease [7, 25, 26, 27]. In contrast, direct imaging of mitochondrial function using [11C]acetate, a tracer that bypasses all steps in carbohydrate metabolism, indicates homogeneous fluxes throughout the myocardium [7]. The current results, showing relatively homogeneous oxidation of pyruvate in these short axis images after correction for f0 variability, are most consistent with earlier [11C]acetate results.
Although this study focused on the heart, the finding that aorta and spleen can be much better resolved after MFI correction indicates that f0 map based correction of 13C imaging may prove valuable for any large-FOV imaging using spiral readouts. This better depiction of extra-cardiac structures post correction was observed with both long and short readouts. This is likely due at least in part to the fact that the shim settings were optimized within the box ROI placed around the heart that had an approximately 10 cm edge length. Pixels residing outside this region can have f0 distributions deviating substantially from resonance. The loop coil used in this study has greater sensitive volume than the 8 channel paddle arrays used for previously reported studies [2, 4].
Conclusion
A pipeline for f0 map-based correction using the MFI algorithm has been demonstrated and implemented in 8 volunteer scans. This pipeline was integrated with an image gradient-based frequency tuning so that the correction could be fully automated and account for small frequency mis-settings. The signal response of long- and short-duration spiral waveforms was investigated with respect to f0 inhomogeneity and f0 correction. These measurements indicate that f0 map correction will be critical for longer duration spiral waveforms, or for imaging which covers large FOV s where it is difficult to optimize shims for all regions.
Acknowledgments
This work was supported by National Institutes of Health (EB015908, S10OD018468, and S10RR029119), the Welch Foundation (I-2009-20190330), and The Cancer Prevention Research Institute of Texas (RP180404)
References
- [1].Nelson SJ, Kurhanewicz J, Vigneron DB, Larson PEZ, Harzstark AL, Ferrone M, van Criekinge M, Chang JW, Bok R, Park I, Reed G, Carvajal L, Small EJ, Munster P, Weinberg VK, Ardenkjaer-Larsen JH, Chen AP, Hurd RE, Odegardstuen LI, Robb FJ, Tropp J, Murray JA. Metabolic imaging of patients with prostate cancer using hyperpolarized [1-13C]pyruvate. Sci Transl Med 2013; 5:198ra108. [DOI] [PMC free article] [PubMed] [Google Scholar]
- [2].Cunningham CH, Lau JY, Chen AP, Geraghty BJ, Perks WJ, Roifman I, Wright GA, Connelly KA. Hyperpolarized 13C metabolic MRI of the human heart. Circ Res 2016; 119:1177–1182. [DOI] [PMC free article] [PubMed] [Google Scholar]
- [3].Merritt ME, Harrison C, Storey C, Jeffrey FM, Sherry AD, Malloy CR. Hyperpolarized 13C allows a direct measure of flux through a single enzyme-catalyzed step by NMR. Proc Natl Acad Sci U S A 2007; 104:19773–7. [DOI] [PMC free article] [PubMed] [Google Scholar]
- [4].Park JM, Reed GD, Liticker J, Putnam WC, Chandra A, Yaros K, Afzal A, MacNamara JP, Raza J, Hall RG, Baxter J, Derner K, Pena S, Kallem RR, Subramanyan I, Edpuganti V, Harrison C, Muthukumar A, Lewis C, Reddy S, Unni N, Klemow D, Syed S, Li HC, Cole SM, Froehlich T, Ayers CR, de Lemos JA, Malloy CR, Haley B, Zaha VG. Effect of doxorubicin on myocardial bicarbonate production from pyruvate dehydrogenase in women with breast cancer. Circ Res Epub ahead of print; 0. [DOI] [PMC free article] [PubMed] [Google Scholar]
- [5].Lau AZ, Chen AP, Cunningham CH. Imaging the circumferential hyperpolarized 13C-bicarbonate distribution in the normal heart. In: Proc Intl Soc Mag Reson Med 27, Montreal, 2019. p. 256. [Google Scholar]
- [6].Dominguez-Viqueira W, Geraghty BJ, Lau JY, Robb FJ, Chen AP, Cunningham CH. Intensity correction for multichannel hyperpolarized 13C imaging of the heart. Magn Reson Med 2016; 75:859–865. [DOI] [PubMed] [Google Scholar]
- [7].Gropler RJ, Siegel BA, Lee KJ, Moerlein SM, Perry DJ, Bergmann SR, Geitman EM. Nonuniformity in myocardial accumulation of fluorine-18-fluorodeoxyglucose in normal fasted humans. J Nucl Med 1990; 31:1749–1756. [PubMed] [Google Scholar]
- [8].Atalay MK, Poncelet BP, Kantor HL, Brady TJ, Weisskoff RM. Cardiac susceptibility artifacts arising from the heart-lung interface. Magn Reson Med 2001; 45:341–345. [DOI] [PubMed] [Google Scholar]
- [9].Jaffer FA, Wen H, Balaban RS, Wolff SD. A method to improve the B0 homogeneity of the heart in vivo. Magn Reson Med 1996; 36:375–383. [DOI] [PubMed] [Google Scholar]
- [10].Reeder SB, Faranesh AZ, Boxerman JL, McVeigh ER. In vivo measurement of and field inhomogeneity maps in the human heart at 1.5 T. Magn Reson Med 1998; 39:988–998. [DOI] [PMC free article] [PubMed] [Google Scholar]
- [11].Schulte RF, Sperl JI, Weidl E, Menzel MI, Janich MA, Khegai O, Durst M, ArdenkjaerLarsen JH, Glaser SJ, Haase A, Schwaiger M, Wiesinger F. Saturation-recovery metabolic-exchange rate imaging with hyperpolarized [1-13C] pyruvate using spectral-spatial excitation. Magn Reson Med 2013; 69:1209–1216. [DOI] [PubMed] [Google Scholar]
- [12].Lau AZ, Chen AP, Ghugre NR, Ramanan V, Lam WW, Connelly KA, Wright GA, Cunningham CH. Rapid multislice imaging of hyperpolarized 13C pyruvate and bicarbonate in the heart. Magn Reson Med 2010; 64:1323–31. [DOI] [PubMed] [Google Scholar]
- [13].Lewis AJ, Miller JJ, Lau AZ, Curtis MK, Rider OJ, Choudhury RP, Neubauer S, Cunningham CH, Carr CA, Tyler DJ. Noninvasive immunometabolic cardiac inflammation imaging using hyperpolarized magnetic resonance. Circ Res 2018; 122:1084–1093. [DOI] [PMC free article] [PubMed] [Google Scholar]
- [14].Schroeder MA, Lau AZ, Chen AP, Gu Y, Nagendran J, Barry J, Hu X, Dyck JR, Tyler DJ, Clarke K, Connelly KA, Wright GA, Cunningham CH. Hyperpolarized 13C magnetic resonance reveals early-and late-onset changes to in vivo pyruvate metabolism in the failing heart. Eur J Heart Fail 2013; 15:130–140. [DOI] [PMC free article] [PubMed] [Google Scholar]
- [15].Lau AZ, Miller JJ, Robson MD, Tyler DJ. Cardiac perfusion imaging using hyperpolarized 13C urea using flow sensitizing gradients. Magn Reson Med 2016; 75:1474–1483. [DOI] [PMC free article] [PubMed] [Google Scholar]
- [16].Tyler A, Lau JYC, Ball V, Timm KN, Zhou T, Tyler DJ, Miller JJ. A 3D hybrid-shot spiral sequence for hyperpolarized imaging. Magn Reson Med 2020; n/a. [DOI] [PMC free article] [PubMed] [Google Scholar]
- [17].Man LC, Pauly JM, Macovski A. Multifrequency interpolation for fast off-resonance correction. Magn Reson Med 1997; 37:785–792. [DOI] [PubMed] [Google Scholar]
- [18].Beatty PJ, Nishimura DG, Pauly JM. Rapid gridding reconstruction with a minimal oversampling ratio. IEEE T Med Imaging 2005; 24:799–808. [DOI] [PubMed] [Google Scholar]
- [19].Tang S, Milshteyn E, Reed G, Gordon J, Bok R, Zhu X, Zhu Z, Vigneron DB, Larson PEZ. A regional bolus tracking and real-time B1 calibration method for hyperpolarized 13C MRI. Magn Reson Med 2019; 81:839–851. [DOI] [PMC free article] [PubMed] [Google Scholar]
- [20].https://github.com/galenreed/spiralB0MapCorrection, Accessed: 2020-10-10.
- [21].Pech-Pacheco JL, Cristobal G, Chamorro-Martinez J, Fernandez-Valdivia J. Diatom autofocusing in brightfield microscopy: a comparative study. In: Proceedings 15th International Conference on Pattern Recognition. ICPR-2000, Barcelona, Spain, 2000. pp. 314–317. [Google Scholar]
- [22].Golman K, Petersson JS, Magnusson P, Johansson E, Akeson P, Chai CM, Hansson G, Mansson S. Cardiac metabolism measured noninvasively by hyperpolarized 13C MRI. Magn Reson Med 2008; 59:1005–1013. [DOI] [PubMed] [Google Scholar]
- [23].Lang RM, Badano LP, Mor-Avi V, Afilalo J, Armstrong A, Ernande L, Flachskampf FA, Foster E, Goldstein SA, Kuznetsova T, Lancellotti P, Muraru D, Picard MH, Rietzschel ER, Rudski L, Spencer KT, Tsang W, Voigt JU. Recommendations for cardiac chamber quantification by echocardiography in adults: an update from the american society of echocardiography and the european association of cardiovascular imaging. J Am Soc Echocardiogr 2015; 28:1–39.e14. [DOI] [PubMed] [Google Scholar]
- [24].Gordon JW, Autry AW, Tang S, Graham JY, Bok RA, Zhu X, VillanuevaMeyer JE, Li Y, Ohilger MA, Abraham MR, Xu D, Vigneron DB, Larson PEZ. A variable resolution approach for improved acquisition of hyperpolarized 13C metabolic MRI. Magn Reson Med 2020; 84:2943–2952. [DOI] [PMC free article] [PubMed] [Google Scholar]
- [25].Gropler RJ. Methodology governing the assessment of myocardial glucose metabolism by positron emission tomography and fluorine 18-labeled fluorodeoxyglucose. J Nucl Cardiol 1994; 1:S4–14. [DOI] [PubMed] [Google Scholar]
- [26].Choi Y, Brunken RC, Hawkins RA, Huang SC, Buxton DB, Hoh CK, Phelps ME, Schelbert HR. Factors affecting myocardial 2-[f-18]fluoro-2-deoxy-d-glucose uptake in positron emission tomography studies of normal humans. Eur J Nucl Med 1993; 20:308–318. [DOI] [PubMed] [Google Scholar]
- [27].Maurer A, Burshteyn M, Adler L, Gaughan J, Steiner R Variable cardiac 18FDG patterns seen in oncologic positron emission tomography computed tomography: Importance for differentiating normal physiology from cardiac and paracardiac disease. J Thorac Imaging 2012; 4:263–268. [DOI] [PubMed] [Google Scholar]