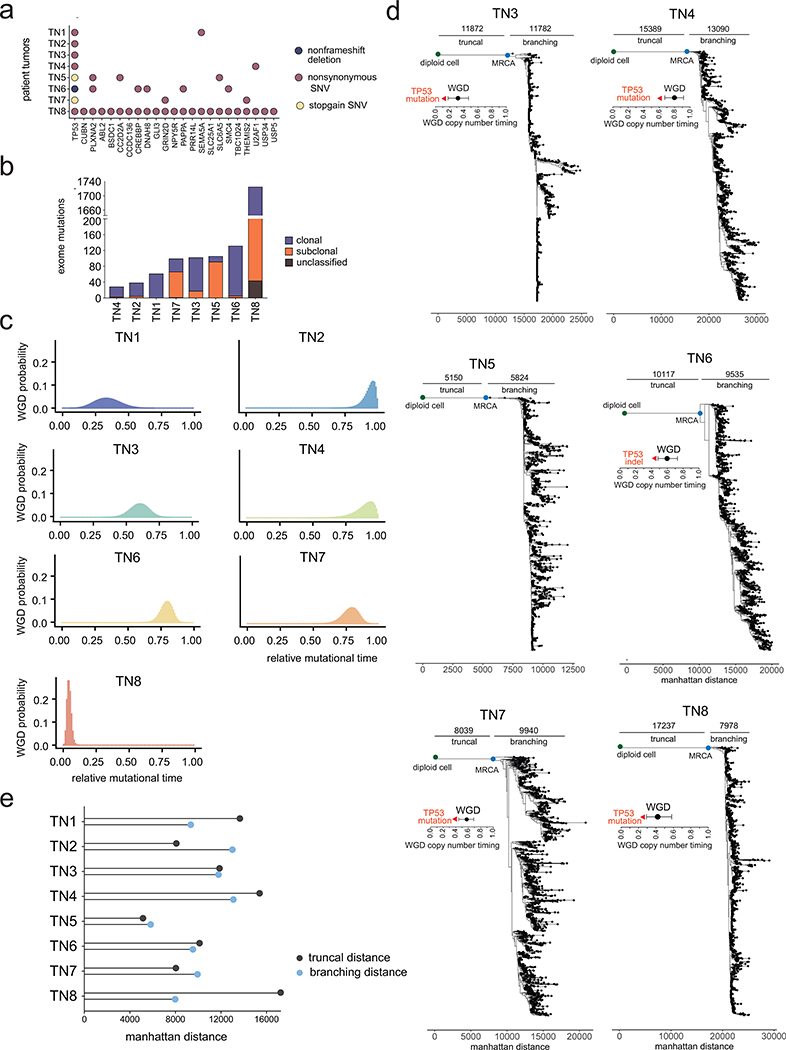
Extended Data Figure 5 – Whole Genome Doubling Estimates and Additional Copy Number Lineages.
(a) Exome mutation counts of each tumor indicating mutations that were classified as clonal or subclonal based on allele-specific copy number frequencies. (b) Most frequent exonic mutations in genes with significant SIFT (<0.05) and Polyphen2 (>0.85) scores. (c) Density plots showing the probability of genome doubling as a function of relative mutational time for 7 out of the 8 TNBC patients with sufficient number of truncal exome mutations (d) Minimum evolution trees of single cell copy number profiles using Manhattan distances for TN3-TN8, indicating the distance from the diploid root node to the most recent common ancestral (MRCA) and the distance from the MRCA to the terminal nodes. Annotations indicate the timing of genome doubling and timing of TP53 mutations prior to WGD in all of the tumors. (e) Summary of the truncal distances from the diploid root node to the MRCA and the branching distances from the MRCA to the last terminal node.

