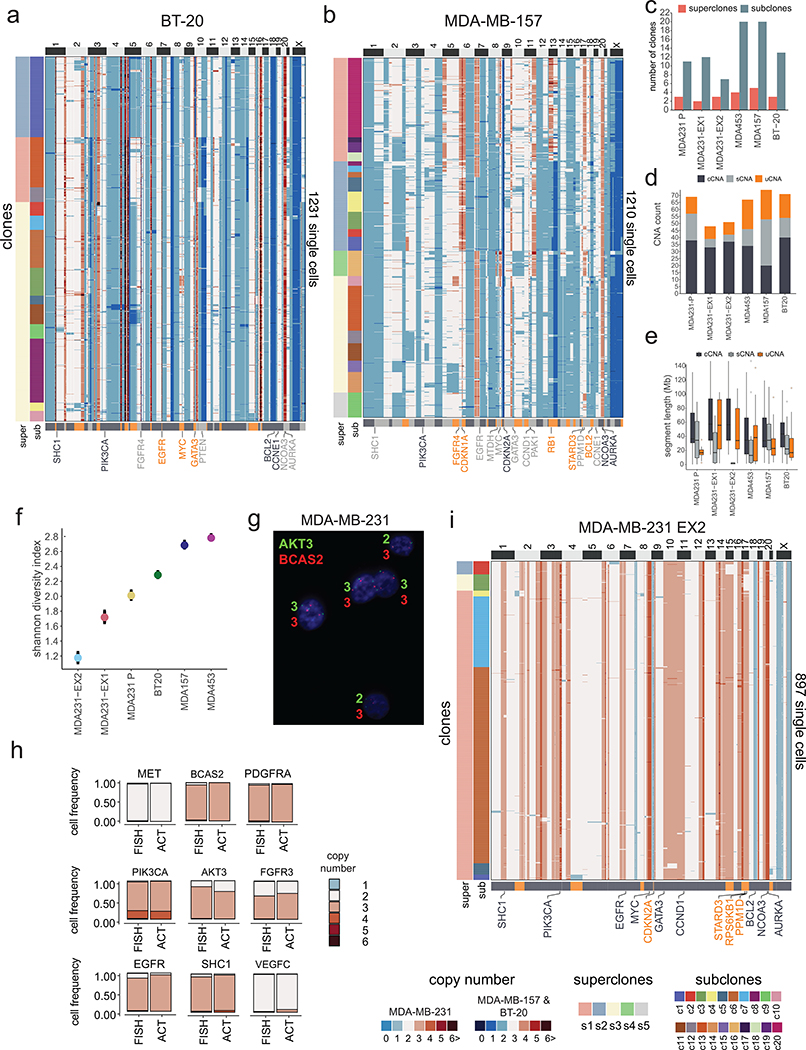
Extended Data Figure 8 – Clonal Substructure of Additional TNBC Cell Lines and Single Cell Expansions.
(a-b) Clustered heatmaps of single cell copy number data from the BT-20 (n = 1231 cells) and MDA-MB-157 (n = 1210 cells) cell lines, in which left annotation bars represent superclones and subclones, while the bottom annotation bar represents different classes of CNA types (c) Number of superclones and subclones identified in the TNBC cell lines (d) Number of clonal, subclonal and unique CNAs detected in the 4 TNBC cell lines, as well as the two MDA-MB-231 expanded daughter cells. (e) Distributions of the genomic sizes of clonal, subclonal and unique CNAs across the 4 TNBC cell lines and the two MDA-MB-231 expanded daughter cell lines. (f) Shannon indexes calculated from the single cell copy number profiles from the 4 TNBC cell lines and the two expanded MDA-MB-231 daughter cells with 95% confidence intervals. (g) Microscopic field of DNA-FISH experiments of MDA-MB-231 using AKT3 and BCAS2 probes at 60X magnification. (h) Barplots showing the results of DNA-FISH copy number states counted across 1000 cells for each of the probes compared to the ACT data. (i) Clustered heatmap of single cell copy number data for MDA-MB-231 EX2 cell line expansion (n = 897 cells), in which left annotation bars represent superclones and subclones, while the bottom annotation bar represents different classes of CNA types.

