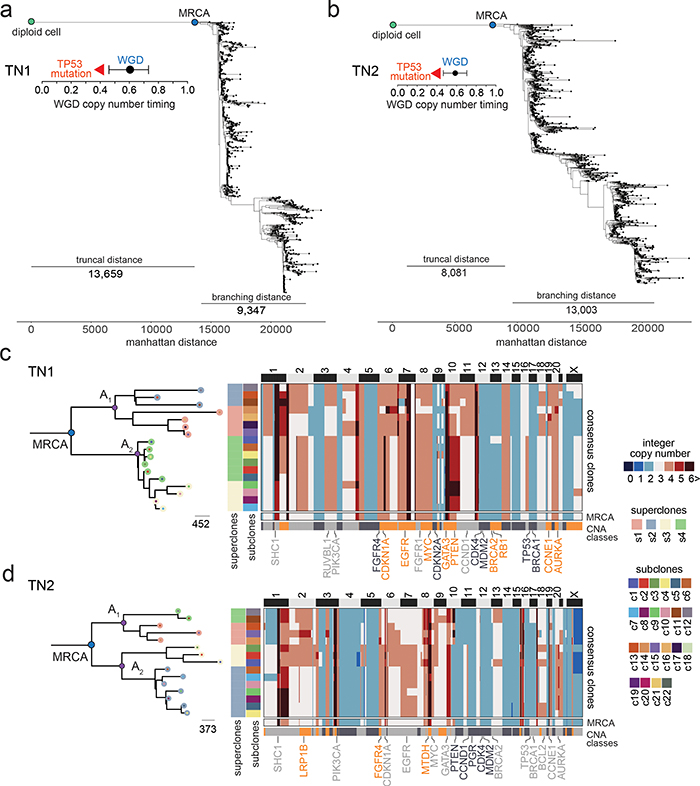
Figure 3 – Evolutionary Analysis of Clonal Lineages in TNBC Patients.
(a-b) Minimum evolution trees of single cell copy number data for TN1 and TN2, with annotations indicating the time of the WGD events and confidence intervals, as well as the timing of TP53 mutations (c-d) Minimum evolution trees after the MRCA generated using consensus CNA profiles of subclones for TN1 and TN2 and rooted by a neutral node to the MRCA, with common ancestors (A1, A2) in the left panels. Right panels show consensus copy number profile heatmaps of subclones, where the bottom rows represent the inferred MRCA profile and different CNA classes.

