

Abstract
The Covid-19 Corona Virus, also known as SARS-CoV-2, has wreaked havoc around the world, and the condition is only getting worse. It is a pandemic disease spreading from person-to-person every day. Therefore, it is important to keep track the number of patients being affected. The current system gives the computerized data in a collective way which is very difficult to analyze and predict the growth of disease in a particular area and in the world. Machine learning algorithms can be used to successfully map the disease and its progression to solve this problem. Machine Learning, a branch of computer science, is critical in correctly distinguishing patients with the condition by analyzing their chest X-ray photographs. Supervised Machine learning models with associated algorithms (like LR, SVR and Time series algorithms) to analyze data for regression and classification helps in training the model to predict the number of total number of global confirmed cases who will be prone to the disease in the upcoming days. In this proposed work, the overall dataset of the world is being collected, preprocessed and the number of confirmed cases up to a particular date are extracted which is given as the training set to the model. The model is being trained by supervised machine learning algorithms to predict the growth of cases in the upcoming days. The experimental setup with the above mentioned algorithms shows that Time series Holt’s model outperforms Linear Regression and Support Vector Regression algorithms.
Keywords: Supervised Learning, Regression, Prediction, Accuracy
1. Introduction
SARS CoV-2 causes Corona Virus Disease (COVID-19), which is an infectious disease (Severe Acute Respiratory Syndrome Corona Virus 2). The first case of this disease was discovered in Wuhan, China, in December 2019. The disease has spread around the world since its discovery, and the World Health Organisation (WHO) declared it a pandemic in March 2020. In a short period of time, the epidemic has spread to over 100 countries. When an infected person gets into direct contact with other individuals, the virus that triggers COVID - 19 spreads. When an infected person sneezes or coughs, tiny droplets containing the virus will spread. When an infected individual comes into contact with infected surfaces, it will spread.
Cough, fever, weakness, shortness of breath, lack of taste and scent, and often no signs at all, are all symptoms of this illness. The lower and upper respiratory tracts are mostly affected by the disease. The primary organs affected by the condition are the lungs. The infected person develops signs within 2–14 days, based on the MERS (middle east respiratory syndrome) and SARS incubation periods (severe acute respiratory syndrome). Patients are at a high risk of death as a result of this.
Medications for this condition are administered to patients depending on symptoms diagnosed. Preventive precautions include social distancing in public and busy environments, wearing a mask, preventing contact with infectious people, hand washing, and so on. Many organisations have created vaccines, and different countries have launched mass vaccination programs. Vaccines are still being developed by several organisations. Despite the fact that research is ongoing to produce medications that block virus development within the human body, the latest therapy is symptomatic and ineffective. The drug cannot entirely prevent the patient’s death, and the symptomatic treatment may cause adverse effects in those who have received it.
COVID-19 can be detected medically based on symptoms or travel history, and the virus can be confirmed using reverse transcription-polymerase chain reaction (RT-PCR) (RT-PCR). Chest CT scans, in addition to laboratory tests, can be used to detect COVID-19 in people who have a high clinical suspicion of infection. Prior infection can be detected by serological tests, which then identify antibodies formed by the body in response to infection.
2. Related work
In order to diagnose the disease effectively, researchers have developed many approaches like machine learning for diagnosing the disease. Machine learning, in addition to clinical approaches, assists in disease diagnosis by using textual data and images [13]. In addition to diagnosis, it is essential to keep track of the growth of COVID-19. The number of infected cases that can be estimated in the coming days can be predicted using a genetic algorithm, a logistic growth regression model, and a sigmoid model (Ganesh Kumar M, SohiniSengupta, SareetaMugde, DrGarima Sharma). In addition to that, the existing approaches is applicable for a particular region and gives less accuracy in forecasting the future cases globally and analyzes only small amount of data. In order to improve accuracy in prediction and to analyze large dataset, supervised machine learning algorithms especially time series forecasting algorithm called Holt's Winter algorithm is preferred over other algorithms.
Linear regression (LR) [7] and Support Vector (SVR) [13], Supervised Machine Learning algorithms can be used in statistical analysis to forecast predicted numerical values. Time series Forecasting algorithm, an example of classifier supervised machine learning algorithm aids in forecasting values of a time series at multiple time points in the future.
To train the model for predicting the total number of positive cases in the world in the coming days, the proposed work employs both regression and time series algorithms. The dataset, which includes the total number of confirmed, recovered, and death cases around the world, is taken, preprocessed to minimize analysis time, and given to the model as training and testing information. As a result, the current research focuses on using the clinical text COVID - 19 dataset to forecast an improvement in the number of global COVID - 19 positive cases in the future (Fig. 1 ).
Fig. 1.
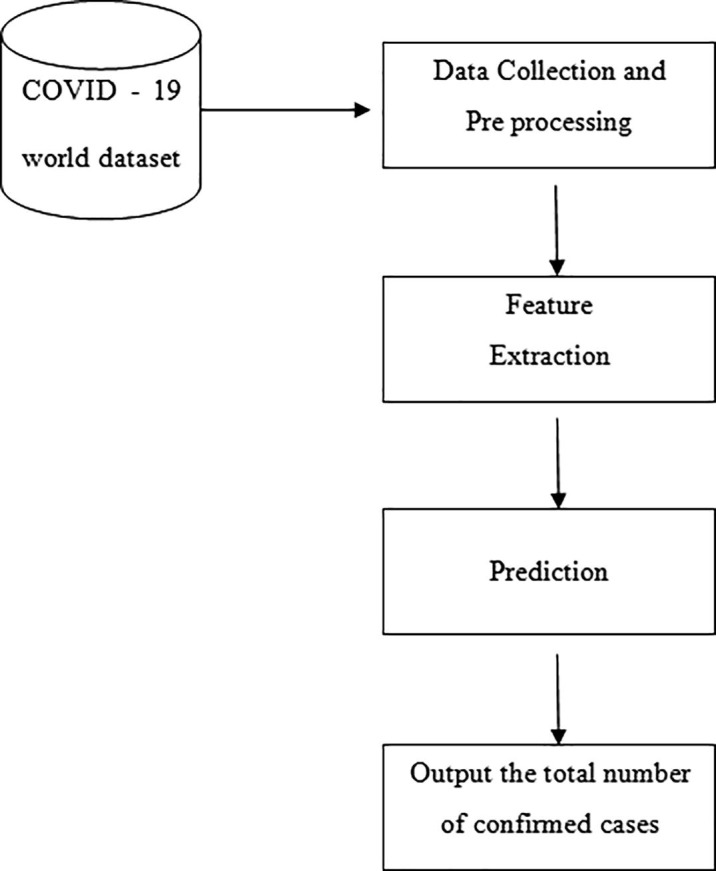
Flow Diagram.
The above diagram represents the flow diagram of Predicting the number of future infected cases using machine learning algorithms. There are different phases namely preprocessing, feature extraction and prediction for detecting forest smokes. Initially, the dataset which is the form of rows and columns that are gathered from different sources with different data, are converted to a CSV (Comma-Separated Values) file. It is then passed to pre processing where the dataset with different attributes is being converted to standardized dataset containing the date, state/province, country, number of confirmed, recovered and death cases. Then, feature extraction is done by LR, SVR and Holt’s winter time series model. Feature extraction includes extracting necessary columns or data to be given as input to the model. Then, prediction is made by applying respective algorithms to the model and future confirmed cases are being obtained.
2.1. Data collection
As per W.H.O [16] declared Corona Virus pandemic situation as Health Emergency [21]. Open access has been given by researchers and hospitals regarding Covid-19. We have used covid-19 dataset which was taken from John Hopkin's university repository. Serial Number, Observation Date, State/Province, Country/Region, Last Update, Confirmed, Deaths, and Recovered are the eight attributes. The information was gathered between January and December 2020. The dataset includes 172,479 documents from the 6th of December 2020 to the 6th of December 2020. The number of confirmed cases expected by the model for the next few days is compared to the real-world covid-19 confirmed cases data to determine the model's accuracy.
2.2. Preprocessing
The unstructured text must be refined by which machine learning can be made. Different kinds of steps are followed in this phase. Unnecessary texts are removed so that the text is being cleaned [15]. Lemmatization and punctuation are used to further refine the results. Stop terms, ties, and icons are omitted in order to increase classification and distinction accuracy.
2.3. Feature extraction
Various features are extracted from the preprocessed clinical reports and are converted into probabilistic values as per the semantics [15]. We use NumPy and Pandas library forextracting relevant features. We identified relevant features like confirmed cases, data wise confirmed case, death, recovered cases, etc., by which the classification can be achieved. Corresponding weight to the feature was given and the machine learning algorithms are supplied with same inputs.
2.4. Prediction
To forecast the number of confirmed cases worldwide in the future, we employ supervised Machine learning algorithms like LR, SVR, Time series forecasting Holt-Winter model to train the model by providing the necessary feature as training input.
2.5. Predicting the global confirmed cases
With the help of Holt-Winters Exponential Smoothing method, we were able to predict the future number of globally conformed cases very accurately. This method was better when we compare to both Linear Regression [7] and Support Vector Machine algorithm [13].
2.6. Dataset used
The dataset of COVID-19 is taken from John Hopkin's University repository [11] which contains the data ob observation, name of the country, name of the state or province, update time, for the particular day, the number of reported cases, rescued cases, and death cases [20] (Table 1 ).
Table 1.
Sample dataset from John Hapkin’s University.
| S.No. | Observation Date | State/Province | Country/Region | Last Update | Confirmed | Deaths | Recovered |
|---|---|---|---|---|---|---|---|
| 1 | 12/06/2020 | Yukon | Canada | 2020/12/07 05:26:14 |
54.0 | 1.0 | 41.0 |
| 2 | 12/06/2020 | Yunnan | China | 2020/12/07 05:26:14 |
221.0 | 2.0 | 210.0 |
| 3 | 12/06/2020 | Zabaykalsky krai | Russia | 2020/12/07 05:26:14 |
2083.0 | 339.0 | 18955.0 |
| 4 | 12/06/2020 | Zacatecas | Mexico | 2020/12/07 05:26:14 |
18098.0 | 1430.0 | 0.0 |
| 5 | 12/06/2020 | Zeeland | Netherland | 2020/12/07 05:26:14 |
6710.0 | 104.0 | 0.0 |
2.6.1. Metrics used
Accuracy is treated as a one of the most important parameters for analyzing the proposed work. Since the future growth of infected cases, comparison with real time data gives the correct accuracy of data which is predicted by the model. The actual data is obtained from John Hopkin’s University [20] repository and compared them with the output which is being predicted by the model by applying supervised machine learning algorithms (Table 2 ).
Table 2.
Total number of confirmed cases for a period of time.
| S.No. | Observation Date | Total Number of Confirmed Cases in the world |
|---|---|---|
| 1 | 2020-12-07 | 67,199,309 |
| 2 | 2020-12-08 | 67,767,138 |
| 3 | 2020-12-09 | 68,414,122 |
| 4 | 2020-12-10 | 6,069,399 |
| 5 | 2020-12-11 | 71,164,680 |
3. Proposed methodologies
3.1. Linear Regression
One of the most common and straightforward Machine Learning algorithms is linear regression. It’s a statistical approach as well as a predictive research technique. The linear regression algorithm, as the name suggests, shows a linear relationship between a dependent and one or more independent variables. Since linear regression reveals a linear relationship, it finds the change in the dependent variable’s value as a function of the independent variable’s value [7].
In this method, we have classified the dataset into four types namely, number of confirmed cases, active cases, death cases and closed cases. For instance we took last five dates and found the confirmed cases by using linear regression (Table 3 ).
Table 3.
Sample confirmed cases.
| S.No. | Dates | Linear Regression Output |
|---|---|---|
| 0 | 2020-12-07 | 44,885,167 |
| 1 | 2020-12-08 | 45,059,184 |
| 2 | 2020-12-09 | 45,233,201 |
| 3 | 2020-12-10 | 45,407,218 |
3.2. Support Vector Machine
It is also known as the most common Supervised Learning algorithm and is used for both regression and classification problems. However, it is mostly used in Machine Learning for classification problems. The key aim of SVM is to establish the best line and judgment boundary that can segregate n-dimensional space into groups such that new data points can be conveniently placed in the right category in the future. A hyper plane is a boundary that represents the right choice [13].
In SVR, we have classified the dataset into four types as above and for instance we took last five dates and found out the confirmed cases by using Support Vector Machine algorithm [13]. We then compared the values which we have obtained from Linear Regression and Support Vector Regression algorithm. There was a large difference between them and also between the real time data set. Then we chose another algorithm called Time Series algorithm to train the model (Table 4 ).
Table 4.
Comparison of LR and SVM for confirmed cases.
| S.No. | Dates | Linear Regression Output | Support Vector Machine Output |
|---|---|---|---|
| 0 | 2020-12-07 | 44,885,167 | 24,290,160 |
| 1 | 2020-12-08 | 45,059,184 | 24,535,983 |
| 2 | 2020-12-09 | 45,233,201 | 24,784,889 |
| 3 | 2020-12-10 | 45,407,218 | 25,036,906 |
3.3. Serious forecasting method
A time series approach incorporates approaches that aim to surmise a time series model in terms of interpreting the basic concept of the data points in the time series or proposing or make projections, and it has sequential data points that are mapped at a given successive time period. When forecasting or modeling data using timeseries research, a significant model is used to forecast conclusions based on known historical outcomes. For example, in a restaurant, a prediction is made about the number of visitors, such as when will more customers come to the restaurant at a certain moment based on recent customer appearances and the time.
Machine Learning is a well-known reality and is one of the most effective techniques for imagining natural language processing and expression for a large dataset. Problems based on time series models, on the other hand, do not typically include interpreted datasets, except though data is obtained from multiple sources and shows major gaps in characteristics, properties, attributes, temporal scales, and dimensionality.
Timeseries research requires a single sorting algorithm that can process time-dependent patterns through various models other than images and voice. Forecasting, grouping, anomaly, and clustering discovery are all examples of machine learning techniques that are based on real-world business applications. In Time-Series Analysis, there are various Machine Learning models. In contrast to Regression and Help Vector Machine algorithms, we used the Holt Winter exponential smoothing method, which provided high precision.
3.3.1. Holt-Winters model
Forecasting with Holt-Winters is a method of modeling and projecting the behavior of a set of values over time. Holt-Winters is one of the most widely used time series forecasting methods. Holt-Winters is a time series behavior model. The Holt-Winters model is a way to model the three facets of the time series: a normal value, a slope over time, and a cyclical recurring trend, which are all required for forecasting. Holt-Winters utilizes the exponential smoothing process to encode more historical values and use them to forecast traditional values in the present and future.
3.3.2. Exponential Smoothing
The Exponential Smoothing method predicts the next value by taking a weighted average of all past values, with the weights decaying exponentially from the most recent to the oldest historical value. When you use Exponential Smoothing, you’re thinking that the more recent values of the time series models are much more significant than older values. The exponential Smoothing approach has two main drawbacks: it can't be used when your data has a pattern or seasonal variations.
3.3.3. Holt Exponential Smoothing
The Holt ES methodology corrects one of the two flaws in the simple ES method. Holt ES can be used to forecast trending time series results. In the case of seasonal changes in the time sequence, however, Holt ES struggles.
3.3.4. Holt-Winters Exponential Smoothing
The Holt-Winters Exponential Smoothing technique is a modification of the Holt Exponential Smoothing technique that allows it to be used in the presence of pattern and seasonality. We were able to forecast the future number of globally conformed cases very accurately using the Holt-Winters Exponential Smoothing technique. As compared to Linear Regression and Help Vector Machine, this approach worked better.
4. Results and discussion
The above diagram shows the algorithm wise prediction result by the model. LR and SVR are the existing algorithms which gives less number of confirmed case compared to theproposed time series Holt’s Winter model in this work. Hence, the predictions made by themodel based on the algorithm may be more or less accurate. Thus, it requires comparisonwith the actual data of number of infected cases. The model can be further trained byincreasing the number of training set to fit over the actual data (Fig. 2 , Table 5, Table 6 ).
Fig. 2.

Results of Growth of Cases Monthly.
Table 5.
Results obtained using LR, SVM and Holt-Winters Method.
| S.No. | Dates | Linear Regression Output | Support Vector Machine Output | Holt-Winters Exponential Smoothing Output |
|---|---|---|---|---|
| 0 | 2020-12-07 | 44,885,167 | 24,290,160 | 58,850,358 |
| 1 | 2020-12-08 | 45,059,184 | 24,535,983 | 59,224,764 |
| 2 | 2020-12-09 | 45,233,201 | 24,784,889 | 59,599,169 |
| 3 | 2020-2-10 | 45,407,218 | 25,036,906 | 59,973,575 |
Table 6.
Result comparison with actual data to predicted accuracy.
| S.No. | Dates | LR | SVR | Holts Winter Model Prediction | Real data of total global confirmed cases |
|---|---|---|---|---|---|
| 0 | 2020-12-07 | 44,885,167 | 24,290,160 | 58,850,358 | 67,199,309 |
| 1 | 2020-12-08 | 45,059,184 | 24,535,983 | 59,224,764 | 67,767,138 |
| 2 | 2020-12-09 | 45,233,201 | 24,784,889 | 59,599,169 | 68,414,122 |
| 3 | 2020-12-10 | 45,407,218 | 250,336,906 | 59,973,575 | 69,069,399 |
| 4 | 2020-12-11 | 45,581,235 | 25,292,064 | 60,347,981 | 71,164,680 |
The above diagram shows the result containing comparison of the trained model output with LR, SVR, Holt’s winter linear model with the actual data of growth of infected cases in the world with COVID-19 on that particular day. The comparison shows that Holt’s winter linear model gives about 87% accuracy of predicting the future global confirmed cases compared to other two algorithms which are used to rain the model. Moreover, time series forecasting Holt's Winter model outperforms the other since it can predict the future data with high accuracy with the given time series COVID - 19 dataset.
5. Conclusion
The ultimate aim of the proposed work is to use supervised machine learning algorithms to analyze the global COVID - 19 data and estimate the total number of global reported cases in the future. This work proposed a time series forecasting Holt’s winter model that, when compared to LR and SVR algorithms, has higher precision in predicting future data. Furthermore, we use python libraries to measure and reflect the current trend of COVID-19 in the world using graphical representation and view the curve based on the disease's monthly trend globally. In the future, we expect to broaden our activities to include real-time deployment.
Cloud Analytics can be used very easily to monitor the outbreak, forecast epidemic progress, and devise plans and policies to stop it from spreading. The machine learning models can be further programmed to make more accurate predictions about the number of new cases and when the pandemic will stop. In order to provide fail-safe computing and fast data analysis, we suggest a system for deploying these models on cloud datacenters. Private health-care centers and government hospitals consistently submit their optimistic patient count in a cloud-based world. Population growth, atmospheric patterns, average and median age, health services, and other factors would be factored in to improve the precision of potential forecasts.
Declaration of Competing Interest
The authors declare that they have no known competing financial interests or personal relationships that could have appeared to influence the work reported in this paper.
References:
- 7.Description of Logistic Regression Algorithm, https://machine learningmastery.com/logistic-regression-for-machine-learning/. Accessed 15 May 2019.
- 11.John Hopkins University repository, https://coronavirus.jhu.edu/data.
- 13.A.M.U.D. Khanday, Q.R. Khan, S.T. Rabani, SVMBPI: support vector machine based propaganda identification. SN Appl. Sci.(accepted).
- 15.Kumar A., Dabas V., Hooda P. Text classification algorithms for mining unstructured data: a SWOT analysis. Int. J. Inf. Technol. 2018 doi: 10.1007/s41870-017-0072-1. [DOI] [Google Scholar]
- 16.Medscape Medical News, The WHO declares public healthemergency for novel corona virus, 2020, https://www.medscape.com/viewarticle/924596
- 20.Wikipedia corona virus Pandemic data, https://en.m.wikipedia.org/wiki/Template:2019 %E2%80%9320_coronavirus_pandemic_data. Accessed 10 Apr 2020.
- 21.World health organization, https://www.who.int/new-room/g-adetail/q-a-corronaviruses#:/ text=symptoms. Accessed 10 Apr 2020.
Further reading
- 1.J. Bullock, A. Luccioni, K.H. Pham, C.S.N. Lam, M. Luengo-Oroz, Mapping the landscape of artificial intelligence applications against COVID-19, 2020.
- 2.Chakraborti S., Choudhary A., Singh A., et al. A machine learning based method to detect epilepsy. Int. J. Inf. Technol. 2018;10:257–263. doi: 10.1007/s41870-018-0088-1. [DOI] [Google Scholar]
- 3.Chen N., Zhou M., Dong X., Qu J., Gong F., Han Y., Qiu Y., Wang J., Liu Y., Wei Y., Xia J., Yu T., Zhang X., Zhang L. Epidemiological and clinical characteristics of 99 cases of 2019novel corona virus pneumonia in Wuhan, China: a descriptive study. Lancet. 2020;395(10223):507–513. doi: 10.1016/S0140-6736(20)30211-7. [DOI] [PMC free article] [PubMed] [Google Scholar]
- 4.Description of Adaboost Algorithm, https://towardsdatascience.com/boosting-algorithm- adaboost-b673719ee60c. Accessed 10 July 2019.
- 5.Description of Boosting Algorithm, https://towardsdatascience.com/boosting. Accessed 10 July 2019.
- 6.Description of Decision Tree Algorithm, https://dataspirant.com/2017/01/30/how_decision_tree_algorithm_works/. Accessed 10 July 2019.
- 8.Description of Multinomial Naı¨ve Bayes Algorithm, https://www.3pillarglobal.com/ insights/document-classification-using-multi nomial-naive-bayes-classifier. Accessed 15 May 2019
- 9.Friedman J.H. Stochastic gradient boosting. Comput. Stat. Data Anal. 2002;38(4):367–378. doi: 10.1016/S0167-9473(01)00065. [DOI] [Google Scholar]
- 10.Jiang X., Coffee M., Bari A., Wang J., Jiang X., Huang J., Shi J., DaiJ C.J., Zhang T., Wu Z., He G., Huang Y. Towards an artificial intelligence framework for data-driven prediction of corona virus clinical severity. Comput. Mater. Contin. 2020;63(1):537–551. [Google Scholar]
- 12.R. Katuwal, P.N. Suganthan, Enhancing multi-class classification of random forest using random vector functional neural network and oblique decision surfaces, 2018, Arxiv:1802.01240v1.
- 14.A.M.U.D. Khanday, A. Amin, I. Manzoor, R. Bashir, FaceRecognition techniques: a critical review, 2018.
- 17.Sarwar A., Ali M., Manhas J., et al. Diagnosis of diabetes type-II using hybrid machine learning based ensemble model. Int. J. Inf. Technol. 2018 doi: 10.1007/s41870-018-0270-5. [DOI] [Google Scholar]
- 18.Verma P., Khanday A.M.U.D., Rabani S.T., Mir M.H., Jamwal S. Twitter sentiment analysis on Indian Government Project using R. Int. J. Recent Tech. Eng. 2019 doi: 10.35940/ijrte.C6612.098319. [DOI] [Google Scholar]
- 19.L. Wang, A. Wong A, COVID-Net: a tailored deep convolutional neural network design for detection of COVID-19 cases from chest radiography images, 2020. https://arxiv.org/abs/2003.09871. [DOI] [PMC free article] [PubMed]
- 22.Wu F., Zhao S., Yu B., Chen Y.M., Wang W., Song Z.G., Hu Y., TaoZW T.JH., Pei Y.Y., Yuan M.L., Zhang Y.L., Dai F.H., Liu Y., Wang Q.M., Zheng J.J., Xu L., Holmes E.C., Zhang Y.Z. A new corona virus associated with human respiratory disease in china. Nature. 2020;44(59):265–269. doi: 10.1038/s41586-020-2008-3. [DOI] [PMC free article] [PubMed] [Google Scholar]
- 23.Barani A.M., Latha R., Manikandan R. Implementation of artificial fish swarm optimization for cardiovascular heart disease. International Journal of Recent Technology and Engineering (IJRTE) 2019;08(4S5):134–136. [Google Scholar]
- 24.R. Manikandan, R. Latha, C. Ambethraj, An analysis of map matching algorithm for recent intelligent transport system. Asian J. Appl. Sci. 5 (1), Retrieved from https://www.ajouronline.com/index.php/AJAS/article/view/4642.
- 25.R. Sathish, R. Manikandan, S. Silvia Priscila, B.V. Sara, R. Mahaveerakannan, A report on the impact of information technology and social media on Covid–19, in: 2020 3rd International Conference on Intelligent Sustainable Systems (ICISS), Thoothukudi, India, 2020, pp. 224-230, doi: 10.1109/ICISS49785.2020.9316046.