

Abstract
Spatiotemporal data mining (STDM) discovers useful patterns from the dynamic interplay between space and time. Several available surveys capture STDM advances and report a wealth of important progress in this field. However, STDM challenges and problems are not thoroughly discussed and presented in articles of their own. We attempt to fill this gap by providing a comprehensive literature survey on state-of-the-art advances in STDM. We describe the challenging issues and their causes and open gaps of multiple STDM directions and aspects. Specifically, we investigate the challenging issues in regards to spatiotemporal relationships, interdisciplinarity, discretisation, and data characteristics. Moreover, we discuss the limitations in the literature and open research problems related to spatiotemporal data representations, modelling and visualisation, and comprehensiveness of approaches. We explain issues related to STDM tasks of classification, clustering, hotspot detection, association and pattern mining, outlier detection, visualisation, visual analytics, and computer vision tasks. We also highlight STDM issues related to multiple applications including crime and public safety, traffic and transportation, earth and environment monitoring, epidemiology, social media, and Internet of Things.
Keywords: Spatial, Spatiotemporal, Data Mining, Challenges Issues, Research Problems
Introduction
There has been an increase in the research of Spatiotemporal Data Mining (STDM) due to growing availability of geo-referenced and temporal data and also due to the complexity and poor performance when applying classical data mining methods (Shekhar et al. 2015; Wachowicz et al. 2008). Large amounts of spatiotemporal data are being generated and captured through systems that record sequential observations of remote sensing, mobility, wearable devices, and social media. Spatiotemporal data represent different phenomena ranging from micro-scale of DNA and cell evolution, to global ones, e.g., climate change (Yang et al. 2020). The wide-availability of user-generated data via the social media platforms offers great opportunities to understand people needs, thoughts, and sentiments toward specific topics, products, or services (Hamdi et al. 2018). Medical sensory devices observe different activities at various locations of the human body over specific time ranges. STDM proposes new methods to handle such data through advanced predictive and descriptive tasks such as classification and clustering to work best with space and time referenced data. STDM methods are concerned with relationships and dependencies among different measurements. These relationships are complex, implicit, and dynamically changing. To a large extent, classical data mining assumes that data are independent and identically distributed (i.i.d.). On the contrast, spatiotemporal data do not follow this assumption and STDM methods aim to capture the autocorrelation among different events or data points that are interdisciplinary in nature, i.e, data from multiple domains that may require the utilisation of various mining tasks.
Spatiotemporal data comprise spatial and temporal representations. They include three distinct types of attributes, namely, non-spatiotemporal, spatial and temporal attributes (Tan 2006). The non-spatiotemporal attributes represent non-contextual features of objects. Spatial attributes define the locations, extents, and shapes of the objects. Temporal attributes are timestamps and durations of processes denoting spatial object (vector) or field (raster layers). For example, air pollution spatiotemporal data have non-spatiotemporal attributes such as air pollution levels or station names, spatial coordinates of the location where the measurements are taken and temporal timestamps associated with the collected measurements. Spatiotemporal data types can also be categorised based on their collection nature to discrete or continuous observations. Events and data trajectories are examples of spatiotemporal discrete data types, while continuous data types include point reference and raster data. Spatiotemporal event data constitute discrete events that happen at geo-locations and times such as traffic accidents and crime incidents. Figure 1a denotes spatiotemporal events of three different types. Each type is presented in different colour and shape, e.g., red circles are for events of one type and each event is annotated with the its location and time (location in time ). Trajectory data contain sequences of spatiotemporal instances that trace motions of objects in geographical spaces overtimes. Trajectories are usually represented by a series of chronologically ordered points which consist of spatial coordinates and timestamps Zheng (2015). For instance, a vehicle trajectory between two locations is a set of consecutive points of space and time. Figure 1b illustrates trajectories of three coloured objects between locations ( and ) at times ( and ). Point reference data measure continuous spatiotemporal fields at moving spatiotemporal reference sites. For example, spatiotemporal point references can be utilised to measure surface temperature using moving balloons. Figure 1c and d show spatiotemporal point reference data at different locations (black squares) at timestamps ( and ). Raster data represent measurements of spatiotemporal fields at fixed cells in grids such as activities in fMRI brain scans. Figure 1e and f show spatiotemporal raster data of regular grid at time ( and ). These different types of spatiotemporal data are associated with different research challenges Atluri et al. (2018). Classical data mining approaches are not designed to handle such data.
Fig. 1.

Spatiotemporal data types. a spatiotemporal events of different types at different locations and timestamps. b spatiotemporal trajectories between locations ( and ) at time ( and ). (c and d) spatiotemporal point reference data at different locations at timestamps ( and ). (e and f) spatiotemporal raster data of regular grid at time ( and )
This paper consolidates the current state of the challenges associated with the STDM tasks and applications. There have been several survey articles that reviewed work related to STDM, each of which discussed the literature from different perspectives such as spatial databases Koperski et al. (1996), spatial patterns Shekhar et al. (2003), spatiotemporal cluster analysis Kisilevich et al. (2009), urban concepts and applications Zheng et al. (2014), big data analytics Yang et al. (2019a), big climate data analytics Hu et al. (2018), and outliers detection Aggarwal (2017); Meng et al. (2018). Atluri et al. (2018) surveyed STDM methods and techniques according to main spatiotemporal problems of clustering, predictive learning, change detection, frequent pattern mining, anomaly detection, and relationship mining. Pei et al. (2020) reviewed the big geo-data mining objectives and issues in terms of human behaviour and distributions of geographical patterns. The survey by Shekhar et al. (2015) divided prior surveys in the literature into two types; articles with statistical foundations Ester et al. (1997); Koperski et al. (1996); Miller and Han (2009), and others without that Aggarwal (2017); Kisilevich et al. (2009); Shekhar et al. (2003). Wang et al. (2020a) surveyed the utilised deep learning methods in STDM based on the data types, tasks and deep learning models. The authors also presented the utilisation of deep learning methods in various applications. Zheng et al. (2014) surveyed the concepts and applications of urban computing and discussed their computing challenges. The work in Shi and Yeung (2018) presented a review of machine learning methods for STDM sequence forecasting related problem. They focused on moving point cloud, regular grid, and irregular grids. Due to the fast pace of advances in STDM, there is a continuous need for up-to-date surveys. Moreover, to the best of our knowledge, STDM challenges and problems are not thoroughly discussed and presented in articles of their own. Specifically, none of these existing researches paid their focus on the general challenging issues in terms of relationships, data, natures and limitations of STDM research or the challenges related STDM tasks and applications. Our survey attempts to fill this gap providing a comprehensive literature survey on state-of-the-art advances in STDM. Unlike existing survey papers, we review previous works and describe STDM challenges and their causes as well as issues related to selected applications and tasks.
Figure 2 shows a taxonomy of the proposed structure for reviewing the STDM challenges. The taxonomy highlights the survey main sections and their sub-sections. The survey is designed to cover the STDM related challenges from three different perspectives. We start the survey by defining the general challenging issues in terms of relationships, data, natures and limitations of research. Then, we discuss the STDM tasks and applications focusing on their related challenges. Finally, we conclude the survey with a mapping table and a discussion to connect the general challenges with the tasks and applications sections.
Fig. 2.

A taxonomy of the proposed STDM challenges structure. The survey is designed to cover the STDM related challenges from three different perspectives. We propose to investigate the general challenges that affect the STDM in terms of relationships, data, natures and limitations of research. Then, we discuss the STDM tasks and applications focusing on their related challenges
The rest of the paper is organised as follows. The research methodology on how we conducted this survey is presented in Sect. 2. Section 3 discusses general STDM challenges and their causes. Section 4 covers STDM tasks and their related challenges. Section 5 introduces STDM applications and related challenges in them. Section 6 summarises the survey and the integration between the general challenges and STDM related tasks and applications . Section 7 highlights key conclusions and directions for future work.
Survey methodology
We designed our survey to focus on STDM challenges and research problems, as shown in Fig. 2. We built a comprehensive set of STDM challenges, as shown in Fig. 6. This list of challenges is accompanied with their root causes. We started extracting these challenges and causes from existing STDM surveys in addition to our knowledge in the area. We then extended the challenges set in terms of STDM tasks and applications. For example, an STDM previous survey may list several challenges that are relevant to its scope, e.g., STDM visualisation. We add these challenges to our survey by extending their definitions and searching for their related work. The most frequent search keywords are visualised in a word cloud in Fig. 3. We included 342 STDM related work in our survey. These citations are from different publication types, including journal articles, conference proceedings, books, book chapters, and theses. Figure 4 compares between the different ranks and quartiles of the indexed journal articles and conference proceedings. It shows that Q1 journals are the most cited with 48 percent, followed by A* ranked conferences with 29 percent. The ranks and quartiles are calculated at the Scimago Institutions Rankings (SJR)1 and Computing Research & Education (CORE)2 in December 2020. We focused the search process on high ranked journals such as: IEEE Transactions on Big Data, ACM Transactions on Intelligent Systems and Technology, Cartography and Geographic Information Science, IEEE Transactions on Knowledge and Data Engineering, Neurocomputing, and Transactions in GIS. We also covered a set of highly influential conferences such as ACM SIGKDD International Conference on Knowledge Discovery and Data Mining, Proceedings of the IEEE Conference on Computer Vision and Pattern Recognition (CVPR), IEEE International Conference on Data Engineering (ICDE), IEEE Visualization Conference, AAAI Conference on Artificial Intelligence, International Joint Conference on Artificial Intelligence (IJCAI), and international conference on Ubiquitous computing. The majority of the cited papers, 85 percent, are published in the last 10 years. Figure 5 shows the distributions for the citation of each year between 2011 and 2020.
Fig. 6.

Cause-and-effect diagram of STDM general challenges. The figure shows a taxonomy of STDM challenging issues
Fig. 3.
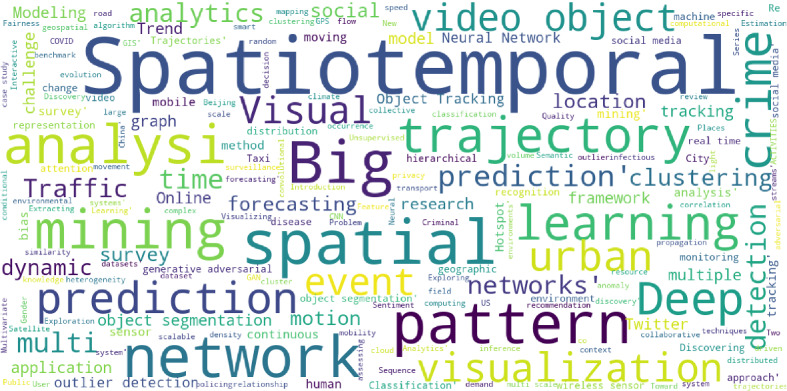
A word-cloud visualisation of the most frequent used search keywords
Fig. 4.
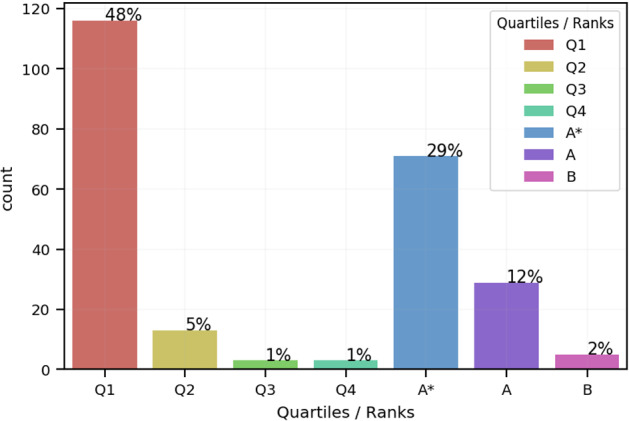
Related work distributions for journal articles and conference proceedings
Fig. 5.
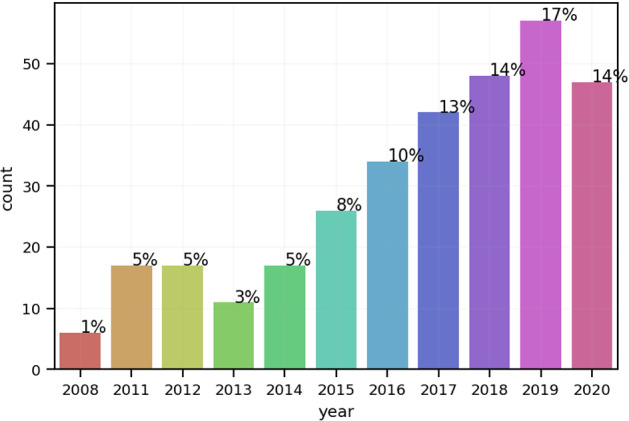
Related work distributions for years from 2011 to 2020
General STDM challenges and research gaps
There are various factors causing difficulties in STDM. We identify and list them as follows:
Spatiotemporal objects relationships that are complex and implicit.
STDM requires interdisciplinary effort and integration of various heterogeneous datasets and multiple data mining algorithms.
Spatiotemporal region discretisation problem caused by the scale and the zoning effects on the data mining results.
Data characteristics such as heterogeneity and dynamicity.
Further Efforts Needed in STDM for data representations, advanced modelling, visualisation, and comprehensiveness.
Figure 6 presents these general challenges using a cause-and-effect diagram while citing related literature that explains further the used terminologies. In the next subsections, each of these challenges is discussed.
Spatiotemporal relationships
Spatiotemporal objects that exist in one area or during the same time and share similar characteristics are often related. Finding relationships between objects is helpful in different tasks such as spatiotemporal hotspot prediction Almanie et al. (2015). However, discovering valuable relationships from spatiotemporal data is more challenging compared to traditional numerical and categorical data because of the complex data characteristics. The next sub-sections describe three of these characteristics of spatiotemporal relationships, namely; complexity, implicitness, and non-identical distributions.
Complexity
The complexity of spatiotemporal relationships poses difficulty to extracting spatiotemporal patterns Shekhar et al. (2015); Shen et al. (2019). Rao et al. (2012) stated that this complexity stems from the fact that spatiotemporal data are discrete representations of what are, in reality, continuous in space and time. For example, traffic sensing devices that are fixed in roads capture data of moving vehicles in certain locations while these vehicles are continuously moving. Moreover, co-located spatiotemporal objects influence each other and hinder the detection of relationships. In other words, the pattern of a moving object might be affected by nearby objects such as a car’s direction, speed and acceleration are influenced by other cars around it.
Implicitness
Non-spatiotemporal data have explicit relationships represented through arithmetic relations, such as ordering, instance-of, subclass-of, and member-of. On the contrary, relationships between spatiotemporal objects are implicit Shekhar et al. (2003). Spatial relationships are built based on qualities or feature such as distance, volume, size and time. These relationships can occur among points, lines, regions or a mixture of them. For instance, Fig. 7 shows that topological relationships between two regions, include, disjoint, overlap, contains, covers, meet, equal, inside and covered-by Egenhofer et al. (1994). A spatiotemporal point can co-locate with another point. A line in a spatiotemporal environment can intersect, overlap, touch or be within another line or spatiotemporal area. For example, in the case of migrant birds, flying birds can be described as a complex network of multiple spatiotemporal lines. The work in La Sorte et al. (2016) analysed a daily temporal resolution for migration trajectories of 118 migratory bird species from 2002 to 2014. In order to address this issue, the spatiotemporal relationships can be transformed into traditional relationships mined using classical data mining methods. However, this process causes information losses which inevitably preclude detecting subtle relationships. For example, in the case of traffic monitoring, using distributed sensing systems capture micro-scale sensing data for the whole sensed area; while using fixed traffic sensors can only collect transaction data for anonymous moving objects’ speed, direction and acceleration. The former represents the actual, but implicit, movement patterns. The latter aggregates the sensing data. This data aggregations leads to loss of data about tracking the relationships between them.
Fig. 7.

Examples of topological relationships between two areas
Non-independent and non-identical distribution
Spatiotemporal data objects have positive autocorrelation or dependency. Nearby things in space and time tend to be related and more similar than distant things. In moving cars, for example, there are many dependent variables such as location, direction, connectivity and temporal attributes Miller and Han (2009). For instance, if there is heavy traffic in an intersection at 4 pm, the chances are that there will be some traffic at 4.01 pm as well. Moreover, opportunity contributes more to the probability that a spatiotemporal pattern to occur Albertetti (2015). For example, crime often occurs when a criminal and a victim are found in the same location and time. This is an autocorrelation as opposed to classical data that are independent and identically distributed. The autocorrelation between spatiotemporal objects degrades the performance of data mining algorithms Chawla et al. (2001). Additionally, measuring the spatiotemporal autocorrelation in large datasets is computationally expensive.
Identifying spatiotemporal distribution characteristics is useful for patterns discovery. It is also important for detecting regularly repeating relationships between spatiotemporal objects Li et al. (2016). Spatiotemporal distribution was discussed in various studies in different domains such as phenology, geology, ecotoxicology, and criminology. Such studies reported that spatiotemporal data tend to have a non-identical distribution across space (spatial heterogeneity) and over time (temporal non-stationarity). A spatiotemporal dataset may have geographical regions and temporal periods with distinguishable distributions Ratcliffe (2002). For example, drivers’ behaviours are varying concerning location and time. Driving seems to be safer in quiet areas and night hours. While it is expected to be dangerous in crowded areas, especially during rush hours. Moreover, spatiotemporal data has skewed distribution in different locations of a city, e.g., a city downtown may have high-volume data than the other suburbs. This issue can affect the performance of STDM tasks.
Interdisciplinary and combined data mining
STDM requires interdisciplinary efforts and ever-expanding knowledge from different domains. For instance, spatiotemporal crime data analysis requires large-scale macro datasets analysis for socio-economy, socio-psychology, culture and demography Feng et al. (2016), and micro-environmental datasets such as interurban structure, distance, density clusters and tactics to crimes Ho et al. (2018). Other factors also have been investigated, such as globalisation and social and demographic change.
Figure 8 shows data sources from different domains need to be combined with crime datasets. This combination enables analyses of crime patterns and criminal behaviors. Dealing with a variety of data from different domains requires integrating multiple data mining techniques such as classification, regression, clustering, and association rules discovery. Using multiple heterogeneous datasets or utilising multiple data mining algorithms is known as combined mining (Albertetti 2015). Shaban et al. (2016); Zheng et al. (2015) proposed hybrid predictive models for air quality prediction combining different predictors, e.g., spatial, temporal, and inflection predictors. Zheng et al. (2015) considers the sudden change in climate as an inflecting predictor. This interdisciplinary nature is a challenging issue that contributes to the complexity of STDM. For example, bird migrations are interrelated to climate, e.g., temperature, humidity and wind; which affects the forest areas and water quantities; which may be removed and replaced by urbanisation caused by economic development.
Fig. 8.
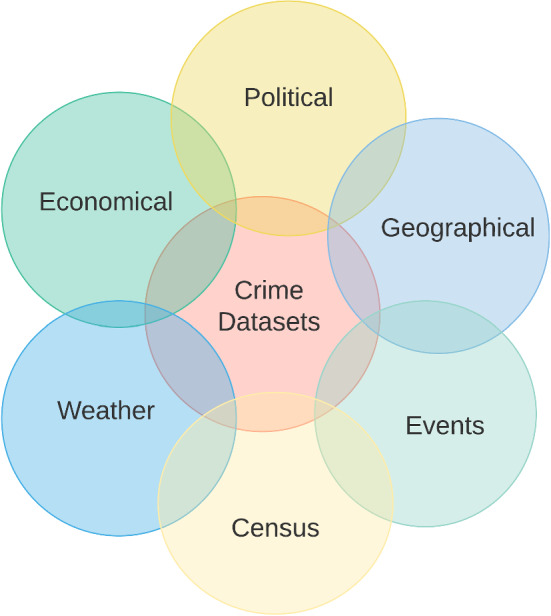
Different sources of data needed for crime analysis
Spatiotemporal region discretization
Before analysing spatiotemporal datasets, spatiotemporal discretisation (or aggregation) is applied. The discretisation is useful to summarise information and help in extracting features within a range rather than measuring a single point Giannotti and Pedreschi (2008). For example, the crime rate cannot be measured for a single spatial point but requires the aggregation of the crimes occurred in wide areal units. Spatiotemporal patterns are scale-dependent. They shape variant clusters at different scales. For example, the crime patterns and rates are affected by the discretisation scale. Spatiotemporal data can be aggregated at different levels or areal units. It is not always easy to define the best level to apply the spatiotemporal region discretisation as the results vary according to the different areal units. This is defined by Openshaw (1983) as Modifiable Areal Unit Problem (MAUP). According to Stewart Fotheringham and Rogerson (1993), MAUP includes the scale effect and the zoning effect. The scale effect would reflect the different statistical measures if the data were aggregated to different scales of areal units. The zoning effect considers the change in the borders of different areal units and their effects on the results. Figure 9 presents the MAUP scaling between a or b and c, and zoning between a and b. Another efficient method is to discretise the region through a regular grid with small size cells Giannotti et al. (2007). The small size is relevant to the region, i.e., the cell size could be a fraction of that region. In Giannotti et al. (2007), each trajectory is used to compute the cell densities. They calculate how many cell points intersect other neighbourhood points in the trajectory. There are many previous works in the literature that studied the effects of spatiotemporal discretization on different applications such as remote sensing (de Sherbinin 2017), physical geography (Linke et al. 2017), traffic safety (Jang et al. 2017), economy (Khoirunurrofik 2017), health (Rigby et al. 2017), crime (Flaxman et al. 2019), and ecology (Shafran-Nathan et al. 2017).
Fig. 9.

Spatial scaling between a or b and c and zoning between a and b. The figure shows the impact of having different scales and zones on the analysis results
Data characteristics
STDM uses spatial, temporal and non-spatiotemporal or thematic data at different levels of granularity Albertetti (2015). This fact introduces various challenging data characteristics including specificity, vagueness, dynamicity, social, networking, heterogeneity, privacy and poor quality. These characteristics are explained in the following subsections.
Specificity
Spatiotemporal data when is used to build a good model for a particular application domain may not be useful in another one. For instance, a model that is built for the bird migrations neither be useful for vehicles movements in a city nor molecular movement in a microscopic level. This challenge is also applicable to different geographical areas having different nature and characteristics. Therefore, spatiotemporal models cannot be generalised as they are designed specifically for certain domains Phillips and Lee (2012).
Vagueness
Spatiotemporal data objects or events have similarities that are important in different STDM tasks such as clustering. However, these similarities have different interpretations stem from different criteria. Two similar events may belong to different classes or be triggered by different patterns. Figure 10 shows an example where trajectories 2 and 3 are similar from the spatial perspective, but after adding some semantic information, they become dissimilar. Because trajectory 2 departs from a train station while trajectory 3 departs from a company. In contrast, trajectory 1 and 2 appear dissimilar in terms of their spatial attributes while both of them start, pass by and end at the same location. This vagueness increases the analysis difficulty and adds further modelling and processing complexity in multiple STDM tasks such as classification, clustering and pattern extraction Shekhar et al. (2015). Therefore, there is an increasing need for more research efforts in STDM semantic annotation and enrichment.
Fig. 10.

Vagueness due to data similarities stem from different criteria. Trajectory 2 and 3 have similar spatial attributes. However, they are semantically different
Dynamicity
Spatiotemporal data require dynamical models to capture the evolution of their distributions or densities. Figure 11a, b and c represent three different time-stamps of moving objects. As can be seen, the distribution of spatiotemporal moving objects is changing over time. This dynamic evolution of the densities can be found in different applications. Arino (2017) described the dynamics of diseases in populations, Toole et al. (2011) discussed the spatiotemporal dynamics of criminal events, and Kang et al. (2011) raised the need to study the spatiotemporal dynamics in the case of brain transcriptome to better understand the neurodevelopment in order to predict brain disorders.
Fig. 11.

Dynamic changing of the spatiotemporal distribution of moving objects
Social
Spatiotemporal social datasets describe societies and people daily lives in different places and eras. Social media platforms contain big data related to human behaviour, traditions and people lifestyles. The social data such as text posts or tweets, images and videos are correlated with the socioeconomic characteristics. Besides, the growth of sensor technologies produces large spatiotemporal data such as check-in and geo-temporal tags. Therefore, spatiotemporal social datasets can be utilised to recognise spatiotemporal patterns in social media data or to predict social trends. Such data can also be used to discover the causes behind new social phenomena. The spatiotemporal analysis of social data is an evolving area. It has different tasks such as density estimation Xu et al. (2012), collaborative filtering for recommender systems Qi et al. (2020); Li et al. (2011) and sentiment analysis Shah et al. (2019). However, recent studies have shown that such models may have biasness and discrimination against different races and genders. Spatiotemporal datasets tend to have bias that affects these models. Buolamwini and Gebru (2018) evaluated bias present in automated facial analysis systems and datasets. They found that the analysed datasets are biased toward lighter-skinned subjects. Specifically, they categorised the gender and skin type of two facial benchmarks, namely Adience and IJB-A, according to their skin-type classification with representations of 86.2% and 79.6% respectivly. They also showed that darker-skinned women are most mis-classified class with 34.7% error rate. There is a need to capture balanced datasets that lead to unbiased systems. Bias was also investigated in employee assessment and hiring algorithms. The work in Raghavan et al. (2020) studied bias in hiring systems. Specifically, they considered bias in data collection and target predictions processes. The study in Gebru et al. (2018) proposed datasheets for datasets. These datasheets are designed to avoid bias in data collection and usages.
Networked
Spatiotemporal data may be captured from moving objects or devices that are connected in space and time, such as GPS-tagged fleet of vehicles or animals. They form different types of networks such as in transportation (Zhou et al. 2017; Han et al. 2015), cellular (Krishnan and Dhillon 2017), wireless sensors (Alipio et al. 2017), and smart cities (Gunturi and Shekhar 2017). Matching the raw trajectory data with road networks makes it easier to mine the trajectory patterns. In such a case, the trajectory mining problem is done sequentially of the sequences the road network edges and stops. However, dealing with networked trajectory data is difficult due to the influence between the data points and trajectories in the network, in addition to the enormous volume of data and the exponential number of expected relationships.
When raw trajectory data, e.g., GPS readings, are matched to the road network, dealing with the resulting data is not always difficult. In the literature, such representation is considered as 1.5-dimensional and finding patterns and clustering this data is more straightforward in some contexts. For example, the problem of trajectory pattern mining could be reduced to the problem of sequential string pattern mining of the sequences of edge ids of the streets.
Heterogeneity and non-stationary
Any environment is often affected by continuous change through space and time. Spatiotemporal data show variation in measurements and relationships due to the influences of this continuous change. For example, trajectories and behaviour of road users of a city can vary over space and time. Hence, trajectories vary for cold days compared to sunny days. This variation is known as spatial heterogeneity and temporal non-stationarity (Shekhar et al. 2015). Thus, most of the spatiotemporal data tend to have an intrinsic degree of uniqueness that may cause inconsistencies between a global model and regional models. Consequently, this heterogeneity requires building different mining models for varying spatiotemporal regions. Otherwise, a global model built from a spatiotemporal dataset may not describe well the observed data for a specific space and particular time (Miller and Han 2009). Therefore, finding the best parameters to build local models is a crucial challenge. The heterogeneity is a challenging issue that must be considered when analysing spatiotemporal data in many application domains – for instance, heterogeneity of socioeconomic observations across regions throughout social network analysis (Yu and Liu 2017).
Limited access and privacy
Mining spatiotemporal data is often restricted by limited access due to privacy issues. Spatiotemporal datasets may contain information about public behaviours and norms. Service providers can mine these personal data and discover patterns and trends Giannotti and Pedreschi (2008); Lakhdari and Bouguettaya (2020), which may reveal sensitive information. For example, spatiotemporal trajectories include important data about people movements, vehicles and mobile calls. Therefore, there is a concern with the side effects of STDM on privacy. The research on privacy-preserving STDM focuses on individuals’ and personal data privacy and corporate privacy for governments and organisations. There are different approaches to protect the privacy of the data, such as suppression of the identities of individuals, perturbation through adding noise or randomising the original data, data sanitisation, i.e., adding fake records. These methods aim to swap, modify or delete some aspect to protect the data Lin (2020); Lin et al. (2016). In this regard, researchers face a double-edged issue, i.e., to protect privacy vs. achieving accurate analysis.
Poor quality
The quality of spatiotemporal data directly affects the results of the analyses. Consequently, it is important to ensure high-quality data before analysing it. This data quality assurance may not be easy to achieve when utilising interdisciplinary data that may be fragmented and distorted in disordered environments. Causes of such poor quality are uncertainties, partial knowledge, and conjectures Albertetti (2015). For example, STDM on bird migrations, at all times and for all locations, requires climate, water, forests data that are uncertain, sparse and reflect non-measurable aspects. Monitoring the physical world is affected by errors and noise that may be caused by faulty or obstructed sensors Zhang et al. (2010). These errors and noise are to be corrected in order not to affect the STDM tasks Tan et al. (2006).
Big data and cloud computing
Spatiotemporal data always exist in large volumes. These large volumes are being generated by 3.8 billion people and 8.06 billion devices which are connected to the Internet Khan et al. (2018). Villars et al. (2011) reported 1ZB of data was created in 2010 and rose to 7ZB in 2014. This fast generation of large spatiotemporal data creates various challenges to overcome including volume, variety, and velocity. Spatiotemporal big data volume refers to the huge size that causes significant challenges in terms of storage and processing Elgendy and Elragal (2014). The data volume is growing faster than the computational processing systems Chen and Zhang (2014). In terms of velocity, spatiotemporal data in most applications are continuous streams of data. As such, they require expensive computational cost for processing Salehian and Yan (2016). These challenging characteristics of big data cause multiple issues to various STDM and applications. Shao et al. (2016) tackled the issue of clustering big spatiotemporal interval data, e.g., large parking data. They evaluated spatiotemporal-intervals clusters based on the similarity and balance between them. Rahaman et al. (2018) tackled the heterogeneity issue at a large number of contextual features. They proposed a model for predicting taxi-driver wait-time at airports. Shao et al. (2019) utilised a big GPS data of aircraft at the airport. They proposed a framework to cluster the aircraft trajectories incrementally based on such data. Ren et al. (2018) developed a location query browse method utilising a large WiFi data of indoor physical and web activities. Such large and varied data have a spatiotemporal dependency and contextual influence on people’s information and physical behaviour.
Cloud computing has emerged to provide support to STDM to tackle different challenges in data management, storage, processing, analytics, and visualisation. Cloud computing offers large amounts of resources that enable fast, and accurate STDM. STDM computational problems are solved using new cloud technologies such as Hadoop, MapReduce, and Spark, on distributed storage systems. However, distributed frameworks suffer from many limitations in terms of data sharing, processing scalability, and interactive performance Li et al. (2020). Besides, existing cloud solutions have limited support to the visualisation of the GIS big data Wang et al. (2018a). Specifically, conventional cloud computing techniques are not designed to handle the spatiotemporal data. Therefore, spacial cloud computing techniques have recently been proposed to leverage a layer of data-as-a-service (DaaS) to virtualise the spatiotemporal data Yang et al. (2011). The advancements of the GIS harnessed the wide availability of the cloud-based spatiotemporal services Qingquan and Deren (2014). Spatiotemporal data storage and parallel processing are widely provided by open-source cloud systems Yao et al. (2018). Other technologies such as Esri Geospatial Cloud and Google Earth Engine are also providing significant Earth observations spatiotemporal data. Overall, spatial cloud computing aims to solve spatiotemporal issues related to storage and processing. It also tends to offer better spatiotemporal data utilisation through the “as-a-service” paradigm. However, there is a difficulty in representing physical spatiotemporal phenomena that are continuous via the classical discrete based cloud approaches. This issue stems from the heterogeneity, dynamic scalability, and complex distributions of the spatiotemporal data.
The issues of big data and cloud computing are discussed in different surveys in the literature such as big spatiotemporal data analytics Yang et al. (2019a), social media big data analytics (Ghani et al. 2019), deep learning for big data (Zhang et al. 2018), and big environment data (Sun and Scanlon 2019).
Open problems in STDM research
There exists a wealth of research in data mining, most of which, however, focus on extracting knowledge from non-spatiotemporal data. Applying classical data mining techniques on spatiotemporal data often produces poor results Shekhar et al. (2015); Wachowicz et al. (2008). Classical data mining focuses on groups of items that satisfy some rules, e.g., if events are happening together. STDM often analyses events ordered by one or more dimensions and focuses on the discovery of relationships between these ordered events, which adds more complexity to the spatiotemporal analysis. STDM deserves further research efforts to address the identified challenges and to improve the analysis methods and tools. In particular, STDM requires efforts to develop advanced data representations, modelling, visualisation, comprehensive STDM approaches, and Fairness, Accountability, Transparency, and Ethics (FATE).
Data representations
Spatiotemporal data representation is an open research problem Thakkar et al. (2016). There are multiple well-established spatial methods for both object-based and field-based data representation, including vector, raster data structures, spatial joins and indexing, and topological operators. These spatial data representation methods are supported in most of existing Geographical Information Systems (GIS) and spatial database systems. Their focus has been on the evolution of objects and fields over time in regards to discrete changes in object evolution and movement. However, this is not enough to cover spatiotemporal events and relationships Santos et al. (2016). The need for new methods to represent the spatiotemporal events and relationships is important due to its impact on STDM modelling Dunkel et al. (2019). Recent advances in deep learning have introduced spatially-structured networks such as graph convolutional networks Hamdi et al. (2020a) and recurrent neural networks Rahaman et al. (2020).
Advanced modelling
One important research direction in STDM is to develop new techniques for modelling the spatiotemporal data. For instance, noticeably, most existing hotspot detection methods produce poor results when they depend only on high-density locations while ignoring the temporally related attributes, e.g., occurrence date and time, of the clustered objects. Neglecting the temporal aspects when analysing and building models from spatiotemporal data and focusing only on spatial attributes leads to unfavourable outcomes. Despite the large volume of work in GIS, there is a little support of temporal data mining in popular GIS Roth et al. (2013). The temporal pattern discovery remains an under-explored area Nguyen et al. (2017). Spatiotemporal pattern extraction methods are not able to accurately predict a pattern that may happen in a specific time because of disregarding the location and time-stamp together Almanie et al. (2015). Fusco et al. (2016) proposed a hybrid model combining a Bayesian network and a neural network to predict car speeds. The spatial and temporal correlation among the traffic variables led to better results. Moreover, the thematic attributes are important to discover hidden knowledge in the spatiotemporal data. Du et al. (2016) improved accuracy of visual clustering by considering both the temporal and thematic information with spatial information in their spatiotemporal data. Besides, modelling real-time spatiotemporal data is challenging when they are sporadically observed. This issue means that the spatiotemporal sampling is irregular such as in clinical patient time-series data. The work in De Brouwer et al. (2019) proposed a continuous-time Gated Recurrent Unit based on the Neural Ordinary Differential Equations Chen et al.(2018) and a Bayesian update network. The proposed methodology encodes the continuity and dynamics of the sporadic multidimensional observations. Capturing both global and local patterns is an essential objective of STDM modelling. DeepGLO Sen et al. (2019) is proposed as a deep forecasting method to think globally and act locally. It combines a global matrix factorisation with local temporal features. Also, temporal information is useful in flow-estimation for applications such as video restoration. Existing methods mostly fails to capture long-range temporal features. Establishing spatiotemporal dependencies is challenging as well. Spatiotemporal Transformer Network process multiple frames at once to solve the occlusion issues in estimating the optical flow Kim et al. (2018). Generative Adversarial Networks (GAN) have also utilised for spatiotemporal modelling, simulation and data generation (Gao et al. 2020). GANs are used to process different data types such as trajectories (Liu et al. 2020; Wang et al. 2020b), events (Li et al. 2019; Yu et al. 2020), time series (Zhao et al. 2020; Golany et al. 2020) and spatiotemporal graphs (Gao et al. 2019).
Visualisation
Visualisations in data analysis are important for the decision-making as they visually summarise and present results in digestible and easy to understand forms. Thus, it is useful to develop new approaches tailored to visualising the dynamic spatiotemporal data and the analyses results. GIS applications and current research work still focus on developing techniques for spatial visualisation, while less consideration is given to spatiotemporal (Ye et al. 2012). This gap requires more efforts to develop effective methods that can produce realistic, smoothing and dynamic visualisation. Recently, online news sources have produced large amounts of text data. One major issue in such data is visualising spatio-textual, and spatiotemporal online news trends (Kastner and Samet 2020). STDM methods can also be employed to visualise 3D active motions. The work in (Sakaue and Sato 2020) proposed to project high-frequency patterns on moving objects to visualise their 3D motion. Inspired by the human visual system, their method integrates light rays over time. Besides, spatiotemporal visualisation methods are essential to observe and analyse urban activities and behaviours. The authors in (Rizwan et al. 2020) visualised the spatiotemporal and directional trends in urban activities. They examined both city and district levels using location-based social data. The work in (Salcedo-Gonzalez et al. 2020) Spatiotemporal geo-visualisation method for dynamic data of the criminal activity. Data-driven approaches have recently been developed to estimate and visualise deficiencies in medical resources during the COVID-19 pandemic (Sha et al. 2020).
Comprehensive approaches
The nature of STDM necessitates the development of comprehensive and integrated spatiotemporal models. For example, to detect spatiotemporal crime hotspots, some other spatiotemporal tasks may be needed, such as clustering and outliers detection. Existing STDM approaches often focus on certain problems, and they do not introduce comprehensive spatiotemporal solutions (Ndehedehe et al. 2016). Future work in STDM ought to consider the interplay among different data types and various domains.
Fairness, accountability, transparency, and ethics (FATE)
The attention around societal concerns of fairness, accountability, transparency, and ethics in machine learning and data mining has seen a noticeable increase recently. These concerns include amplifying genders, denying people services, and racial biases Dudík et al. (2020). Web search engines results might be biased or offensive when, for example, they contain misbeliefs or posting undesirable behaviours Olteanu et al. (2020). Retrieving the right information that are considered fair in both spatial and temporal dimensions is not an easy task as what is considered an offensive to a specific group may change over location and time. Buolamwini and Gebru (2018) evaluated bias present in automated facial analysis systems and datasets. They found that the analysed datasets are biased toward lighter-skinned subjects. The work in Raghavan et al. (2020) reported that bias exists in employee-hiring systems. The work in Blodgett et al. (2020) studied bias in Natural Language Processing systems, and found that existing methods are inferior when it comes to mitigating bias. People with disabilities (PWD) such as hearing impairments are directly impacted by automated systems like speech recognition systems. Guo et al. (2019) states that such systems “may not work properly for PWD, or worse, may actively discriminate against them.” Microsoft has released Fairlearn3 Bird et al. (2020), a toolkit to help data scientists and developers mitigate fairness-related issues. Later in this paper, we discuss different FATE related studies in multiple sections such as in STDM predictive modelling, public safety, mobility, environment, and Smart IoT applications.
STDM task-related challenges
STDM has different tasks, such as prediction, clustering, hotspot detection, pattern discovery, outlier analysis, visualisation, and visual analytics. These tasks are important in different applications such as understanding the behaviour of moving objects like people, birds, animals and vehicles Huang et al. (2008). The next sub-sections explain the challenging issues related to these STDM tasks.
Spatiotemporal prediction
Data mining predictive models aim to predict target variables based on learning from annotated features of observations. These models can be either classification models or regression models. Classification models are for categorical or discrete targets, and regression models are for continuous targets. In STDM, the prediction task formulations are based on the input and output of spatiotemporal data representations. For examples, predicting an output variable, continuous or categorical, using time series at different locations in raster Jia et al. (2017), predicting a scalar output using the complete information in raster data Yu et al. (2015), or predicting spatiotemporal responses using observations collected at other time-stamps in spatial neighbourhoods Khandelwal et al. (2017). STDM prediction methods use extracted discriminative features, e.g., average speed, acceleration, duration, distance, length and direction, from labelled spatiotemporal data to train standard classifiers or regressors. The prediction can be done by single models e.g., Decision Trees (DT) Kim et al. (2015), Support Vector Machines (SVMs) (Aasha et al. 2016), or ensembles, e.g., Random Forest (RF) (Phan et al. 2015) or deep learning, e.g., Convolutional Neural Network (CNN), Recurrent Neural Network (RNN) Liu et al. (2017); Li et al. (2018a); Pandey and Kulhari (2018); Zhang et al. (2018). Other STDM tasks such as clustering can be applied to extract features for prediction. For instance, TraClass (Lee et al. 2008) applied segmentation and clustering for the region and sub-trajectory feature extraction, then trained an SVM classification model. STDM trajectory-based prediction estimates the future location or route of moving objects using different methods such as the Hidden Markov Model (HMM). Predictive models predict the next location of a trajectory to build more accurate decisions and deliver more precise recommendations. There are two different approaches proposed based on the moving object or other neighbours, as well as a hybrid approach that combines both Ying et al. (2011). Recently, deep learning-based models have been applied to tackle various spatiotemporal prediction problems, e.g., crowd flow, car-hailing supply-demand, and traffic predictions Ermagun and Levinson (2018). Here, the models take into account temporal instances, near and far spatial dependencies, and other influential external factors for the spatiotemporal prediction problem. Sadri et al. (2018) tackled another problem of predicting continuous trajectory, not only a single future location. Based on a user’s morning trajectory, their model can predict the whole-day trajectory of the user. The spatiotemporal dependencies between multiple contexts cause an imbalance problem as one spatiotemporal event can be rare or infrequent compared to other Rahaman et al. (2017). This data imbalance problem affects the accuracy of the STDM prediction task. The multi-scale effect or the spatiotemporal discretisation issue also poses another challenge as the results of the spatiotemporal classification or regression vary based on the different scales and zones. In order to train a prediction model, spatiotemporal features must be generated using data aggregation. However, the aggregation process can be challenging in building multiple relationships between spatiotemporal objects to build the feature sets. Moreover, the process of generating spatiotemporal features is resource and time-consuming. Spatiotemporal Kriging is an important geo-statistical regression-based interpolation method with a spatiotemporal covariance matrix and variograms. Simply, it can predict the target values at unobserved locations based on observations at other locations, even with noisy data. However, Kriging suffers from the limitation of assuming the isotopic nature of the random variables Shekhar et al. (2015). Recently, multiple deep learning-based studies focused on the spatiotemporal trajectory classification, such as using Long Short Ten Memory (LSTM) networks for sequence classification. However, these approaches fail to consider both spatial and temporal information simultaneously. For example, Time-LSTM handles trajectories’ temporal information and neglects the spatial ones Liu et al. (2019). Explanation of the spatiotemporal predictions is another issue of concern. Most existing prediction models are mostly black boxes and, in many decision making applications such as medical diagnosis, understanding of the reasoning behind the predictions are required. The authors in Ribeiro et al. (2016) proposed LIME (Local Interpretable Model-agnostic Explainations), a method that explains model predictions by learning an interpretable model locally around the predictions. Figure 12 shows the process of explaining model predictions by using different symptoms to predict that a patient has a flu. The proposed algorithm tend to identify which symptoms contribute to the model predictions. For example, sneeze and headache led to the flu prediction while ’no fatigue’ is not relevant.
Fig. 12.

An example of explaining a model prediction of flue based on different symptoms, from LIME Ribeiro et al. (2016)
Spatiotemporal clustering and hotspot detection
In contrast with classification, clustering partitions a set of spatiotemporal objects into similar groups based on their characteristics without having labelled datasets. STDM clustering methods aim to determine the cluster of a given object based on different features, including spatiotemporal ones. For example, trajectory clustering may harness the similarities using features such as route origins and destinations. There are different approaches used in STDM clustering such as partitioning, hierarchical and density-based. Many statistical models are also used such as HMM, spatiotemporal extensions of the density-based spatial clustering of data with noise (ST-DBSCAN), and time-focused clustering of trajectories of moving objects (T-OPTICS) (Kisilevich et al. 2009). TraClus (Lee et al. 2007) algorithm works on parts of trajectories in order to define similar trajectories based on visiting the same type of places. Clustering spatiotemporal data is affected by the large size of data which leads to a trade-off between the accurate clustering results and computational cost (Jiang and Shekhar 2017). It is also affected by noise and outlier patterns. Also, shapes and sizes of patterns add more complexity to spatiotemporal clustering. Spatiotemporal clustering differs according to the data types, such as clustering locations based on thematic attributes over time, clustering moving objects and clustering trajectories. Since a trajectory is a sequence of time-stamped point locations of a moving entity through space, clustering moving trajectories is complex due to their continuous object movement and evolving. Thus, more efforts are needed to discover the interaction and change in the spatiotemporal trajectory movements in order to achieve more accurate clustering (Huang et al. 2008). Such efforts may propose modifications of existing clustering algorithms to make them more suitable for spatiotemporal data (Birant and Kut 2007). Another open issue related to spatiotemporal clustering approaches is related to their evaluation techniques. While traditional clustering approaches require computations in single Euclidean space, the spatiotemporal clustering approaches need computations in multiple spaces (Shao et al. 2016). Besides, computing the trajectory similarity based on point matching results in low-accuracy results (Li et al. 2018c). Specifically, such methods handle two different point-sequences in a different way albeit they belong to the same trajectory.
On the other hand, spatiotemporal hotspots refer to locations that contain an unexpectedly high number of objects in a time (Di Martino et al. 2017). The spatiotemporal hotspot detection is complex because the number and features, e.g., size, shape and number of objects, of hotspots are unknown. STDM hotspot detection task is utilised for identifying dense conglomeration of events both in space and time in applications such as the outbreaks of diseases (Bulstra et al. 2018; Feng et al. 2015). Kulldorff (1997) proposed a spatial scan statistical (SSS) method for hotspot detection. The method explores the potential region of multiple circular-shaped sizes. The hotspot is defined as the region with a significantly high incidence of points. Later, multiple methods were proposed to generalise this SSS for spatiotemporal data (Cheng and Wicks 2014). However, the problem is still complex as results of shapes of regions, background distributions, and speeds of search. STDM hotspot detection is also utilised in various applications such as public emotion analysis, public safety, and traffic management. Zhu and Newsam (2016) proposed a hotspot detection method for the analysis of public sentiment using geotagged photos. The proposed method detects the emerging concentrations of certain sentiment class. Mack and Kam (2018) proposed a hotspot detection for political violence. The proposed method tries to solve the problem of uncertain and less predictable violence against civilians. STDM hotspot detection is employed to explore the potential locations and times of traffic accidents. Romano and Jiang (2017) proposed a spatiotemporal network kernel density estimation. Using the STDM hotspot detection methods such as scan statistics and kernel density estimation are not useful in such traffic accidents cases. This is because these methods focus on Euclidean space and ignore traffic-related aspects such as constrained road networks (Romano and Jiang 2017). Research studies were proposed to detect hotspots in the network space such as linear route detection which focuses on the spatial aspect and neglects the temporal dimension.
Spatiotemporal pattern mining
Spatiotemporal patterns represent the details of frequent behaviors in space and time. STDM pattern mining works on discovering hidden information, i.e., occurrences in space and time, such as movement patterns from trajectories of spatiotemporal objects. Multiple methods were proposed to mine several types of movement patterns including; periodic or repetitive patterns that concern regular movements which are repeated at certain time intervals such as bird migration (Zhang et al. 2018), and frequent pattern mining to discover the sequence of visited locations and the transition times between them (Helmi and Banaei-Kashani 2017). Trajectory pattern (T-pattern) is an example of frequent pattern defined by Giannotti et al. (2007) as a set of trajectories that visit the same sequence of places consuming similar transition time. T-pattern can be mined by analysing sequences of regions of interest with time-stamps (Beernaerts et al. 2020) or discretisation of space to determine the regions of interest (Giannotti et al. 2007). Group pattern mining tends to identify movement patterns for groups of objects that move together in near space and time. Several group patterns were proposed based on spatiotemporal closeness constraint, group construction and members’ properties. Examples of group patterns include flock (Wachowicz et al. 2011), convoy (Yadamjav et al. 2019), swarm (Shuai et al. 2019), leadership (Amornbunchornvej and Berger-Wolf 2019) and chasing (de Lucca Siqueira and Bogorny 2011). They were also studied as mixed-drove or co-occurrences (Wang et al. 2019b; Celik et al. 2008) for time-unordered patterns, spatiotemporal cascades (Mohan et al. 2012) for partially time-ordered patterns, and spatiotemporal sequential patterns (Maciąg et al. 2019) for totally time-ordered patterns. Mining of spatiotemporal pattern mining has key challenges. One major challenge is that there are no explicit transactions in the spatiotemporal datasets. The number of possible patterns is exponential, and there is a potential for over-counting. Accordingly, these issues lead to a trade-off between the accuracy of the output and computational efficiency. There are different statistical methods used for mining the spatiotemporal co-location patterns, such as cross-K-function, spatial regression model (Chou 1997) and mean nearest neighbour distance (Sinclair 1985). However, these statistical methods are computationally expensive due to the exponential number of candidate patterns. Furthermore, discovering spatiotemporal association or co-occurrences from trajectories is challenging due to temporal duration, different moving directions, and wrong locations.
Spatiotemporal outlier detection
In contrast to pattern mining, STDM outlier detection aims to find unusual patterns that do not follow the common path, using a set of whole trajectories (Zhang et al. 2011) or parts of trajectories (Liu et al. 2012). Like prediction, STDM outlier detection methods usually come after other data mining methods; especially clustering to discover objects that are not similar to any cluster. STDM classification has also been used for outlier detection based on predefined features, e.g., location, speed, angle and direction, and utilising various distance measures (Yuan et al. 2011). Spatiotemporal outlier detection aims to discover spatiotemporal objects that are discontinuous or inconsistent with their space and time neighborhoods. Discontinuity means that the thematic or non-spatiotemporal attributes of the outlier objects significantly deviate from other observations (Rao et al. 2012). Outlier detection depends on different statistical methods which are affected by several challenging issues related to model generalisation and scalability, lack of effective spatiotemporal data representation methods, and low focus on interpretability. Although the mathematical and statistical foundation of spatiotemporal outlier detection is important, most previous researches focus only on the computation efficiency and intuitive analysis (Aggarwal 2017). Additionally, spatiotemporal outliers can be important and refer to interesting events, e.g., the formation of cyclones, or they can be noise Thakkar et al. (2016).
A new research trend in outlier detection is multi-view outlier detection, i.e., a multi-view learning task. This task is challenging due to the complex distributions of data across different views. It focuses on three outlier types, including attributes, class, and class-attributes outliers. There is a need to accomplish such multi-view outlier detection because most existing approaches consider part of the problem (Ji et al. 2019). Figure 13 illustrates the three different types of outliers. The attribute outlier, red triangle, is an example of abnormal behaviour. The class outlier, blue circle, behaves normally in each view but abnormal across different views. The class-attribute outlier, green square, represents an attribute outlier in some views and class outlier in other views.
Fig. 13.

Three different types of outliers Ji et al. (2019)
Spatiotemporal visualisation
Spatiotemporal visualisation task employs techniques for spatiotemporal data presentation. These techniques go beyond static or traditional 2D maps to include modern 3D spatiotemporal cubes and interaction methods to uncover the implicit spatiotemporal knowledge. Spatiotemporal visualisation is discussed within various applications such as marine environment (Yawen et al. 2010), news events (Bo et al. 2011), social topics (Koylu 2019), urban dynamics evaluation (Xia et al. 2020; Calabrese et al. 2011) and mobile data (Kobayashi and Miller 2014). Despite much previous work on spatiotemporal visualisation, there are still unsolved issues such as visualising big spatiotemporal data in real-time (Cheng et al. 2014). The challenge stems from the difficulty of temporal representation on maps because of the limitation of GIS in representing dynamic processes. This issue is further exacerbated by the fact that most geographic phenomena vary over time. There are many proposed methods based on 2D maps, such as showing small charts on maps (Reza and Watson 2019). However, this cause issues such as overcrowded maps when plotting many charts, and overlapped charts with close locations. Moreover, 3D space-time cubes also pose additional challenges. For example, it is difficult to represent space-time paths to geo-locations and time due to the 3D display, as well as the difficulty to display big spatiotemporal datasets.
Spatiotemporal visual analytics
STDM task of visual analytics considers identifying significant locations and periods along with movements such as a bus route Mazimpaka and Timpf (2016). STDM visual analytics methods harness the effect of significant spatial features during certain temporal periods. The selected discriminative spatiotemporal features are used to classify locations overtime periods. There are multiple applications in which knowing such locations and periods is crucial such as in traffic management and route planning. The visual analytics of public transportation has received less research focus in comparison to taxis or private cars Mazimpaka and Timpf (2016). STDM visual analytics methods were proposed in multiple research works such as in (Doraiswamy et al. 2018; Lv et al. 2012; Bhattacharya et al. 2012). However, these studies focused on spatial analysis and neglected the temporal dimension. A major challenging issue in STDM visual analytics is to visualise both spatial and temporal information at the same time. Multiple methods were proposed to solve this STDM visual analytics problem such as space-time cube Tominski et al. (2012) and multiple 2D maps Wang and Yuan (2014). However, most of the proposed methods focus on discovering global patterns between origin and destination. There is a need to discover local patterns at stops and segment levels.
Computer vision related STDM tasks
Computer vision research aims to extract useful information for images. It focuses on learning how to see a scene, understand components, and track moving objects in a video. The complexity of the visual world makes STDM challenging in computer vision tasks. Spatial visual feature extraction is essential in various tasks such as image classification and hand writing recognition (Al-Nuzaili et al. 2017, 2018). STDM methods has been utilised most computer vision tasks such as tracking Huang and Zhou (2019); Wen et al. (2019); Yin et al. (2019); Bai et al. (2019) and segmentation Xu et al. (2019a, b); Wang et al. (2019a); Hu et al. (2019a). In this section, we focus on recent challenges in visual tracking and segmentation, specifically, drone-based object tracking and amodal semantic segmentation, respectively.
Visual object tracking (VOT) is a key component of multiple domain application such as surveillance, search and rescue, and topographic mapping. VOT is a challenging task due to visual noise, occlusion, cluttered backgrounds, and dynamic variation of moving object features. VOT methods aim to track the moving objects temporally in a video and spatially over the frame pixels. There are large bodies of research in both single VOT Follmann et al. (2018); Kart et al. (2019) and multiple VOT Tang et al. (2017); Zhou et al. (2018). New VOT tasks include object tracking with segmentation Follmann et al. (2018), tracking by reconstruction Kart et al. (2019), graph convolutional tracking (Gao et al. 2019), deep multi-scale spatial-temporal tracking Zhang et al. (2020) and drone-based VOT (Yu et al. 2020). In drone-based object tracking Hamdi et al. (2020b), a drone d is tracking a moving object in real-time o using a camera as illustrated in Figure 14. Unlike conventional object tracking using fixed cameras, a camera mounted on d is moving according to the motion of d. When d or o moves the distance between them is altered. This fact leads to changes in the location and scale of o in the video frame. Figure 14 shows three different tracking positions of a drone in different time-stamps monitoring a moving object indicated in light green. As illustrated, the scale of the moving object is inversely related to the size of the drone’s field of view. When the drone flies high and has a wide field of view, the object becomes smaller. Conversely, the object scale is enlarged if the drone gets close. New VOT drone-based dataset have been released such as DTB70 Li and Yeung (2017), UAV123 Mueller et al. (2016), UAVDT-Benchmark-S Du et al. (2018), and VisDrone2019-SOT Zhu et al. (2018). The datasets are of high diversity and captured in multiple environments. They cover more difficulties and aspects that are not found in the traditional tracking datasets such as VOT Kristan et al. (2015) and VTB50 (Wu et al. 2013). The drone-captured datasets include both translation and rotation camera motions. The literature shows that these datasets are challenging for conventional tracking algorithms. They also cover highly challenging cases in both short-term and long-term occlusion. The datasets contain different moving object types, such as humans, animals, cars, boats, birds and drones. This variety offers different levels of degree of freedom for the motion. Objects like cars and boats can only translate or rotate, whereas humans and animals, birds and drones have a higher degree of freedom. The datasets outdoor scenes are in various situations, including significantly varied backgrounds. These challenging motion characteristics cause object deformation, leading to more difficult object tracking.
Fig. 14.
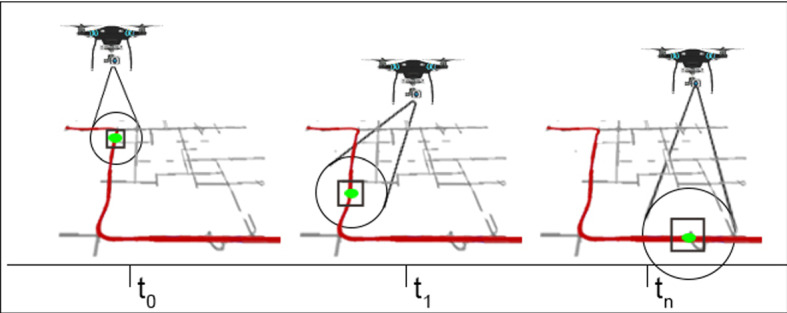
Drone-based object tracking (Hamdi et al. 2020b)
Video object segmentation (VOS) extracts foreground objects in a video. VOS is a fundamental task for many video analysis tasks such as video summarisation and understanding. Most of VOS related work is either unsupervised, i.e., does not require human annotation Tokmakov et al. (2017); Li et al. (2018b); Hu et al. (2018b) or semi-supervised, i.e., requires to annotate object in the first frame only (Cheng et al. 2018; Ci et al. 2018). VOS maintain the temporal associations of object segments through the video usually using optical flow Bao et al. (2018); Hu et al. (2018a). It aims to model the pixel motion over time. However, optical flow annotation requires expensive human efforts and is not always suitable for VOS. Recently, VOS researcher proposed end-to-end trained deep neural networks to overcome such issues, such as spatiotemporal sequence-to-sequence network Xu et al. (2018) and deep recurrent network Li and Change Loy /(2018). There are multiple datasets for video object segmentation such as DAVIS16 Perazzi et al. (2016), FBMS Ochs et al. (2013), JumpCut Fan et al. (2015), Youtube-Objects (Prest et al. 2012), SegtrackV1 (Tsai et al. 2012), and instance segmentation data such as Youtube-VOS Xu et al. (2018), SegtrackV2 Li et al. (2013), and DAVIS17 Pont-Tuset et al. (2017). However, none of these datasets offers direct learning of new research directions in VOS such as Semantic Amodal instance level (SAVOS) (Hu et al. 2019b). SAVOS aims to segment individual objects in a video under occlusion semantically. Figure 15 presents an example showing the steps of segments annotation, depth and visible edge estimation, and annotating the edges of the invisible regions. SAVOS is a useful task for object size prediction, depth ordering, and occlusion reasoning. This task requires the temporal sequence, in the video dataset, to be densely and semantically labelled. Such data should be essential to analyse the object and human motion behaviours. New datasets have been released recently to fit the SAVOS task such as Maire et al. (2013); Zhu et al. (2017); Ehsani et al. (2018); Follmann et al. (2018). Human is able to predict the occluded parts with confidence and consistency (Zhu et al. (2017). However, this task is still a challenging task in STDM.
Fig. 15.
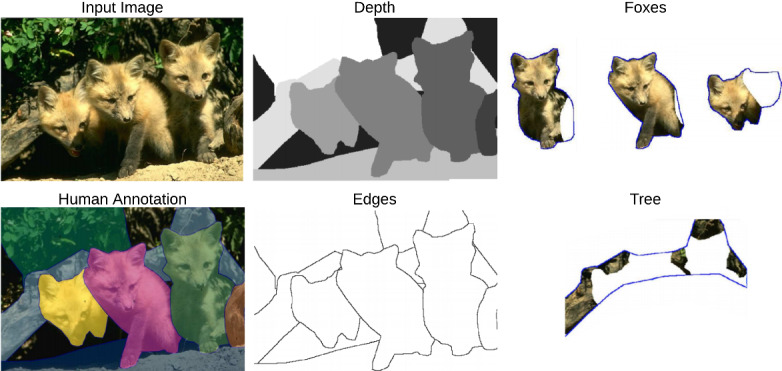
An example of semantic amodal visual object segmentation Zhu et al. (2017). The first row shows the original scene and its segments human-annotation. The second row visualises the depth and visible edges. Finally, the third one shows the semantic annotation of the invisible regions
STDM application-related challenges
In addition to the earlier above-mentioned spatiotemporal challenging issues, this section describes application-related issues. The following sub-sections discuss six major STDM applications including, crime and public safety, traffic and transportation, earth and environment, epidemiology and spread of infectious diseases, social media analysis and smart Internet of things (IoT).
Crime and public safety
Crime data varies and have interesting characteristics that motivated previous works. However, the domain of public safety has its challenges such as the lack of comprehensive and generalised analysis methods that can handle complex and heterogeneous data types such as historical, geographical and demo-graphical data. Furthermore, there is a lack of systematic analysis and representation of the temporal crime attributes, as well as the unavailability of systematic literature reviews Leong and Sung (2015). In addition, the dynamic nature of the crime patterns is affected by opportunities and the existence of motivated offenders and suitable targets Ratcliffe (2002). Hence, many researchers focus on deriving features from human activities to tackle the problem of crime event prediction. Some studies use mobile network data to derive human dynamics and aggregate them with other factors, such as demographics, to predict crime events. Other works analyse social media, e.g., Twitter and Foursquare, data for crime prediction Wang et al. (2016). However, they often utilise aggregated datasets over long periods. This challenge raises the need to develop quantitative methods that work on high-resolution data Toole et al. (2011). Moreover, the new methods need to consider characteristics that are specific to spatiotemporal crime data such as the susceptibility of having outliers and noise. Recent literature in crime analysis utilises the spatial correlation in fine-grained crime modelling. The continuous conditional random field is used to capture the relationships among different regions. However, it can not deal with dense graphs considering the potentially large amount of nodes and relations in a graph of a fine-grained level. Deep neural networks are utilised to reduce the model complexity and improve the training accuracy Yi et al. (2019). Crime prediction models try to answer the questions of where and when the next crime may occur. However, as discussed earlier, such models may be biased toward genders or races. Racial bias in predictive policing is a cumbersome issue. Multiple (non)-governmental organisations are concerned about bias in low enforcement applications and fear that predictive methods may target minority communities. There are studies that show the existence of the racial bias in different public safety applications such as pedestrian stops Legewie (2016), racial profiling of vehicles (Horrace and Rohlin 2016), use of force Ferguson (2019), and drug enforcement and arrests (Lynch et al. 2013). The work in Richardson et al. (2019) investigated the existence of racial bias in predictive policing. The work studied the link between illegal bias in police practice and dirty data that are used to train predictive models.
Traffic and transportation
Unlike the public safety domain, previous works in traffic and transportation focus on disaggregated micro-scale data capturing a large number of observations. Thus, dealing with such spatiotemporal datasets adds more challenges related to the collection, storage and processing of such big and dynamic data, then using them to build comprehensive spatiotemporal models. Besides, thematic data related to traffic accidents, injuries and road networks combined with criminal records is an important multidisciplinary path of research that needs more efforts. Traffic data represents spatiotemporal trajectories that are used to discover periodic patterns that describe the behaviours of moving objects Sönmez et al. (2019). One important challenge is that the spatiotemporal trajectory pattern does not follow regular time intervals Zhang et al. (2015). Furthermore, the influence of nearby objects and their patterns is another problem. Example of such influence is spatiotemporal events, such as accidents, that affect the traffic congestion patterns Rao et al. (2012). Traffic congestion estimation is another open issue due to the complexity of analysing multiple data from different sources, e.g., sensors in taxicabs, GPS, mobile sensors, and road network sensors, and the inclusion of various variables such as density, velocity, inflow and previous status Yang et al. (2017). Adding to these computational issues, traffic congestion is a critical problem because it affects peoples’ life and may damage the socioeconomic growth Zheng et al. (2014).
Deep learning researchers have paid attention to traffic state estimation due to the availability of large datasets of vehicle trajectories Zhang et al. (2019). There are two main approaches to address traffic estimation. The macro approach divides the city into equal grids which are represented by its road segments states (Zhang et al. 2016; Vahedian et al. 2017; Yao et al. 2018). The micro approach produces finer-grain segments of road networks (Yu et al. 2017). This approach considers temporal traffic patterns and spatial correlation among traffic states. Traffic estimation is still a challenging task due to the uncertainty issue because of data sparsity and semantic ambiguity. Trajectory embeddings are tackled by the complicated topology of the transportation networks. Modelling such data is affected by the spatiotemporal dynamicity. Moreover, intelligent transportation systems have other essential components, such as Region-Level Ride-Hailing (RLRH) demand forecasting. RLRH demand forecasting aims to estimate the future demand in city regions given the previous states. RLRH demand forecasting tends to enhance traffic functions such as vehicle allocations, waiting time, and congestion Yao et al. (2018). In the same fashion, this task is challenging because of the complex nature of the STDM correlations or complicated dependencies among different regions. Figure 16 shows an example of the impact of the different correlation level of different regions on the RLRH demand forecast (Geng et al. 2019). Moreover, recent studies focused on the fairness in the ride hailing platforms such as Uber and DiDi as they employ different matching strategies to connect customers and drivers. There seems to be an unfair distribution of jobs among drivers which led to concerns such as discrimination against minorities. Having each matching to be fair is a difficult task. Therefore, there is a need for more efforts in STDM to discover better matching distributions over time. The authors in (Sühr et al. 2019) proposed a framework that attempts to ensure fairness in the ride hailing matching. Their hypothesis of fairness is that all active drivers should be proportionally matched overtime.
Fig. 16.
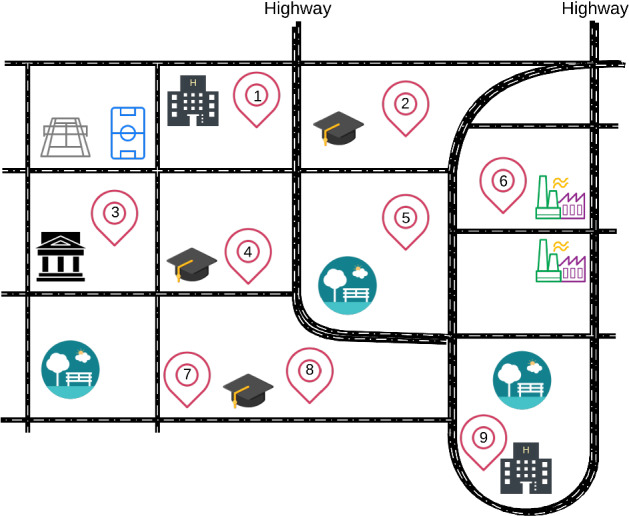
The impact of different correlations among regions on RLRH demand forecast. For example, R7 is adjacent to R8, similar to R4 and R2, connected with R3, and distant or irrelevant to R6
Earth and environment monitoring
There are different environment-related spatiotemporal applications such as land use and change detection that are being affected by different natural and socioeconomic factors. Another application area is route mining in waterways, which is challenging due to routes may be created by different types of ships jamming in the same waterway, frequent changing direction and navigation via different routes Wen et al. (2016). There is a need to integrate data describing the atmosphere, hydrosphere, lithosphere, and biosphere of the earth in order to build more accurate spatiotemporal multidimensional models (Rao et al. 2012). Also, there is a lack of mathematical and statistical methods for dynamic visualisation Ye et al. (2012). Quantifying spatiotemporal human exposure to air pollutants is another difficult task because of different people activity patterns and the complexity that results from multifaceted relationships between human and environment Steinle et al. (2013). Spatiotemporal climate forecasting predictive models are affected by errors in their model physics (Meehl et al. 2014; Hamdi et al. 2021). Specifically, models drift toward their internal means state. This issue is also caused by imperfections in representing the models’ initial conditions Hazeleger et al. (2013). Recently, bias correction methods have been developed. There are multiple methods that are proposed to solve this bias in spatiotemporal predictive modelling, such as bias adjustment and conditional bias methods. These methods correct spatiotemporal bias in the climate forecast time, lead time, and initial conditions (Director et al. 2017). The significance of this STDM task extends to commercial vessel traffic in some Arctic regions. Such commercial domain is directly impacted by the sea ice forecast Huntington et al. (2015). Spatiotemporal bias also exists in precipitation data gauging and analysis. Gauge-based rainfall predictions rely on point data which are collected from multiple areas with limited and uneven radius. Satellite-based rainfall predictions have been developed using deep learning bias correction models Le et al. (2020).
Epidemiology and spread of infectious diseases
The spread of infectious diseases is affected by human mobility. Monitoring human mobility is a hard task because it occurs in huge volumes, and different periods ranging from minutes to years Arino (2017). Another challenge is the enormous number of mobility events that have different characteristics, causes and complex spatiotemporal relationships with humans. On the other hand, migrants and refugees who come from regions of conflicts add more challenges to investigate new factors from outside the analysed society or geographic areas. The migrants carry their health history, which may affect the population of the target societies. For example, the black death disaster came to Europe via the silk route. Arino (2017) reported that there are two main problems in the spatiotemporal spread of pathogens of humans; namely; fast spatial spread of an evolving pathogen and the interactions of health systems. The modern transportation facilities enable this fast spread of infectious pathogens around the world. Besides, pathogens do not care about borders in contrast with the public health systems that manage a specific geographic area. Consequently, the interconnections between different areas add more challenge in mining the spread of pathogens. For example, the outbreak of 2019 new corona-virus diseases (COVID-19) in Wuhan, China, has forced the countries all over the world to close their borders and apply strict travel bans Novel et al. (2020); Pan et al.(2020). Recently, attention models with deep LSTM networks have been employed to predict disease progression Zhang et al. (2019). This task considers irregular time intervals between consecutive disease events. Moreover, understanding the probability of patient survival is a piece of essential information for the healthcare field. It is useful to identify the best treatment plans over time. Survival analyses consider the prediction of occurring an even of interest. However, these analyses are affected by spatiotemporal uncertainty. Therefore, most of the existing survival analysis methods lack the ability to provide comprehensive results. Figure 17 shows a representation of calculating the uncertainty of survival analysis in temporal function (Sokota et al. 2019).
Fig. 17.

Survial analysis under uncertainty (Sokota et al. 2019). The survival curve, red line, calculates the probability as a temporal function. The point-wise and simultaneous intervals covers the uncertainties
Social media analysis
Data provided by social media is affected by the growth of sensor technologies that generate big spatiotemporal data, such as check-in records, user reviews, and geo-temporal tagged posts Zhang et al. (2015). In this context, social media has complex spatiotemporal correlations. Accordingly, the analysis of social media faces different challenges in order to understand these correlations and to develop accurate models. Spatiotemporal topic modelling in social media contents is used with time and location-tagged to discover topics. This topic modelling is affected by challenges related to the heterogeneity of geographical context (Jiang et al. 2018), such as the locations sparsity caused by a tiny amount of posts that are tagged with geographical locations. The sparsity issue directly affects spatiotemporal social media analysis tasks such as density estimation (Jeawak et al. 2020; Sakaki et al. 2010), event location extraction Chung et al. (2017) and collaborative filtering Zhou et al. (2019). Such tasks are affected by different social factors such as social trust. Trust propagation approaches estimate the users’ preferences based on the features of their connections. This could achieved by implementing random-walk on social graphs. Recently, deep learning studies have merged social information into recommendation in an ensemble fashion such as graph neural network (Song et al. 2019; Wu et al. 2019b) and network embedding Liu et al. (2018). These works aim to encode high-dimensional network information Wu et al. (2019a). Most of the existing methods predict the social relationships based on pairwise approaches with hand-engineered features or utilising skip-gram model to learn the graph embeddings. However, both models fail to harness complex dynamics of social relationship patterns. Besides, computing the graph embeddings based on random walks for information propagation is not accurate due to lacking the semantic information Wu et al. (2019c).
Smart internet of things
Smart IoT adoption is increasing with the proliferation of urban population. Consequently, real-time large-scale sensor data are captured via distributed connected objects equipped with sensors. These sensors can monitor different variables at multiple locations such as homes, ambient air quality, climate and earthquakes Shaban et al. (2016); Poulakis et al. (2013); Mehrjoo and Khunjush (2018); Crooks et al. (2013); Yunus et al. (2020). Working with such data poses some challenges while storing, processing and modelling, which can be addressed by utilising cloud computing Neiat et al. (2014). Sensory data suffers from sparsity where no observations are captured for many regions within the sensed fields. This requires more efforts in filling the missing values using correlated data sources. However, the integration process is complicated because of the different sampling rates of various sensory data. For example, the temporal resolution in medical sensors is much higher than in GPS sensors. Also, the sensory data integration is complicated by the veracity of the different measurements recorded by each sensor. For instance, there is a high level of uncertainty caused by the difficulty in spatial localisation and temporal synchronisation between sensors Ang and Seng (2016). IoT opens new research directions, such as sitting posture monitoring and smart voice control. The poor sitting posture causes ill-effects on both physical and mental health. Sitting posture monitoring is challenged by multiple issues such as the variance in human sitting behaviours and divergence in user body mass indexes Bourahmoune and Amagasa (2019). Smart voice control is being used by 100 million users (Lei et al. (2019). Different users can use multiple appliances at the same time. There is a need for new STDM methods that can consider the possible variant spatial, temporal, and thematic features. For example, voice-controlling a smart air-conditioner may be different from a smart TV. It is expected to have different user behaviours based temperature degrees and device locations. Moreover, IoT mobile devices can be used as a smart agent to detect certain diseases such as Parkinson’s disorder. This disorder cause degeneration of the nervous system. It affects human movement, speech, and cognition. Clinical assessments are commonly misdiagnosed such disease. However, this could be solved by analysing long-term data that can be collected using mobile devices Schwab and Karlen (2019). Figure 18 shows an example of Parkinson detection based on mobile-collected data of walking, talking, tapping, and memory. Another issue in multi-sensory data fusion is to eliminate spatiotemporal bias. Fusing data from multiple sensors suffers from time delays among measurement timestamps. Such delays might be caused by data transfer or signal processing. Therefore, data fusion applications are in need for accurate spatiotemporal bias estimation techniques (Bu et al. 2019). Various methods are proposed for different sensors such as cameras, radars, or sonars Taghavi et al. (2016); Jones and Soatto (2011). They utilised different computing methods such as maximum likelihood and Kalman filters. However, these works only consider spatial data references of the multiple sensors. The temporal bias inevitably exits in the multi-sensor data fusion and requires more research efforts Bu et al. (2019).
Fig. 18.
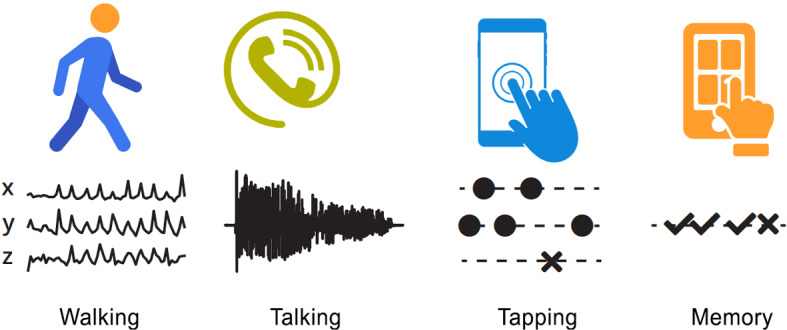
Mobile-collected data can be used to monitor different patterns of user’s walking, voice, tapping, and memory (Schwab and Karlen 2019)
Summary of STDM general challenges
Table 1 summarizes the identified and above-mentioned STDM challenges. For each challenge, the table highlights its causes and related works attempting to address them. Furthermore, the related works are annotated with relevant STDM tasks and applications. The aim of this annotation is to link between the three main components of the survey. For instance, STDM relationships pose three main challenges including complexity, implicitness, and non independent and identically distributions. Each of these challenges is accompanied with its tasks and applications. Tasks include Cluster Analysis (CA), Pattern Analysis (PA), Outlier Detection (OD), Prediction Modelling (PM), Visualization (v), and Visual Analytics (VA). Also, the Applications are Public Safety (PS), Transportation Management (TM), Environmental Analysis (EA), Epidemiology (EP), Social Media Analysis (SA), and IoT.
Table 1.
Summary of STDM main challenges and their causes
| Issue | Challenges | Causes | Tasks | Applications |
|---|---|---|---|---|
| Spatio-temporal Relation-ships | Complexity | Discrete representation of continuous spatiotemporal data | S-Rao et al. (2012); Shekhar et al. (2015), CA-Du et al. (2016); Huang et al. (2008), PA-Cheng et al. (2020), OD-Rettig et al. (2015), PM-Liang et al. (2019); Zhang et al. (2019); Fusco et al. (2016), V-Eldawy et al. (2016) | PS-Zhang et al. (2017), TM-Wang et al. (2016), EA-Guo (2017), EP-Lee et al. (2016), SA-Tsou (2015), IoT-Wang et al. (2016) |
| Co-located objects influence each other | ||||
| Implicit-ness | Implicit relationships between spatiotemporal objects | CA-Senaratne et al. (2014); Kang et al. (2020), PA-Sagl et al. (2012); Aydin et al. (2016), OD-Radhakrishna et al. (2016), PM-Chung et al. (2017) | PS-Wu et al. (2015), TM-El Esawey (2017), EA-Guo (2017), EP-Welch et al. (2011), SA-Sagl et al. (2012), IoT-Sagl et al. (2012) | |
| Non-independ-ent and Non-identical distrib-ution | Auto-correlation due to dependency relationships in space and time | S-Shekhar et al. (2015), CA-Khan et al. (2017); Guijo-Rubio et al. (2020), PA-Shirowzhan et al. (2020), OD-Khan et al. (2017), PM-He et al. (2019); Jiang and Shekhar (2017), V-Li et al. (2017) | PS-Quick et al. (2017), TM-Cheng et al. (2012), EA-Fawcett et al. (2014), EP-Meentemeyer et al. (2011), SA-Kim et al. (2016), IoT-Gao (2015) | |
| Non-identical distribution across space and time | ||||
| Inter-disciplin-ary and Combined Data Mining | Various interrelated domains | Heterogeneous data requiring multiple STDM techniques | CA-Carrasco-Escobar et al. (2017); Shao et al. (2019), PA-Yates et al. (2015), OD-Harris et al. (2014), PM-Jiang and Shekhar (2017), V-Pattelli et al. (2016) VA-Malik et al. (2014), | PS-Song et al. (2017), TM-Cheng et al. (2012); Yates et al. (2015), EA-Fawcett et al. (2014), EP-Hanke et al. (2016), SA-Cao et al. (2015), IoT-Xue et al. (2016) |
| Environ-mental factors | ||||
| Opportunity | ||||
| Region Discretization | Scale effect | Scale dependency | CA-Damm et al. (2020), PA-Nelson and Brewer (2017); Zeng et al. (2020), OD-Gutiérrez-Gómez et al. (2020), PM-Yuan et al. (2020); Sadri et al. (2018), V-Nelson and Brewer (2017), VA-Malik et al. (2014); Zeng et al. (2020) | PS-Quick et al. (2017), TM-Ling et al. (2020), EA-Liu et al. (2014), EP-Lee et al. (2016), SA-Cao et al. (2015), IoT-Kotevska et al. (2017) |
| Zoning effect | Zone dependency | |||
| Data Characteristics | Specificity | Spatiotemporal data tend to be unique to a particular space-time region. | CA-Rashidi et al. (2015), PM-Zhao et al. (2015), V-Phillips and Lee (2012); Van Pelt et al. (2012), VA-Malik et al. (2014) | PS-Malik et al. (2014), EA-Rashidi et al. (2015) SA-Zhao et al. (2015) |
| Learned model is specific to a particular spatiotemporal region. | ||||
| Vagueness | Similarities rooted from different criteria | S-Shekhar et al. (2015), CA-Senaratne et al. (2014); Kang et al. (2020), PA-Aydin et al. (2016), OD-Radhakrishna et al. (2016), PM-Chung et al. (2017) | PS-Albertetti (2015); Wu et al. (2015), TM-El Esawey (2017), EA-Guo (2017), EP-Welch et al. (2011), SA-Sagl et al. (2012), IoT-Sagl et al. (2012) | |
| Dynamic-ity | Continuous change through space and time. | CA-Huang et al. (2008), PA-Liu et al. (2014), OD-Shahid et al. (2015); Ferreira et al. (2020), PM-Hens et al. (2019); Ehrlén and Morris (2015); Rumi et al. (2018), V-Cheng et al. (2020) | PS-Kotevska et al. (2017), TM-Cheng et al. (2012); El Esawey (2017), EA-Liu et al. (2014), EP-Meentemeyer et al. (2011), SA-Cao et al. (2015), IoT-Kotevska et al. (2017) | |
| Social | Correlation with the socio-economic characteristics | CA-Steiger et al. (2016), OD-Chae et al. (2012), PM-Rumi et al. (2018); Zhao et al. (2015); Bogomolov et al. (2014); Zhou et al. (2017), V-Hochman and Schwartz (2012); Tsou (2015) VA-Cao et al. (2015) | PS-Bogomolov et al. (2014), SA-Rumi et al. (2018); Zhao et al. (2015), IoT-Wang et al. (2020); Kaur et al. (2018); Chae et al. (2012) | |
| Network-ed | Influence between objects and trajectories. | |||
| Exponential number of relationships. | ||||
| Heterog-eneous and Non-stationary | Wide variation of data distributions over space and time. | S-Miller and Han (2009); Yu and Liu (2017), CA-Carrasco-Escobar et al. (2017), PA-Ren et al. (2018); Yates et al. (2015), OD-Harris et al. (2014), PM-Jiang and Shekhar (2017); Rahaman et al. (2018), V-Pattelli et al. (2016) VA-Malik et al. (2014) | PS-Kadar et al. (2019); Song et al. (2017), TM-Cheng et al. (2012); Yates et al. (2015), EA-Fawcett et al. (2014), EP Hanke et al. (2016), SA-Cao et al. (2015), IoT-Yang et al. (2019b); Xue et al. (2016) | |
| Different learning models for varying spatiotemporal regions. | ||||
| Limited Access and Privacy | Privacy issues | S-Giannotti and Pedreschi (2008), CA-Acs and Castelluccia (2014), PA-De Montjoye et al. (2013), PM-Huang et al. (2020) | PS-Ratcliffe (2010), TM-Kaltenbrunner et al. (2010), IoT-De Montjoye et al. (2013) | |
| Poor Quality | Uncertainties, Partial knowledge, Conjectures | CA-Albertetti (2015), PM-Diehl et al. (2015) V-Islam et al. (2018) VA-Malik et al. (2014) | PS-Malik et al. (2014); Murray et al. (2011), EA-Diehl et al. (2015), SA-Steiger et al. (2016), IoT-Wang et al. (2018b) | |
| Big data | Volume, variety and velocity | CA-Du et al. (2016); Shao et al. (2016), PA-Cheng et al. (2020),PM-Fusco et al. (2016), OD-Rettig et al. (2015), V-Eldawy et al. (2016) | PS-Zhang et al. (2017), TM-Wang et al. (2016), EA-Guo (2017), EP-Lee et al. (2016), SA-Tsou (2015), IoT-Wang et al. (2016) | |
| Open Issues | Data Representations | Limited representations of spatiotemporal data | Santos et al. (2016); Dunkel et al. (2019); Gao et al. (2020); Yu et al. (2020); Golany et al. (2020) | |
| Advanced Modelling | Depend on high-density locations while ignoring the temporally related attributes. | Roth et al. (2013); Nguyen et al. (2017); Almanie et al. (2015); Fusco et al. (2016); Du et al. (2016); De Brouwer et al. (2019); Chen et al. (2018); Sen et al. (2019); Kim et al. (2018) | ||
| Visualisation | Developing techniques for spatial visualisation, while less consideration is given to spatiotemporal | Ye et al. (2012); Kastner and Samet (2020); Sakaue and Sato (2020); Rizwan et al. (2020); Salcedo-Gonzalez et al. (2020); Sha et al. (2020) | ||
| Comprehen-sive Approaches | Focusing on certain problems and do not introduce comprehensive spatiotemporal solutions | Ndehedehe et al. (2016) | ||
| Fairness, Accountability, Transparency, and Ethics (FATE) | Amplifying genders, denying people services, and racial biases . | Dudík et al. (2020); Olteanu et al. (2020); Buolamwini and Gebru (2018); Raghavan et al. (2020); Blodgett et al. (2020); Guo et al. (2019); Bird et al. (2020) |
Conclusion
STDM is important due to the availability of large amounts of geographic and time-stamped data that can be mined to solve many interesting problems in different applications. STDM aims at discovering beneficial relationships and patterns that are implicit in spatiotemporal data. In this regard, STDM focuses on the design of efficient and scalable algorithms to mine, i.e., extract, predict, cluster, and quantify spatiotemporal patterns. Performing STDM is more difficult than traditional data mining due to the complex types of spatiotemporal relationships, interdisciplinary nature of data and tasks, and the unique characteristics of spatiotemporal data. Future research should focus on developing new modelling and visualisation methods that enable the integration of multiple STDM tasks to solve more complex scenarios. In this paper, we described the STDM problems and open gaps. We explained general issues related to spatiotemporal relationships, interdisciplinarity, discretisation, data characteristics, and research limitations. In an attempt to produce a comprehensive survey about the STDM challenges, we discussed the tasks and applications related challenges.
Acknowledgements
Ali Hamdi is supported by RMIT Research Stipend Scholarship. This work was funded by NPRP8-408-2-172 grant from Qatar National Research Fund (a member of Qatar Foundation). The statements made herein are solely the responsibility of the authors.
Footnotes
Publisher's Note
Springer Nature remains neutral with regard to jurisdictional claims in published maps and institutional affiliations.
References
- Aasha M, Sivaranjani S, Sivakumari S (2016) An effective reduction of gait recognition time by using gender classification. In: Proceedings of the international conference on advances in information communication technology & computing, AICTC ’16, = ACM, New York, NY, USA. pp. 18:1–18:6
- Acs G, Castelluccia C (2014) A case study: privacy preserving release of spatio-temporal density in paris. In: Proceedings of the 20th ACM SIGKDD international conference on knowledge discovery and data mining, pp. 1679–1688. ACM
- Aggarwal CC (2017) An introduction to outlier analysis, pp. 1–34. Springer
- Albertetti F. A knowledge extraction framework for crime analysis. Thesis: Université de Neuchâtel; 2015. [Google Scholar]
- Alipio M, Tiglao NM, Grilo A, Bokhari F, Chaudhry U, Qureshi S. Cache-based transport protocols in wireless sensor networks a survey and future directions. J Netw Comput Appl. 2017;88:29–49. [Google Scholar]
- Almanie T, Mirza R, Lor E (2015) Crime prediction based on crime types and using spatial and temporal criminal hotspots. Int J Data Min Knowl Manag Process (IJDKP) 5(4)
- Al-Nuzaili Q, Hamdi A, Hashim SZ, Saeed F, Khalil MS (2017) An enhanced quadratic angular feature extraction model for arabic handwritten literal amount recognition. In: International Conference of Reliable Information and Communication Technology. Springer, Cham, pp 369–377
- Al-Nuzaili Q, Al-Maadeed S, Hassen H, Hamdi A (2018) Arabic bank cheque words recognition using Gabor features. In: 2018 IEEE 2nd International Workshop on Arabic and Derived Script Analysis and Recognition (ASAR). IEEE, pp 84–89
- Amornbunchornvej C, Berger-Wolf TY. Mining and modeling complex leadership-followership dynamics of movement data. Soc Netw Anal Min. 2019;9(1):58. [Google Scholar]
- Ang LM, Seng KP. Big sensor data applications in urban environments. Big Data Res. 2016;4:1–12. [Google Scholar]
- Arino J. Spatio-temporal spread of infectious pathogens of humans. Infect Dis Modell. 2017;2(2):218–228. doi: 10.1016/j.idm.2017.05.001. [DOI] [PMC free article] [PubMed] [Google Scholar]
- Atluri G, Karpatne A, Kumar V. Spatio-temporal data mining: a survey of problems and methods. ACM Comput Surv. 2018 doi: 10.1145/3161602. [DOI] [Google Scholar]
- Aydin B, Akkineni V, Angryk R. Mining spatiotemporal co-occurrence patterns in non-relational databases. GeoInformatica. 2016;20(4):801–828. [Google Scholar]
- Bai S, Tang P, Torr PH, Latecki LJ (2019) Re-ranking via metric fusion for object retrieval and person re-identification. In: The IEEE conference on computer vision and pattern recognition (CVPR)
- Bao L, Wu B, Liu W (2018) Cnn in mrf: Video object segmentation via inference in a cnn-based higher-order spatio-temporal mrf. In: Proceedings of the IEEE conference on computer vision and pattern recognition, pp. 5977–5986
- Beernaerts J, De Baets B, Lenoir M, Van de Weghe N. Spatial movement pattern recognition in soccer based on relative player movements. PloS one. 2020;15(1):e0227746. doi: 10.1371/journal.pone.0227746. [DOI] [PMC free article] [PubMed] [Google Scholar]
- Bhattacharya T, Kulik L, Bailey J (2012) Extracting significant places from mobile user gps trajectories: a bearing change based approach. In: Proceedings of the 20th international conference on advances in geographic information systems, SIGSPATIAL ’12, pp. 398–401. ACM, New York, NY, USA
- Birant D, Kut A. St-dbscan an algorithm for clustering spatial-temporal data. Data Knowl Eng. 2007;60(1):208–221. [Google Scholar]
- Bird S, Dudík M, Edgar R, Horn B, Lutz R, Milan V, Sameki M, Wallach H, Walker K (2020) Fairlearn: a toolkit for assessing and improving fairness in ai. Tech. Rep. MSR-TR-2020-32, Microsoft
- Blodgett SL, Barocas S, Daumé III H, Wallach H (2020) Language (technology) is power: a critical survey of “bias” in nlp. In: ACL
- Bo A, Peng S, Xinming T, Alimu N (2011) Spatio-temporal visualization system of news events based on gis. In: Communication software and networks (ICCSN), 2011 IEEE 3rd international conference on, pp. 448–451. IEEE
- Bogomolov A, Lepri B, Staiano J, Oliver N, Pianesi F, Pentland A (2014) Once upon a crime: towards crime prediction from demographics and mobile data. In: Proceedings of the 16th international conference on multimodal interaction, pp. 427–434. ACM
- Bourahmoune K, Amagasa T (2019) Ai-powered posture training: application of machine learning in sitting posture recognition using the lifechair smart cushion. In: Proceedings of the 28th international joint conference on artificial intelligence, pp. 5808–5814. AAAI Press
- Bu S, Zhou C. Zhou G (2019) Simultaneous spatiotemporal bias and state estimation for asynchronous multi-sensor system. J Eng. 2019;19:5824–5828. [Google Scholar]
- Bulstra CA, Le Rutte EA, Malaviya P, Hasker EC, Coffeng LE, Picado A, Singh OP, Boelaert MC, de Vlas SJ, Sundar S. Visceral leishmaniasis: spatiotemporal heterogeneity and drivers underlying the hotspots in Muzaffarpur, Bihar, India. PLoS Negl Trop Dis. 2018;12(12):e0006888. doi: 10.1371/journal.pntd.0006888. [DOI] [PMC free article] [PubMed] [Google Scholar]
- Buolamwini J, Gebru T (2018) Gender shades: intersectional accuracy disparities in commercial gender classification. In: Conference on fairness, accountability and transparency, pp. 77–91
- Calabrese F, Colonna M, Lovisolo P, Parata D, Ratti C. Real-time urban monitoring using cell phones a case study in Rome. IEEE Trans Intell Transp Syst. 2011;12(1):141–151. [Google Scholar]
- Cao G, Wang S, Hwang M, Padmanabhan A, Zhang Z, Soltani K. A scalable framework for spatiotemporal analysis of location-based social media data. Comput Environ Urban Syst. 2015;51:70–82. [Google Scholar]
- Carrasco-Escobar G, Gamboa D, Castro MC, Bangdiwala SI, Rodriguez H, Contreras-Mancilla J, Alava F, Speybroeck N, Lescano AG, Vinetz JM (2017) Micro-epidemiology and spatial heterogeneity of p. vivax parasitaemia in riverine communities of the peruvian amazon a multilevel analysis. Sci Rep 7(1):8082 [DOI] [PMC free article] [PubMed]
- Celik M, Shekhar S, Rogers JP, Shine JA. Mixed-drove spatiotemporal co-occurrence pattern mining. IEEE Trans Knowl Data Eng. 2008;20(10):1322–1335. [Google Scholar]
- Chae J, Thom D, Bosch H, Jang Y, Maciejewski R, Ebert DS, Ertl T (2012) Spatiotemporal social media analytics for abnormal event detection and examination using seasonal-trend decomposition. In: IEEE VAST, pp. 143–152
- Chawla S, Shekhar S, Wu W, Ozesmi U (2001) Modeling spatial dependencies for mining geospatial data. In: Proceedings of the 2001 SIAM international conference on data mining, pp. 1–17. SIAM
- Chen CP, Zhang CY. Data-intensive applications, challenges, techniques and technologies: a survey on big data. Inf Sciences. 2014;275:314–347. [Google Scholar]
- Chen RTQ, Rubanova Y, Bettencourt J, Duvenaud DK (2018) Neural ordinary differential equations. In: S. Bengio, H. Wallach, H. Larochelle, K. Grauman, N. Cesa-Bianchi, R. Garnett (eds.) Advances in Neural Information Processing Systems, vol. 31, pp. 6571–6583. Curran Associates, Inc
- Cheng J, Tsai YH, Hung WC, Wang S, Yang MH (2018) Fast and accurate online video object segmentation via tracking parts. In: Proceedings of the IEEE Conference on Computer Vision and Pattern Recognition, pp. 7415–7424
- Cheng S, Hu Y, Fan J, Wei Q. Reading comprehension based on visualization of eye tracking and eeg data. Sci China Inf Sci. 2020;63(11):1–3. [Google Scholar]
- Cheng S, Lu F, Peng P. A high-resolution emissions inventory and its spatiotemporal pattern variations for heavy-duty diesel trucks in Beijing. China: J Clean Prod; 2020. p. 250. [Google Scholar]
- Cheng T, Haworth J, Anbaroglu B, Tanaksaranond G, Wang J. Spatiotemporal data mining. Germany: Springer; 2014. [Google Scholar]
- Cheng T, Haworth J, Wang J. Spatio-temporal autocorrelation of road network data. J Geograph Syst. 2012;14(4):389–413. [Google Scholar]
- Cheng T, Wicks T. Event detection using twitter: a spatio-temporal approach. PLOS ONE. 2014;9:1–10. doi: 10.1371/journal.pone.0097807. [DOI] [PMC free article] [PubMed] [Google Scholar]
- Chou YH. Exploring spatial analysis in geographic information systems. MUmbai: OnWord Press; 1997. [Google Scholar]
- Chung JW, Yang W, You J, Park JC (2017) Inferring implicit event locations from context with distributional similarities. In: Proceedings of the 26th International Joint Conference on Artificial Intelligence, pp. 979–985. AAAI
- Ci H, Wang C, Wang Y (2018) Video object segmentation by learning location-sensitive embeddings. In: Proceedings of the European Conference on Computer Vision (ECCV), pp. 501–516
- Crooks A, Croitoru A, Stefanidis A, Radzikowski J. Earthquake twitter as a distributed sensor system. Trans GIS. 2013;17(1):124–147. [Google Scholar]
- Damm L, Varoqui D, De Cock VC, Dalla Bella S, Bardy B. Why do we move to the beat? A multi-scale approach, from physical principles to brain dynamics. Neurosci Biobehav Rev. 2020;112:553–584. doi: 10.1016/j.neubiorev.2019.12.024. [DOI] [PubMed] [Google Scholar]
- De Brouwer E, Simm J, Arany A, Moreau Y (2019) Gru-ode-bayes: continuous modeling of sporadically-observed time series. In: H. Wallach, H. Larochelle, A. Beygelzimer, F. dAlché-Buc, E. Fox, R. Garnett (eds.) Advances in neural information processing systems, vol. 32, pp. 7379–7390. Curran Associates, Inc
- De Montjoye YA, Hidalgo CA, Verleysen M, Blondel VD. Unique in the crowd: the privacy bounds of human mobility. Sci Rep. 2013;3:1376. doi: 10.1038/srep01376. [DOI] [PMC free article] [PubMed] [Google Scholar]
- Di Martino F, Pedrycz W, Sessa S. Spatiotemporal extended fuzzy c-means clustering algorithm for hotspots detection and prediction. Fuzzy Sets Syst. 2017;340:109–126. [Google Scholar]
- Diehl A, Pelorosso L, Delrieux C, Saulo C, Ruiz J, Groller ME, Bruckner S (2015) Visual analysis of spatio-temporal data: Applications in weather forecasting. In: Computer Graphics Forum, vol. 34, pp. 381–390. Wiley Online Library
- Director HM, Raftery AE, Bitz CM. Improved sea ice forecasting through spatiotemporal bias correction. J Clim. 2017;30(23):9493–9510. [Google Scholar]
- Doraiswamy H, Freire J, Lage M, Miranda F, Silva C. Spatio-temporal urban data analysis: a visual analytics perspective. IEEE Comp Graph Appl. 2018;38(5):26–35. doi: 10.1109/MCG.2018.053491728. [DOI] [PubMed] [Google Scholar]
- Du D, Qi Y, Yu H, Yang Y, Duan K, Li G, Zhang W, Huang Q, Tian Q (2018) The unmanned aerial vehicle benchmark: object detection and tracking. In: Proceedings of the European Conference on Computer Vision (ECCV), pp. 370–386
- Du F, Zhu AX, Qi F. Interactive visual cluster detection in large geospatial datasets based on dynamic density volume visualization. Geocarto Int. 2016;31(6):597–611. [Google Scholar]
- Dudík M, Chen W, Barocas S, Inchiosa M, Lewins N, Oprescu M, Qiao J, Sameki M, Schlener M, Tuo J, Wallach H (2020) Assessing and mitigating unfairness in credit models with the fairlearn toolkit. Tech Rep. MSR-TR-2020-34, Microsoft
- Dunkel A, Andrienko G, Andrienko N, Burghardt D, Hauthal E, Purves R. A conceptual framework for studying collective reactions to events in location-based social media. Int J Geogr Inf Sci. 2019;33(4):780–804. [Google Scholar]
- Egenhofer MJ, Clementini E, Di Felice P. Topological relations between regions with holes. Int J Geogr Inf Sci. 1994;8(2):129–142. [Google Scholar]
- Ehrlén J, Morris WF. Predicting changes in the distribution and abundance of species under environmental change. Ecol Lett. 2015;18(3):303–314. doi: 10.1111/ele.12410. [DOI] [PMC free article] [PubMed] [Google Scholar]
- Ehsani K, Mottaghi R, Farhadi A (2018) Segan: Segmenting and generating the invisible. In: Proceedings of the IEEE conference on computer vision and pattern recognition, pp. 6144–6153
- El Esawey M. Estimation of daily bicycle traffic volumes using spatiotemporal relationships. J Transp Eng Part A Syst. 2017;143(11):04017056. [Google Scholar]
- Eldawy A, Mokbel MF, Jonathan C (2016) Hadoopviz a mapreduce framework for extensible visualization of big spatial data. In: Data Engineering (ICDE), 2016 IEEE 32nd international conference on, pp. 601–612. IEEE
- Elgendy N, Elragal A (2014) Big data analytics: a literature review paper. In: Industrial conference on data mining, pp. 214–227. Springer
- Ermagun A, Levinson D. Spatiotemporal traffic forecasting: review and proposed directions. Transp Rev. 2018;38(6):786–814. [Google Scholar]
- Ester M, Kriegel HP, Sander J (1997) Spatial data mining a database approach. In: International symposium on spatial databases, pp. 47–66. Springer
- Fan Q, Zhong F, Lischinski D, Cohen-Or D, Chen B. Jumpcut: non-successive mask transfer and interpolation for video cutout. ACM Trans. Graph. 2015;34(6):195–1. [Google Scholar]
- Fawcett TW, Fallenstein B, Higginson AD, Houston AI, Mallpress DE, Trimmer PC, McNamara JM. The evolution of decision rules in complex environments. Trends Cognitive Sci. 2014;18(3):153–161. doi: 10.1016/j.tics.2013.12.012. [DOI] [PubMed] [Google Scholar]
- Feng J, Dong Y, Song L. A spatio-temporal analysis of urban crime in Beijing based on data for property crime. Urban Stud. 2016;53(15):3223–3245. [Google Scholar]
- Feng W, Zhang C, Zhang W, Han J, Wang J, Aggarwal C, Huang J (2015) Streamcube: hierarchical spatio-temporal hashtag clustering for event exploration over the twitter stream. In: 2015 IEEE 31st international conference on data engineering, pp. 1561–1572. IEEE
- Ferguson AG. The rise of big data policing: surveillance, race, and the future of law enforcement. Manhattan: NYU Press; 2019. [Google Scholar]
- Ferreira LN, Vega-Oliveros DA, Cotacallapa M, Cardoso MF, Quiles MG, Zhao L, Macau EE. Spatiotemporal data analysis with chronological networks. Nat Commun. 2020;11(1):1–11. doi: 10.1038/s41467-020-17634-2. [DOI] [PMC free article] [PubMed] [Google Scholar]
- Flaxman S, Chirico M, Pereira P, Loeffler C, et al. Scalable high-resolution forecasting of sparse spatiotemporal events with kernel methods: a winning solution to the nij & #x201C;real-time crime forecasting challange. Ann Appl Stat. 2019;13(4):2564–2585. [Google Scholar]
- Follmann P, Bottger T, Hartinger P, Konig R, Ulrich M (2018) Mvtec d2s: densely segmented supermarket dataset. In: Proceedings of the European conference on computer vision (ECCV), pp. 569–585
- Fusco G, Colombaroni C, Isaenko N. Short-term speed predictions exploiting big data on large urban road networks. Transp Res Part C Emerg Technol. 2016;73:183–201. [Google Scholar]
- Gao H, Pei J, Huang H (2019) Progan: network embedding via proximity generative adversarial network. In: Proceedings of the 25th ACM SIGKDD international conference on knowledge discovery and data mining, pp. 1308–1316
- Gao J, Zhang T, Xu C (2019) Graph convolutional tracking. In: Proceedings of the IEEE conference on computer vision and pattern recognition, pp. 4649–4659
- Gao N, Xue H, Shao W, Zhao S, Qin KK, Prabowo A, Rahaman MS, Salim FD (2020) Generative adversarial networks for spatio-temporal data: a survey. arXiv preprint arXiv:2008.08903
- Gao S. Spatio-temporal analytics for exploring human mobility patterns and urban dynamics in the mobile age. Spat Cognit Comput. 2015;15(2):86–114. [Google Scholar]
- Gebru T, Morgenstern J, Vecchione B, Vaughan JW, Wallach H, Daumé III H, Crawford K (2018) Datasheets for datasets. arXiv preprint arXiv:1803.09010
- Geng X, Li Y, Wang L, Zhang L, Yang Q, Ye J, Liu Y. Spatiotemporal multi-graph convolution network for ride-hailing demand forecasting. Proceedings of the AAAI conference on artificial intelligence. 2019;33:3656–3663. [Google Scholar]
- Ghani NA, Hamid S, Hashem IAT, Ahmed E. Social media big data analytics: a survey. Comput Hum Behav. 2019;101:417–428. [Google Scholar]
- Giannotti F, Nanni M, Pinelli F, Pedreschi D (2007) Trajectory pattern mining. In: Proceedings of the 13th ACM SIGKDD international conference on Knowledge discovery and data mining, pp. 330–339. ACM
- Giannotti F, Pedreschi D. Mobility, data mining and privacy geographic knowledge discovery. Berlin: Springer; 2008. [Google Scholar]
- Golany T, Radinsky K, Freedman D (2020) Simgans: Simulator-based generative adversarial networks for ecg synthesis to improve deep ECG classification. In: International Conference on Machine Learning, pp. 3597–3606. PMLR
- Guijo-Rubio D, Duran-Rosal AM, Gutierrez PA, Troncoso A, Hervas Martinez C (2020) Time-series clustering based on the characterization of segment typologies. IEEE transactions on cybernetics [DOI] [PubMed]
- Gunturi VM, Shekhar S. Big spatio-temporal network data analytics for smart cities research needs. Berlin: Seeing cities through big data. Springer; 2017. pp. 127–140. [Google Scholar]
- Guo A, Kamar E, Wortman Vaughan J, Wallach H, Morris MR (2019) Toward fairness in ai for people with disabilities: a research roadmap. In: ASSETS 2019 Workshop on AI Fairness for People with Disabilities. ACM
- Guo H. Big earth data a new frontier in earth and information sciences. Big Earth Data. 2017;1(1–2):4–20. [Google Scholar]
- Gutiérrez-Gómez L, Bovet A, Delvenne JC. Multi-scale anomaly detection on attributed networks. Proceedings of the AAAI conference on artificial intelligence. 2020;34:678–685. [Google Scholar]
- Hamdi A, Kim DY, Salim F (2020) flexgrid2vec: Learning efficient visual representations vectors. arXiv e-prints pp. arXiv–2007
- Hamdi A, Salim F, Kim DY (2020) Drotrack: High-speed drone-based object tracking under uncertainty. In: 2020 IEEE international conference on fuzzy systems (FUZZ-IEEE), pp. 1–8
- Hamdi A, Shaban K, Zainal A. Clasenti: a class-specific sentiment analysis framework. ACM Trans Asian Low-Resour Lang Inf Process. 2018 doi: 10.1145/3209885. [DOI] [Google Scholar]
- Hamdi A, Salim FD, Kim DY, Neiat AG, Bouguettaya A (2021) Drone-as-a-service composition under uncertainty. IEEE Transactions on Services Computing
- Han B, Liu L, Omiecinski E. Road-network aware trajectory clustering: integrating locality, flow, and density. IEEE Trans Mobile Comput. 2015;14(2):416–429. [Google Scholar]
- Hanke D, Freuling CM, Fischer S, Hueffer K, Hundertmark K, Nadin-Davis S, Marston D, Fooks AR, Bøtner A, Mettenleiter TC. Spatio-temporal analysis of the genetic diversity of arctic rabies viruses and their reservoir hosts in Greenland. PLoS Negl Trop Dis. 2016;10(7):e0004779. doi: 10.1371/journal.pntd.0004779. [DOI] [PMC free article] [PubMed] [Google Scholar]
- Harris P, Brunsdon C, Charlton M, Juggins S, Clarke A. Multivariate spatial outlier detection using robust geographically weighted methods. Math Geosci. 2014;46(1):1–31. [Google Scholar]
- Hazeleger W, Guemas V, Wouters B, Corti S, Andreu-Burillo I, Doblas-Reyes F, Wyser K, Caian M. Multiyear climate predictions using two initialization strategies. Geophys Res Lett. 2013;40(9):1794–1798. [Google Scholar]
- He Z, Chow CY, Zhang JD. Stann: a spatio-temporal attentive neural network for traffic prediction. IEEE Access. 2019;7:4795–4806. [Google Scholar]
- Helmi S, Banaei-Kashani F (2017) Efficient processing of spatiotemporal pattern queries on historical frequent co-movement pattern datasets. In: International workshop on mobility analytics for spatio-temporal and social data, pp. 122–137. Springer
- Hens C, Harush U, Haber S, Cohen R, Barzel B (2019) Spatiotemporal signal propagation in complex networks. Nat Phys. p. 1
- Ho HC, Wong MS, Yang L, Shi W, Yang J, Bilal M, Chan TC. Spatiotemporal influence of temperature, air quality, and urban environment on cause-specific mortality during hazy days. Environ Int. 2018;112:10–22. doi: 10.1016/j.envint.2017.12.001. [DOI] [PubMed] [Google Scholar]
- Hochman N, Schwartz R (2012) Visualizing instagram: tracing cultural visual rhythms. In: Sixth International AAAI conference on weblogs and social media
- Horrace WC, Rohlin SM. How dark is dark? Bright lights, big city, racial profiling. Rev Econ Stat. 2016;98(2):226–232. [Google Scholar]
- Hu F, Yang C, Schnase JL, Duffy DQ, Xu M, Bowen MK, Lee T, Song W. Climatespark: an in-memory distributed computing framework for big climate data analytics. Comput Geosci. 2018;115:154–166. [Google Scholar]
- Hu P, Wang G, Kong X, Kuen J, Tan YP (2018) Motion-guided cascaded refinement network for video object segmentation. In: Proceedings of the IEEE conference on computer vision and pattern recognition, pp. 1400–1409 [DOI] [PubMed]
- Hu YT, Chen HS, Hui K, Huang JB, Schwing AG (2019) Sail-vos: semantic amodal instance level video object segmentation - a synthetic dataset and baselines. In: The IEEE conference on computer vision and pattern recognition (CVPR)
- Hu YT, Chen HS, Hui K, Huang JB, Schwing AG (2019) Sail-vos: Semantic amodal instance level video object segmentation-a synthetic dataset and baselines. In: Proceedings of the IEEE conference on computer vision and pattern recognition, pp. 3105–3115
- Hu YT, Huang JB, Schwing AG (2018) Unsupervised video object segmentation using motion saliency-guided spatio-temporal propagation. In: Proceedings of the European conference on computer vision (ECCV), pp. 786–802
- Huang J, Zhou W. Re 2 ema: regularized and reinitialized exponential moving average for target model update in object tracking. Proceedings of the AAAI Conference on Artificial Intelligence. 2019;33:8457–8464. [Google Scholar]
- Huang Y, Cai X, Zhang B, Zhu G, Liu T, Guo P, Xiao J, Li X, Zeng W, Hu J, et al. Spatiotemporal heterogeneity of social contact patterns related to infectious diseases in the Guangdong province. China. Sci Rep. 2020;10(1):1–10. doi: 10.1038/s41598-020-63383-z. [DOI] [PMC free article] [PubMed] [Google Scholar]
- Huang Y, Chen C, Dong P (2008) Modeling herds and their evolvements from trajectory data. In: International conference on geographic information science, Springer. pp. 90–105
- Huntington HP, Daniel R, Hartsig A, Harun K, Heiman M, Meehan R, Noongwook G, Pearson L, Prior-Parks M, Robards M, et al. Vessels, risks, and rules: planning for safe shipping in Bering strait. Mar Policy. 2015;51:119–127. [Google Scholar]
- Islam MJ, Xu K, Wong BLW. Uncertainty of visualizations for sense making in criminal intelligence analysis. In: Lawonn K, Smit N, Linsen L, Kosara R, editors. EuroVis workshop on reproducibility, verification, and validation in visualization (EuroRV3) Norrkoping: The Eurographics Association; 2018. [Google Scholar]
- Jang K, Kim K, Kim HY, Kang S (2017) A multi-level analysis of the relationship between urban built environment and severe injury traffic crashes. KSCE J Civil Eng. pp. 1–9
- Jeawak SS, Jones CB, Schockaert S. Predicting environmental features by learning spatiotemporal embeddings from social media. Ecol Inf. 2020;55:101031. [Google Scholar]
- Ji YX, Huang L, He HP, Wang CD, Xie G, Shi W, Lin KY (2019) Multi-view outlier detection in deep intact space. In: 2019 IEEE international conference on data mining (ICDM). IEEE. pp. 1132–1137
- Jia X, Khandelwal A, Nayak G, Gerber J, Carlson K, West P, Kumar V (2017) Incremental dual-memory lstm in land cover prediction. In: Proceedings of the 23rd ACM SIGKDD international conference on knowledge discovery and data mining, pp. 867–876. ACM
- Jiang L, Zhang X, Zuo W, Xu H, Zhao J, Qiu X, Tian Y, Zhu Y. A neural network method for the reconstruction of winter wheat yield series based on spatio-temporal heterogeneity. Comput Electr Agric. 2018;154:46–53. [Google Scholar]
- Jiang Z, Shekhar S. Spatial and spatiotemporal big data science. Cham: Springer; 2017. [Google Scholar]
- Jones ES, Soatto S. Visual-inertial navigation, mapping and localization: a scalable real-time causal approach. Int J Robot Res. 2011;30(4):407–430. [Google Scholar]
- Kadar C, Maculan R, Feuerriegel S. Public decision support for low population density areas: an imbalance-aware hyper-ensemble for spatio-temporal crime prediction. Decis Support Syst. 2019;119:107. [Google Scholar]
- Kaltenbrunner A, Meza R, Grivolla J, Codina J, Banchs R. Urban cycles and mobility patterns: exploring and predicting trends in a bicycle-based public transport system. Pervasive Mobile Comput. 2010;6(4):455–466. [Google Scholar]
- Kang C, Shi L, Wang F, Liu Y (2020) How urban places are visited by social groups? Evidence from matrix factorization on mobile phone data. Transactions (in GIS)
- Kang HJ, Kawasawa YI, Cheng F, Zhu Y, Xu X, Li M, Sousa AM, Pletikos M, Meyer KA, Sedmak G. Spatiotemporal transcriptome of the human brain. Nature. 2011;478(7370):483. doi: 10.1038/nature10523. [DOI] [PMC free article] [PubMed] [Google Scholar]
- Kart U, Lukezic A, Kristan M, Kamarainen JK, Matas J (2019) Object tracking by reconstruction with view-specific discriminative correlation filters. In: The IEEE conference on computer vision and pattern recognition (CVPR)
- Kastner JH, Samet H (2020) Visualizing spatiotemporal keyword trends in online news articles. In: Proceedings of the 28th international conference on advances in geographic information systems, pp. 195–198
- Kaur M, Salim FD, Ren Y, Chan J, Tomko M, Sanderson M (2018) Shopping intent recognition and location prediction from cyber-physical activities via Wi-Fi logs. In: Proceedings of the 5th conference on systems for built environments, pp. 130–139. ACM
- Khan D, Rossen LM, Hamilton BE, He Y, Wei R, Dienes E. Hot spots, cluster detection and spatial outlier analysis of teen birth rates in the us, 2003–2012. Spat Spatio Temp Epidemiol. 2017;21:67–75. doi: 10.1016/j.sste.2017.03.002. [DOI] [PMC free article] [PubMed] [Google Scholar]
- Khan N, Alsaqer M, Shah H, Badsha G, Abbasi AA, Salehian S (2018) The 10 vs, issues and challenges of big data. In: Proceedings of the 2018 international conference on big data and education, ICBDE ’18, pp. 52–56. ACM, New York, NY, USA
- Khandelwal A, Karpatne A, Marlier ME, Kim J, Lettenmaier DP, Kumar V. An approach for global monitoring of surface water extent variations in reservoirs using Modis data. Remote Sens Environ. 2017;202:113–128. [Google Scholar]
- Khoirunurrofik K. Trends and determinants of the geographic distribution of economic activities evidence from Indonesian manufacturing. J Indones Appl Econ. 2017;7(1):18–47. [Google Scholar]
- Kim KS, Kojima I, Ogawa H. Discovery of local topics by using latent spatio-temporal relationships in geo-social media. Int J Geogr Inf Sci. 2016;30(9):1899–1922. [Google Scholar]
- Kim T, Yue Y, Taylor S, Matthews I (2015) A decision tree framework for spatiotemporal sequence prediction. In: Proceedings of the 21th ACM SIGKDD international conference on knowledge discovery and data mining, KDD ’15, ACM, New York, NY, USA, pp. 577–586
- Kim TH, Sajjadi MS, Hirsch M, Schölkopf B (2018) Spatio-temporal transformer network for video restoration. In: European conference on computer vision. Springer, pp. 111–127
- Kisilevich S, Mansmann F, Nanni M, Rinzivillo S. Spatio-temporal clustering. Boston: Springer; 2009. pp. 855–874. [Google Scholar]
- Kobayashi T, Miller H. Exploratory visualization of collective mobile objects data using temporal granularity and spatial similarity. New York: Springer; 2014. pp. 127–154. [Google Scholar]
- Koperski K, Adhikary J, Han J (1996) Spatial data mining: progress and challenges survey paper. In: Proceedings of the ACM SIGMOD workshop on research issues on data mining and knowledge discovery, Montreal, Canada, Citeseer, pp. 1–10
- Kotevska O, Kusne AG, Samarov DV, Lbath A, Battou A. Dynamic network model for smart city data-loss resilience case study city-to-city network for crime analytics. IEEE Access. 2017;5:20524–20535. doi: 10.1109/ACCESS.2017.2757841. [DOI] [PMC free article] [PubMed] [Google Scholar]
- Koylu C. Modeling and visualizing semantic and spatio-temporal evolution of topics in interpersonal communication on twitter. Int J Geogr Inf Sci. 2019;33(4):805–832. [Google Scholar]
- Krishnan S, Dhillon HS. Spatio-temporal interference correlation and joint coverage in cellular networks. IEEE Trans Wirel Commun. 2017;16(9):5659–5672. [Google Scholar]
- Kristan M, Pflugfelder R, Leonardis A, Matas J, Čehovin L, Nebehay G, Vojíř T, Fernández G, Lukežič A, Dimitriev A, Petrosino A, Saffari A, Li B, Han B, Heng C, Garcia C, Pangeršič D, Häger G, Khan FS, Oven F, Possegger H, Bischof H, Nam H, Zhu J, Li J, Choi JY, Choi JW, Henriques JF, van de Weijer J, Batista J, Lebeda K, Öfjäll K, Yi KM, Qin L, Wen L, Maresca ME, Danelljan M, Felsberg M, Cheng MM, Torr P, Huang Q, Bowden R, Hare S, Lim SY, Hong S, Liao S, Hadfield S, Li SZ, Duffner S, Golodetz S, Mauthner T, Vineet V, Lin W, Li Y, Qi Y, Lei Z, Niu ZH (2015) The visual object tracking vot2014 challenge results. In: Agapito L, Bronstein MM, Rother C (Eds) Computer Vision - ECCV 2014 Workshops. Springer International Publishing, Cham, pp 191–217
- Kulldorff M. A spatial scan statistic. Commun Stat Theory Methods. 1997;26(6):1481–1496. [Google Scholar]
- Lakhdari A, Bouguettaya A (2020) Fluid composition of intermittent iot energy services. In: 2020 IEEE International Conference on Services Computing (SCC). IEEE, pp 329–336
- La Sorte FA, Fink D, Hochachka WM, Kelling S. Convergence of broad-scale migration strategies in terrestrial birds. Proc R Soc B. 2016;283(1823):2015–2588. doi: 10.1098/rspb.2015.2588. [DOI] [PMC free article] [PubMed] [Google Scholar]
- Le XH, Lee G, Jung K, An Hu, Lee S, Jung Y. Application of convolutional neural network for spatiotemporal bias correction of daily satellite-based precipitation. Remote Sens. 2020;12(17):2731. [Google Scholar]
- Lee EC, Asher JM, Goldlust S, Kraemer JD, Lawson AB, Bansal S. Mind the scales harnessing spatial big data for infectious disease surveillance and inference. J Infect Dis. 2016;214(4):S409–S413. doi: 10.1093/infdis/jiw344. [DOI] [PMC free article] [PubMed] [Google Scholar]
- Lee JG, Han J, Li X, Gonzalez H. Traclass trajectory classification using hierarchical region-based and trajectory-based clustering. Proc VLDB Endow. 2008;1(1):1081–1094. [Google Scholar]
- Lee JG, Han J, Whang KY (2007) Trajectory clustering a partition-and-group framework. In: Proceedings of the 2007 ACM SIGMOD international conference on Management of data, pp. 593–604. ACM
- Legewie J. Racial profiling and use of force in police stops: how local events trigger periods of increased discrimination. Am J Sociol. 2016;122(2):379–424. [Google Scholar]
- Lei K, Ma T, Jia J, Zhang C, Yang Z (2019) Design and implementation of a disambiguity framework for smart voice controlled devices. In: Proceedings of the 28th international joint conference on artificial intelligence, pp. 6536–6538. AAAI Press
- Leong K, Sung A. A review of spatio-temporal pattern analysis approaches on crime analysis. Int E-J Crim Sci. 2015;9:1–33. [Google Scholar]
- Li D, Chen D, Jin B, Shi L, Goh J, Ng SK (2019) Mad-gan: Multivariate anomaly detection for time series data with generative adversarial networks. In: international conference on artificial neural networks. Springer, pp. 703–716
- Li F, Kim T, Humayun A, Tsai D, Rehg JM (2013) Video segmentation by tracking many figure-ground segments. In: Proceedings of the IEEE international conference on computer vision, pp. 2192–2199
- Li H, Li G, Ji X, Shi L. Deep representation via convolutional neural network for classification of spatiotemporal event streams. Neurocomputing. 2018;299:1–9. [Google Scholar]
- Li J, Zhang T, Liu Q, Yu M. Predicting the visualization intensity for interactive spatio-temporal visual analytics a data-driven view-dependent approach. Int J Geogr Inf Sci. 2017;31(1):168–189. [Google Scholar]
- Li L, Xi Y, Ren F. Spatio-temporal distribution characteristics and trajectory similarity analysis of tuberculosis in Beijing, China. Int J Environ Res public Health. 2016;13(3):291. doi: 10.3390/ijerph13030291. [DOI] [PMC free article] [PubMed] [Google Scholar]
- Li R, Li B, Jin C, Xue X, Zhu X (2011) Tracking user-preference varying speed in collaborative filtering. In: Proceedings of the twenty-fifth AAAI conference on artificial intelligence, AAAI’11, pp. 133–138. AAAI
- Li S, Seybold B, Vorobyov A, Lei X, Jay Kuo CC (2018) Unsupervised video object segmentation with motion-based bilateral networks. In: Proceedings of the European conference on computer vision (ECCV), pp. 207–223
- Li S, Yeung DY (2017) Visual object tracking for unmanned aerial vehicles: a benchmark and new motion models. In: AAAI, pp. 4140–4146
- Li X, Change Loy C (2018) Video object segmentation with joint re-identification and attention-aware mask propagation. In: Proceedings of the European conference on computer vision (ECCV), pp. 90–105
- Li X, Zhao K, Cong G, Jensen CS, Wei W (2018) Deep representation learning for trajectory similarity computation. In: 2018 IEEE 34th international conference on data engineering (ICDE), pp. 617–628. IEEE
- Li Y, Yu M, Xu M, Yang J, Sha D, Liu Q, Yang C. Big data and cloud computing. Berlin: Springer; 2020. pp. 325–355. [Google Scholar]
- Liang X, Wang G, Min MR, Qi Y, Han Z (2019) A deep spatio-temporal fuzzy neural network for passenger demand prediction. In: The SIAM international conference on data mining
- Lin CY. A reversible privacy-preserving clustering technique based on k-means algorithm. Appl Soft Comput. 2020;87:105995. [Google Scholar]
- Lin CY, Kao YH, Lee WB, Chen RC. An efficient reversible privacy-preserving data mining technology over data streams. SpringerPlus. 2016;5(1):1407. doi: 10.1186/s40064-016-3095-3. [DOI] [PMC free article] [PubMed] [Google Scholar]
- Ling S, Li J, Che Z, Min X, Zhai G, Le Callet P. Quality assessment of free-viewpoint videos by quantifying the elastic changes of multi-scale motion trajectories. IEEE Trans Image Process. 2020;30:517–531. doi: 10.1109/TIP.2020.3037504. [DOI] [PubMed] [Google Scholar]
- Linke AM, Witmer FD, Holland EC, O’Loughlin J. Mountainous terrain and civil wars geospatial analysis of conflict dynamics in the post-soviet caucasus. Ann Am Ass Geogr. 2017;107(2):520–535. [Google Scholar]
- Liu CY, Zhou C, Wu J, Hu Y, Guo L (2018) Social recommendation with an essential preference space. In: Thirty-second AAAI conference on artificial intelligence
- Liu H, Wu H, Sun W, Lee I (2019) Spatio-temporal gru for trajectory classification. In: 2019 IEEE international conference on data mining (ICDM). IEEE, pp. 1228–1233
- Liu J, Kuang W, Zhang Z, Xu X, Qin Y, Ning J, Zhou W, Zhang S, Li R, Yan C. Spatiotemporal characteristics, patterns, and causes of land-use changes in China since the late 1980s. J Geogr Sciences. 2014;24(2):195–210. [Google Scholar]
- Liu L, Qiao S, Zhang Y, Hu J. An efficient outlying trajectories mining approach based on relative distance. Int J Geogr Inf Sci. 2012;26(10):1789–1810. [Google Scholar]
- Liu S, Liu H, Bi H, Mao T (2020) Col-gan: Plausible and collision-less trajectory prediction by attention-based gan. IEEE Access
- Liu Y, Huang J, Zhou C, Cai D, Hua, XS (2017) Spatiotemporal multi-task network for human activity understanding. In: Proceedings of the on thematic workshops of ACM multimedia 2017, thematic workshops ’17, ACM, New York, NY, USA. pp. 287–295
- de Lucca Siqueira F, Bogorny V. Discovering chasing behavior in moving object trajectories. Trans GIS. 2011;15(5):667–688. [Google Scholar]
- Lv M, Chen L, Chen G (2012) Discovering personally semantic places from gps trajectories. In: Proceedings of the 21st ACM international conference on information and knowledge management, CIKM ’12, ACM, New York, NY, USA. pp. 1552–1556
- Lynch M, Omori M, Roussell A, Valasik M. Policing the ‘progressive’city: the racialized geography of drug law enforcement. Theor Criminol. 2013;17(3):335–357. [Google Scholar]
- Maciąg PS, Kryszkiewicz M, Bembenik R. Discovery of closed spatio-temporal sequential patterns from event data. Proc Comput Sci. 2019;159:707–716. [Google Scholar]
- Mack VZW, Kam TS (2018) Is there space for violence?: A data-driven approach to the exploration of spatial-temporal dimensions of conflict. In: Proceedings of the 2Nd ACM SIGSPATIAL workshop on geospatial humanities, geohumanities’18. ACM, New York, NY, USA. pp. 1:1–1:10
- Maire M, Yu SX, Perona P (2013) Hierarchical scene annotation
- Malik A, Maciejewski R, Towers S, McCullough S, Ebert DS. Proactive spatiotemporal resource allocation and predictive visual analytics for community policing and law enforcement. IEEE Trans Vis Comp Gr. 2014;20(12):1863–1872. doi: 10.1109/TVCG.2014.2346926. [DOI] [PubMed] [Google Scholar]
- Mazimpaka JD, Timpf S (2016) A visual and computational analysis approach for exploring significant locations and time periods along a bus route. In: Proceedings of the 9th ACM SIGSPATIAL international workshop on computational transportation science, IWCTS ’16, ACM, New York, NY, USA. pp. 43–48
- Meehl GA, Goddard L, Boer G, Burgman R, Branstator G, Cassou C, Corti S, Danabasoglu G, Doblas-Reyes F, Hawkins E, et al. Decadal climate prediction: an update from the trenches. Bull Am Meteorol Soc. 2014;95(2):243–267. [Google Scholar]
- Meentemeyer RK, Cunniffe NJ, Cook AR, Filipe JA, Hunter RD, Rizzo DM, Gilligan CA. Epidemiological modeling of invasion in heterogeneous landscapes spread of sudden oak death in California (1990–2030) Ecosphere. 2011;2(2):1–24. [Google Scholar]
- Mehrjoo S, Khunjush F. Accurate compressive data gathering in wireless sensor networks using weighted spatio-temporal compressive sensing. Telecommun Syst. 2018;68(1):79–88. [Google Scholar]
- Meng F, Yuan G, Lv S, Wang Z, Xia S (2018) An overview on trajectory outlier detection. Artif Intell Rev. pp. 1–20
- Miller HJ, Han J. Geographic data mining and knowledge discovery. Boca Raton: CRC Press; 2009. [Google Scholar]
- Mohan P, Shekhar S, Shine JA, Rogers JP. Cascading spatio-temporal pattern discovery. IEEE Trans Knowl Data Eng. 2012;24(11):1977–1992. [Google Scholar]
- Mueller M, Smith N, Ghanem B (2016) A benchmark and simulator for UAV tracking. In: European conference on computer vision. Springer, pp. 445–461
- Murray AT, Grubesic TH, Wei R, Mack EA. A hybrid geocoding methodology for spatio-temporal data. Trans GIS. 2011;15(6):795–809. [Google Scholar]
- Ndehedehe CE, Awange JL, Corner RJ, Kuhn M, Okwuashi O. On the potentials of multiple climate variables in assessing the spatio-temporal characteristics of hydrological droughts over the volta basin. Sci Total Environ. 2016;557:819–837. doi: 10.1016/j.scitotenv.2016.03.004. [DOI] [PubMed] [Google Scholar]
- Neiat AG, Bouguettaya A, Sellis T, Ye Z (2014) Spatio-temporal composition of sensor cloud services. In: Web Services (ICWS), 2014 IEEE international conference on. IEEE. pp. 241–248
- Nelson JK, Brewer CA. Evaluating data stability in aggregation structures across spatial scales revisiting the modifiable areal unit problem. Cartogr Geogr Inf Sci. 2017;44(1):35–50. [Google Scholar]
- Nguyen H, Liu W, Chen F. Discovering congestion propagation patterns in spatio-temporal traffic data. IEEE Trans Big Data. 2017;3(2):169–180. [Google Scholar]
- Novel CPRE. The epidemiological characteristics of an outbreak of 2019 novel coronavirus diseases (covid-19) in china. China CDC Wkly. 2020;41(2):145. [PMC free article] [PubMed] [Google Scholar]
- Ochs P, Malik J, Brox T. Segmentation of moving objects by long term video analysis. IEEE Trans Pattern Anal Mach Intell. 2013;36(6):1187–1200. doi: 10.1109/TPAMI.2013.242. [DOI] [PubMed] [Google Scholar]
- Olteanu A, Diaz F, Kazai G (2020) When are search completion suggestions problematic? In: Computer supported collaborative work and social computing (CSCW). ACM. CSCW 2020 Honorable Mention
- Openshaw S (1983) The modifiable areal unit problem. Geo Abstracts University of East Anglia
- Pan F, Ye T, Sun P, Gui S, Liang B, Li L, Zheng D, Wang J, Hesketh RL, Yang L, et al. (2020) Time course of lung changes on chest CT during recovery from 2019 novel coronavirus (Covid-19) pneumonia. Radiology p. 200370 [DOI] [PMC free article] [PubMed]
- Pandey AC, Kulhari A. Semi-supervised spatiotemporal classification and trend analysis of satellite images. Singapore: Springer; 2018. pp. 353–363. [Google Scholar]
- Pattelli L, Savo R, Burresi M, Wiersma DS. Spatio-temporal visualization of light transport in complex photonic structures. Light Sci Appl. 2016;5(5):e16090. doi: 10.1038/lsa.2016.90. [DOI] [PMC free article] [PubMed] [Google Scholar]
- Pei T, Song C, Guo S, Shu H, Liu Y, Du Y, Ma T, Zhou C. Big geodata mining: objective, connotations and research issues. J Geogr Sci. 2020;30(2):251–266. [Google Scholar]
- Perazzi F, Pont-Tuset J, McWilliams B, Van Gool L, Gross M, Sorkine-Hornung A (2016) A benchmark dataset and evaluation methodology for video object segmentation. In: Proceedings of the IEEE conference on computer vision and pattern recognition, pp. 724–732
- Phan H, Maaß M, Mazur R, Mertins A. Random regression forests for acoustic event detection and classification. IEEE ACM Trans Audio Speech and Lang Proc. 2015;23(1):20–31. [Google Scholar]
- Phillips P, Lee I. Mining co-distribution patterns for large crime datasets. Expert Syst Appl. 2012;39(14):11556–11563. [Google Scholar]
- Pont-Tuset J, Perazzi F, Caelles S, Arbeláez P, Sorkine-Hornung A, Van Gool L (2017) The 2017 davis challenge on video object segmentation. arXiv preprint arXiv:1704.00675
- Poulakis MI, Vassaki S, Panagopoulos AD (2013) Satellite-based wireless sensor networks radio communication link design. In: Antennas and propagation (EuCAP), 2013 7th European conference on, pp. 2620–2624. IEEE
- Prest A, Leistner C, Civera J, Schmid C, Ferrari V (2012) Learning object class detectors from weakly annotated video. In: 2012 IEEE conference on computer vision and pattern recognition. IEEE. pp. 3282–3289
- Qi L, Zhang X, Li S, Wan S, Wen Y, Gong W. Spatial-temporal data-driven service recommendation with privacy-preservation. Inf Sci. 2020;515:91–102. [Google Scholar]
- Qingquan L, Deren L. Big data gis Wuhan Daxue Xuebao (Xinxi Kexue Ban) Geomat Inf Sci. 2014;39(6):641–644. [Google Scholar]
- Quick M, Law J, Li G (2017) Time-varying relationships between land use and crime a spatio-temporal analysis of small-area seasonal property crime trends. Environ plan B Urban Anal City Sci. p. 2399808317744779
- Radhakrishna V, Kumar PV, Janaki V, Aljawarneh S (2016) A similarity measure for outlier detection in timestamped temporal databases. In: Engineering & MIS (ICEMIS), International Conference on IEEE. pp. 1–5
- Raghavan M, Barocas S, Kleinberg J, Levy K (2020) Mitigating bias in algorithmic hiring: evaluating claims and practices. In: Proceedings of the 2020 conference on fairness, accountability, and transparency, pp. 469–481
- Rahaman MS, Hamilton M, Salim FD (2017) Predicting imbalanced taxi and passenger queue contexts in airport. In: Proceedings of the Pacific Asia Conference on Information Systems (PACIS)
- Rahaman MS, Ren Y, Hamilton M, Salim FD. Wait time prediction for airport taxis using weighted nearest neighbor regression. IEEE Access. 2018;6:74660–74672. [Google Scholar]
- Rahaman N, Goyal A, Gondal MW, Wuthrich M, Bauer S, Sharma Y, Bengio Y, Schölkopf B (2020) S2rms: spatially structured recurrent modules. arXiv preprint arXiv:2007.06533
- Rao KV, Govardhan A, Rao KC. Spatiotemporal data mining issues, tasks and applications. Int J Comput Sci Eng Surv. 2012;3(1):39. [Google Scholar]
- Rashidi P, Wang T, Skidmore A, Vrieling A, Darvishzadeh R, Toxopeus B, Ngene S, Omondi P. Spatial and spatiotemporal clustering methods for detecting elephant poaching hotspots. Ecol Modell. 2015;297:180–186. [Google Scholar]
- Ratcliffe J. Crime mapping: spatial and temporal challenges. New York: Springer; 2010. pp. 5–24. [Google Scholar]
- Ratcliffe JH. Aoristic signatures and the spatio-temporal analysis of high volume crime patterns. J Quant Criminol. 2002;18(1):23–43. [Google Scholar]
- Ren Y, Tomko M, Salim FD, Chan J, Clarke CL, Sanderson M. A location-query-browse graph for contextual recommendation. IEEE Trans Knowl Data Eng. 2018;30(2):204–218. [Google Scholar]
- Rettig L, Khayati M, Cudré-Mauroux P, Piorkowski M (2015) Online anomaly detection over big data streams. In: Big Data (Big Data), 2015 IEEE international conference on. IEEE. pp. 1113–1122
- Reza RM, Watson BA (2019) Hi-d maps: An interactive visualization technique for multi-dimensional categorical data. In: 2019 IEEE visualization conference (VIS). IEEE. pp. 216–220
- Ribeiro MT, Singh S, Guestrin C (2016) “ why should i trust you” explaining the predictions of any classifier. In: Proceedings of the 22nd ACM SIGKDD international conference on knowledge discovery and data mining, pp. 1135–1144
- Richardson R, Schultz JM, Crawford K. Dirty data, bad predictions: how civil rights violations impact police data, predictive policing systems, and justice. NYUL Rev. 2019;94:15. [Google Scholar]
- Rigby J, Boyle M, Brunsdon C, Charlton M, Dorling D, Foley R, French W. Towards a geography of health inequalities in Ireland. Irish Geogr. 2017;50(1):37. [Google Scholar]
- Rizwan M, Wan W, Gwiazdzinski L. Visualization, spatiotemporal patterns, and directional analysis of urban activities using geolocation data extracted from IBSN. ISPRS Int J Geo-Inf. 2020;9(2):137. [Google Scholar]
- Romano B, Jiang Z (2017) Visualizing traffic accident hotspots based on spatial-temporal network kernel density estimation. In: Proceedings of the 25th ACM SIGSPATIAL international conference on advances in geographic information systems, SIGSPATIAL ’17. ACM, New York, NY, USA, pp. 98:1–98:4
- Roth RE, Ross KS, Finch BG, Luo W, MacEachren AM. Spatiotemporal crime analysis in us law enforcement agencies current practices and unmet needs. Gov Inf Q. 2013;30(3):226–240. [Google Scholar]
- Rumi SK, Deng K, Salim FD. Crime event prediction with dynamic features. EPJ Data Sci. 2018;7(1):43. [Google Scholar]
- Rumi SK, Deng K, Salim FD (2018) Theft prediction with individual risk factor of visitors. In: Proceedings of the 26th ACM SIGSPATIAL international conference on advances in geographic information systems, pp. 552–555. ACM
- Sadri A, Salim FD, Ren Y, Shao W, Krumm JC, Mascolo C. What will you do for the rest of the day?: An approach to continuous trajectory prediction. Proceedings of the ACM on interactive, mobile, wearable and ubiquitous technologies. 2018;2(4):186. [Google Scholar]
- Sagl G, Resch B, Hawelka B, Beinat E (2012) From social sensor data to collective human behaviour patterns analysing and visualising spatio-temporal dynamics in urban environments. In: Proceedings of the GI-Forum, Herbert Wichmann Verlag Berlin, pp. 54–63
- Sakaki T, Okazaki M, Matsuo Y (2010) Earthquake shakes twitter users real-time event detection by social sensors. In: Proceedings of the 19th international conference on World Wide Web, WWW ’10, ACM, New York, NY, USA, pp. 851–860
- Sakaue F, Sato J (2020) Active 3d motion visualization based on spatiotemporal light-ray integration. In: Proceedings of the IEEE/CVF conference on computer vision and pattern recognition, pp. 1980–1988
- Salcedo-Gonzalez M, Suarez-Paez J, Esteve M, Gómez JA, Palau CE. A novel method of spatiotemporal dynamic geo-visualization of criminal data, applied to command and control centers for public safety. ISPRS Int J Geo-Inf. 2020;9(3):160. [Google Scholar]
- Salehian S, Yan Y (2016) Comparison of spark resource managers and distributed file systems. In: 2016 IEEE International conferences on Big Data and Cloud Computing (BDCloud), Social Computing and Networking (SocialCom), Sustainable Computing and Communications (SustainCom)(BDCloud-SocialCom-SustainCom). IEEE. pp. 567–572
- Santos LA, Ferreira KR, de Queiroz GR, Vinhas L (2016) Spatiotemporal data representation in R., pp. 178–191
- Schwab P, Karlen W. Phonemd: learning to diagnose parkinson’s disease from smartphone data. Proc AAAI Conf Artif Intell. 2019;33:1118–1125. [Google Scholar]
- Sen R, Yu HF, Dhillon IS (2019) Think globally, act locally: A deep neural network approach to high-dimensional time series forecasting. In: H. Wallach, H. Larochelle, A. Beygelzimer, F. dAlché-Buc, E. Fox, R. Garnett (Eds.) Advances in Neural Information Processing Systems 32. Curran Associates, Inc., pp. 4837–4846
- Senaratne H, Broring A, Schreck T, Lehle D (2014) Moving on twitter using episodic hotspot and drift analysis to detect and characterise spatial trajectories. In: Proceedings of the 7th ACM SIGSPATIAL international workshop on location-based social networks, LBSN ’14, ACM, New York, NY, USA. pp. 23–30
- Sha D, Miao X, Lan H, Stewart K, Ruan S, Tian Y, Tian Y, Yang C (2020) Spatiotemporal analysis of medical resource deficiencies in the us under covid-19 pandemic. medRxiv [DOI] [PMC free article] [PubMed]
- Shaban KB, Kadri A, Rezk E. Urban air pollution monitoring system with forecasting models. IEEE Sens J. 2016;16(8):2598–2606. [Google Scholar]
- Shafran-Nathan R, Levy I, Levin N, Broday DM. Ecological bias in environmental health studies the problem of aggregation of multiple data sources. Air Qual Atmos Health. 2017;10(4):411–420. [Google Scholar]
- Shah Z, Martin P, Coiera E, Mandl KD, Dunn AG. Modeling spatiotemporal factors associated with sentiment on twitter: synthesis and suggestions for improving the identification of localized deviations. J Med Internet Res. 2019;21(5):e12881. doi: 10.2196/12881. [DOI] [PMC free article] [PubMed] [Google Scholar]
- Shahid N, Naqvi IH, Qaisar SB. Characteristics and classification of outlier detection techniques for wireless sensor networks in harsh environments a survey. Artif Intell Rev. 2015;43(2):193–228. [Google Scholar]
- Shao Wei Salim F, Chan J, Qin K, Ma J (2019) Onlineairtrajclus: an online aircraft trajectory clustering for tarmac situation awareness. In: 2019 IEEE international conference on pervasive computing and communications (PerCom), IEEE, pp. 190–203
- Shao W, Salim FD, Song A, Bouguettaya A. Clustering big spatiotemporal-interval data. IEEE Trans Big Data. 2016;2(3):190–203. [Google Scholar]
- Shekhar S, Jiang Z, Ali RY, Eftelioglu E, Tang X, Gunturi V, Zhou X. Spatiotemporal data mining a computational perspective. ISPRS Int J Geo-Inf. 2015;4(4):2306–2338. [Google Scholar]
- Shekhar S, Zhang P, Huang Y, Vatsavai R (2003) Trends in spatial data mining. in data mining next generation challenges and future directions p. 357-380
- Shen X, Efros AA, Aubry M (2019) Discovering visual patterns in art collections with spatially-consistent feature learning. In: The IEEE conference on computer vision and pattern recognition (CVPR)
- de Sherbinin A (2017) Remote sensing and socioeconomic data integration lessons from the NASA socioeconomic data and applications center. Integr Scale Remote Sens GIS. p. 371
- Shi X, Yeung DY (2018) Machine learning for spatiotemporal sequence forecasting: a survey. arXiv preprint arXiv:1808.06865
- Shirowzhan S, Lim S, Trinder J, Li H, Sepasgozar S. Data mining for recognition of spatial distribution patterns of building heights using airborne lidar data. Adv Eng Inf. 2020;43:101033. [Google Scholar]
- Shuai Y, Guo X, Wang H, Huang Z, Yang Y, Sun J, Wang J, Yang Y. Characterization of the bubble swarm trajectory in a jet bubbling reactor. AIChE J. 2019;65(5):e16565. [Google Scholar]
- Sinclair DF. On tests of spatial randomness using mean nearest neighbor distance. Ecology. 1985;66(3):1084–1085. [Google Scholar]
- Sokota S, D’Orazio R, Javed K, Haider H, Greiner R (2019) Simultaneous prediction intervals for patient-specific survival curves. In: Proceedings of the 28th international joint conference on artificial intelligence, IJCAI
- Song J, Andresen MA, Brantingham PL, Spicer V. Crime on the edges patterns of crime and land use change. Cartogr Geogr Inf Sci. 2017;44(1):51–61. [Google Scholar]
- Song W, Xiao Z, Wang Y, Charlin L, Zhang M, Tang J (2019) Session-based social recommendation via dynamic graph attention networks. In: Proceedings of the Twelfth ACM international conference on web search and data mining, pp. 555–563
- Sönmez Y, Kutlu H, Avci E. A novel approach in analyzing traffic flow by extreme learning machine method. Tehnički vjesnik. 2019;26(1):107–113. [Google Scholar]
- Steiger E, Resch B, Zipf A. Exploration of spatiotemporal and semantic clusters of twitter data using unsupervised neural networks. Int J Geogr Inf Sci. 2016;30(9):1694–1716. [Google Scholar]
- Steinle S, Reis S, Sabel CE. Quantifying human exposure to air pollution-moving from static monitoring to spatio-temporally resolved personal exposure assessment. Sci Total Environ. 2013;443:184–193. doi: 10.1016/j.scitotenv.2012.10.098. [DOI] [PubMed] [Google Scholar]
- Stewart Fotheringham A, Rogerson PA. Gis and spatial analytical problems. Int J Geogr Inf Sci. 1993;7(1):3–19. [Google Scholar]
- Sühr T, Biega AJ, Zehlike M, Gummadi KP, Chakraborty A (2019) Two-sided fairness for repeated matchings in two-sided markets: a case study of a ride-hailing platform. In: Proceedings of the 25th ACM SIGKDD international conference on knowledge discovery& data mining, KDD 19. ACM, New York, NY, USA. pp. 3082-3092
- Sun AY, Scanlon BR. How can big data and machine learning benefit environment and water management: a survey of methods, applications, and future directions. Environ Res Lett. 2019;14(7):073001. [Google Scholar]
- Taghavi E, Tharmarasa R, Kirubarajan T, Mcdonald M. Multisensor-multitarget bearing-only sensor registration. IEEE Trans Aerosp Electr Syst. 2016;52(4):1654–1666. [Google Scholar]
- Tan PN. Introduction to data mining. India: Pearson Education; 2006. [Google Scholar]
- Tan PN, Steinbach M, Kumar V. Introduction to data mining. 1. USA: Addison-Wesley Longman Publishing Co.Inc; 2006. [Google Scholar]
- Tang S, Andriluka M, Andres B, Schiele B (2017) Multiple people tracking by lifted multicut and person re-identification. In: Proceedings of the IEEE conference on computer vision and pattern recognition, pp. 3539–3548
- Thakkar P, Vala J, Prajapati V. Survey on outlier detection in data stream. Int J Comput Appl. 2016;136:13–16. [Google Scholar]
- Tokmakov P, Alahari K, Schmid C (2017) Learning motion patterns in videos. In: Proceedings of the IEEE conference on computer vision and pattern recognition, pp. 3386–3394
- Tominski C, Schumann H, Andrienko G, Andrienko N (2012) Stacking-based visualization of trajectory attribute data [DOI] [PubMed]
- Toole JL, Eagle N, Plotkin JB. Spatiotemporal correlations in criminal offense records. ACM Trans Intell Syst Technol (TIST) 2011;2(4):38. [Google Scholar]
- Tsai D, Flagg M, Nakazawa A, Rehg JM. Motion coherent tracking using multi-label MRF optimization. Int J Comput V. 2012;100(2):190–202. [Google Scholar]
- Tsou MH. Research challenges and opportunities in mapping social media and big data. Cartogr Geogr Inf Sci. 2015;42(sup1):70–74. [Google Scholar]
- Vahedian A, Zhou X, Tong L, Li Y, Luo J (2017) Forecasting gathering events through continuous destination prediction on big trajectory data. In: Proceedings of the 25th ACM SIGSPATIAL international conference on advances in geographic information systems, pp. 1–10
- Van Pelt R, Jacobs S, ter Haar Romeny BM, Vilanova A (2012) Visualization of 4d blood-flow fields by spatiotemporal hierarchical clustering. In: Computer graphics forum, vol. 31, pp. 1065–1074. Wiley Online Library
- Villars RL, Olofson CW, Eastwood M. Big data: what it is and why you should care. White Paper IDC. 2011;14:1–14. [Google Scholar]
- Wachowicz M, Ligtenberg A, Renso C, Gürses S. Characterising the next generation of mobile applications through a privacy-aware geographic knowledge discovery process. Berlin: Springer; 2008. pp. 39–72. [Google Scholar]
- Wachowicz M, Ong R, Renso C, Nanni M. Finding moving flock patterns among pedestrians through collective coherence. Int J Geogr Inf Sci. 2011;25(11):1849–1864. [Google Scholar]
- Wang H, Kifer D, Graif C, Li Z (2016) Crime rate inference with big data. In: Proceedings of the 22nd ACM SIGKDD international conference on knowledge discovery and data mining. ACM. pp. 635–644
- Wang S, Cao J, Yu P (2020) Deep learning for spatio-temporal data mining: a survey. IEEE transactions on knowledge and data engineering
- Wang S, Miao H, Chen H, Huang Z (2020) Multi-task adversarial spatial-temporal networks for crowd flow prediction. In: Proceedings of the 29th ACM international conference on information and knowledge management, pp. 1555–1564
- Wang S, Zhong E, Cai W, Zhou Q, Lu H, Gu Y, Yun W, Hu Z, Long L (2018) A visual analytics framework for big spatiotemporal data. In: Proceedings of the 2nd ACM SIGSPATIAL workshop on analytics for local events and news, pp. 1–5
- Wang W, Song H, Zhao S, Shen J, Zhao S, Hoi SCH, Ling H (2019) Learning unsupervised video object segmentation through visual attention. In: The IEEE conference on computer vision and pattern recognition (CVPR)
- Wang Z, Han T, Yu H. Research of MDCOP mining based on time aggregated graph for large spatio-temproal data sets. Comput Sci Inf Syst. 2019;16(3):891–914. [Google Scholar]
- Wang Z, Hu J, Fan Q (2018) Extracting the main routes and speed profiles between two locations from massive uncertain historical trajectories. In: 2018 International symposium in sensing and instrumentation in IoT era (ISSI). IEEE. pp. 1–5
- Wang Z, Xu J, He X, Wang Y. Analysis of spatiotemporal influence patterns of toxic gas monitoring concentrations in an urban drainage network based on IOT and GIS. Pattern Recognit Lett. 2020;138:237–246. [Google Scholar]
- Wang Z, Yuan X (2014) Urban trajectory timeline visualization. In: 2014 international conference on big data and smart computing (BIGCOMP), pp. 13–18
- Welch D, Bansal S, Hunter DR. Statistical inference to advance network models in epidemiology. Epidemics. 2011;3(1):38–45. doi: 10.1016/j.epidem.2011.01.002. [DOI] [PMC free article] [PubMed] [Google Scholar]
- Wen L, Du D, Li S, Bian X, Lyu S. Learning non-uniform hypergraph for multi-object tracking. Proceedings of the AAAI conference on artificial intelligence. 2019;33:8981–8988. [Google Scholar]
- Wen R, Yan W, Zhang AN, Chinh NQ, Akcan O (2016) Spatio-temporal route mining and visualization for busy waterways. In: Systems, man, and cybernetics (SMC), 2016 IEEE international conference on. IEEE. pp. 000849–000854
- Wu C, Zhu Q, Zhang Y, Du Z, Zhou Y, Xie X, He F. An adaptive organization method of geovideo data for spatio-temporal association analysis. ISPRS Ann Photogramm Remote Sens Spat Inf Sci. 2015;2(4):29. [Google Scholar]
- Wu Q, Jiang L, Gao X, Yang X, Chen G (2019) Feature evolution based multi-task learning for collaborative filtering with social trust. In: Proceedings of the 28th international joint conference on artificial intelligence. AAAI Press. pp. 3877–3883
- Wu Q, Zhang H, Gao X, He P, Weng P, Gao H, Chen G (2019) Dual graph attention networks for deep latent representation of multifaceted social effects in recommender systems. In: The World Wide Web Conference, pp. 2091–2102
- Wu Y, Lian D, Jin S, Chen E (2019) Graph convolutional networks on user mobility heterogeneous graphs for social relationship inference. In: Proceedings of the twenty-eighth international joint conference on artificial intelligence
- Wu Y, Lim J, Yang MH (2013) Online object tracking: a benchmark. In: Proceedings of the IEEE conference on computer vision and pattern recognition, pp. 2411–2418
- Xia T, Li Y, Yu Y, Xu F, Liao Q, Jin D (2020) Understanding urban dynamics via state-sharing hidden Markov model. IEEE Trans Knowl Data Eng
- Xu JM, Bhargava A, Nowak R, Zhu X (2012) Socioscope spatio-temporal signal recovery from social media. In: Joint European conference on machine learning and knowledge discovery in databases. Springer, pp. 644–659
- Xu K, Wen L, Li G, Bo L, Huang Q (2019) Spatiotemporal CNN for video object segmentation. In: The IEEE conference on computer vision and pattern recognition (CVPR)
- Xu N, Yang L, Fan Y, Yang J, Yue D, Liang Y, Price B, Cohen S, Huang T (2018) Youtube-vos: sequence-to-sequence video object segmentation. In: Proceedings of the European conference on computer vision (ECCV), pp. 585–601
- Xu S, Liu D, Bao L, Liu W, Zhou P (2019) Mhp-vos: multiple hypotheses propagation for video object segmentation. In: The IEEE conference on computer vision and pattern recognition (CVPR)
- Xue Y, Rodriguez S, Bogdan P (2016) A spatio-temporal fractal model for a cps approach to brain-machine-body interfaces. In: Proceedings of the 2016 conference on design, automation & test in Europe. EDA Consortium. pp. 642–647
- Yadamjav ME, Bao Z, Choudhury FM, Samet H, Zheng B (2019) Querying continuous recurrent convoys of interest. In: Proceedings of the 27th ACM SIGSPATIAL international conference on advances in geographic information systems, pp. 436–439
- Yang C, Clarke K, Shekhar S, Tao CV (2019) Big spatiotemporal data analytics: a research and innovation frontier. Int J Geogr Inf Sci
- Yang C, Clarke K, Shekhar S, Tao CV. Big spatiotemporal data analytics: a research and innovation frontier. Int J Geogr Inf Sci. 2020;34(6):1075–1088. [Google Scholar]
- Yang C, Goodchild M, Huang Q, Nebert D, Raskin R, Xu Y, Bambacus M, Fay D. Spatial cloud computing: how can the geospatial sciences use and help shape cloud computing? Int J Dig Earth. 2011;4(4):305–329. [Google Scholar]
- Yang S, Ma W, Pi X, Qian S. A deep learning approach to real-time parking occupancy prediction in transportation networks incorporating multiple spatio-temporal data sources. Transp Res Part C Emerg Technol. 2019;107:248–265. [Google Scholar]
- Yang Y, Xu Y, Han J, Wang E, Chen W, Yue L. Efficient traffic congestion estimation using multiple spatio-temporal properties. Neurocomputing. 2017;267:344. [Google Scholar]
- Yao H, Wu F, Ke J, Tang X, Jia Y, Lu S, Gong P, Ye J, Li Z (2018) Deep multi-view spatial-temporal network for taxi demand prediction. In: Thirty-second AAAI conference on artificial intelligence
- Yao X, Mokbel MF, Ye S, Li G, Alarabi L, Eldawy A, Zhao Z, Zhao L, Zhu D. Landqv2: A mapreduce-based system for processing arable land quality big data. ISPRS Int J Geo-Inf. 2018;7(7):271. [Google Scholar]
- Yates PM, Heupel MR, Tobin AJ, Simpfendorfer CA. Spatio-temporal occurrence patterns of young sharks in tropical coastal waters. Estuaries Coasts. 2015;38(6):2019–2030. [Google Scholar]
- Yawen H, Fenzhen S, Yunyan D, Rulin X (2010) Web-based visualization of marine environment data. In: Geoinformatics, 2010 18th international conference on. IEEE. pp. 1–6
- Ye F, Wang H, Ouyang S, Tang X, Li Z, Prakash M (2012) Spatio-temporal analysi s and visualization using sph for dam-break and flood disasters in a gis environment. In: Geomatics for integrated water resources management (GIWRM), 2012 international symposium on, IEEE. pp. 1–6
- Yi F, Yu Z, Zhuang F, Guo B (2019) Neural network based continuous conditional random field for fine-grained crime prediction. In: Proceedings of the twenty-eighth international joint conference on artificial intelligence, IJCAI, pp. 10–16
- Yin S, Wang S, Peng G, Chen X, Pan B (2019) Capturing spatial and temporal patterns for facial landmark tracking through adversarial learning. In: Proceedings of the 28th international joint conference on artificial intelligence. AAAI Press. pp. 1010–1017
- Ying JJC, Lee WC, Weng TC, Tseng VS (2011) Semantic trajectory mining for location prediction. In: Proceedings of the 19th ACM SIGSPATIAL international conference on advances in geographic information systems, ACM. pp. 34–43
- Yu H, Li G, Su L, Zhong B, Yao H, Huang Q. Conditional GAN based individual and global motion fusion for multiple object tracking in UAV videos. Pattern Recognit Lett. 2020;131:219–226. [Google Scholar]
- Yu H, Li Z, Zhang G, Liu P, Wang J. Extracting and predicting taxi hotspots in spatiotemporal dimensions using conditional generative adversarial neural networks. IEEE Trans Veh Technol. 2020;69(4):3680–3692. [Google Scholar]
- Yu R, Cheng D, Liu Y (2015) Accelerated online low rank tensor learning for multivariate spatiotemporal streams. In: International conference on machine learning, pp. 238–247
- Yu R, Li Y, Shahabi C, Demiryurek U, Liu Y (2017) Deep learning: a generic approach for extreme condition traffic forecasting. In: Proceedings of the 2017 SIAM international conference on data mining. SIAM. pp. 777–785
- Yu R, Liu Y (2017) Spatiotemporal analysis of social media data. In: Encyclopedia of GIS
- Yuan G, Xia S, Zhang L, Zhou Y, Ji C. Trajectory outlier detection algorithm based on structural features. J Comput Inf Syst. 2011;7(11):4137–4144. [Google Scholar]
- Yuan Q, Shen H, Li T, Li Z, Li S, Jiang Y, Xu H, Tan W, Yang Q, Wang J et al (2020) Deep learning in environmental remote sensing: achievements and challenges. Remote Sens Environ. Vol. 241
- Yunus AP, Fan X, Tang X, Jie D, Xu Q, Huang R (2020) Decadal vegetation succession from modis reveals the spatio-temporal evolution of post-seismic landsliding after the 2008 wenchuan earthquake. Remote Sens Environ. Vol. 236
- Zeng W, Lin C, Lin J, Jiang J, Xia J, Turkay C, Chen W (2020) Revisiting the modifiable areal unit problem in deep traffic prediction with visual analytics. IEEE Trans V Comput Gr [DOI] [PubMed]
- Zhang D, Lee K, Lee I (2015) Periodic pattern mining for spatio-temporal trajectories a survey. In: Intelligent systems and knowledge engineering (ISKE), 2015 10th international conference on, IEEE. pp. 306–313
- Zhang D, Lee K, Lee I. Hierarchical trajectory clustering for spatio-temporal periodic pattern mining. Expert Syst Appl. 2018;92:1–11. [Google Scholar]
- Zhang D, Li N, Zhou ZH, Chen C, Sun L, Li S (2011) ibat detecting anomalous taxi trajectories from gps traces. In: Proceedings of the 13th international conference on Ubiquitous computing. ACM. pp. 99–108
- Zhang J, Zheng Y, Qi D (2017) Deep spatio-temporal residual networks for citywide crowd flows prediction. In: Proceedings of the thirty-first AAAI conference on artificial intelligence (AAAI-17), AAAI. pp. 1655–1661
- Zhang J, Zheng Y, Qi D, Li R, Yi X (2016) Dnn-based prediction model for spatio-temporal data. In: Proceedings of the 24th ACM SIGSPATIAL international conference on advances in geographic information systems, pp. 1–4
- Zhang J, Zheng Y, Qi D, Li R, Yi X, Li T. Predicting citywide crowd flows using deep spatio-temporal residual networks. Artif Intell. 2018;259:147–166. [Google Scholar]
- Zhang J, Zheng Y, Sun J, Qi D. Flow prediction in spatio-temporal networks based on multitask deep learning. IEEE Trans Knowl Data Eng. 2019;32:468. [Google Scholar]
- Zhang P, Liu W, Wang D, Lei Y, Wang H, Shen C, Lu H (2020) Non-rigid object tracking via deep multi-scale spatial-temporal discriminative saliency maps. Pattern Recognit. Vol 100
- Zhang Q, Yang LT, Chen Z, Li P. A survey on deep learning for big data. Inf Fusion. 2018;42:146–157. [Google Scholar]
- Zhang X, Xie L, Wang Z, Zhou J, Boosted trajectory calibration for traffic state estimation. In: IEEE international conference on data mining (ICDM). IEEE 2019:866–875
- Zhang Y, Meratnia N, Havinga PJ. Outlier detection techniques for wireless sensor networks: a survey. IEEE Commun Surv Tutor. 2010;12(2):159–170. [Google Scholar]
- Zhang Y, Yang X, Ivy J, Chi M (2019) Attain: attention-based time-aware lstm networks for disease progression modeling. In: Proceedings of the 28th international joint conference on artificial intelligence, IJCAI, pp. 10–16
- Zhao L, Chen F, Lu CT, Ramakrishnan N (2015) Spatiotemporal event forecasting in social media. In: Proceedings of the 2015 SIAM international conference on data mining. SIAM. pp. 963–971
- Zhao P, Shui T, Zhang Y, Xiao K, Bian K (2020) Adversarial oracular seq2seq learning for sequential recommendation. In: Proceedings of the twenty-ninth international joint conference on artificial intelligence, IJCAI, pp. 1905–1911
- Zheng Y. Trajectory data mining: an overview. ACM Trans Intell Syst Technology. 2015;6(3):29. [Google Scholar]
- Zheng Y, Capra L, Wolfson O, Yang H. Urban computing concepts, methodologies, and applications. ACM Trans Intell Syst Technol. 2014;5(3):38. [Google Scholar]
- Zheng Y, Yi X, Li M, Li R, Shan Z, Chang E, Li T (2015) Forecasting fine-grained air quality based on big data. In: Proceedings of the 21th ACM SIGKDD International conference on knowledge discovery and data mining, KDD ’15. ACM, New York, NY, USA. pp. 2267–2276
- Zhou H, Ouyang W, Cheng J, Wang X, Li H. Deep continuous conditional random fields with asymmetric inter-object constraints for online multi-object tracking. IEEE Trans Circuits Syst V Technol. 2018;29(4):1011–1022. [Google Scholar]
- Zhou Q, Wu H, Yue K, Hsu CH. Spatio-temporal context-aware collaborative QoS prediction. Future Gener Comput Syst. 2019;100:46–57. [Google Scholar]
- Zhou X, Hong H, Xing X, Bian K, Xie K, Xu M. Discovering spatio-temporal dependencies based on time-lag in intelligent transportation data. Neurocomputing. 2017;259:76. [Google Scholar]
- Zhu P, Wen L, Bian X, Haibin L, Hu Q (2018) Vision meets drones: a challenge. arXiv preprint arXiv:1804.07437
- Zhu Y, Newsam S (2016) Spatio-temporal sentiment hotspot detection using geotagged photos. In: Proceedings of the 24th ACM SIGSPATIAL International Conference on Advances in Geographic Information Systems, SIGSPACIAL ’16, ACM, New York, NY, USA. pp. 76:1–76:4
- Zhu Y, Tian Y, Metaxas D, Dollár P (2017) Semantic amodal segmentation. In: Proceedings of the IEEE conference on computer vision and pattern recognition, pp. 1464–1472