

Abstract
The adaptation of complex organisms to changing environments has been a central question in evolutionary quantitative genetics since its inception. The structure of the genotype–phenotype maps is critical because pleiotropic effects can generate widespread correlated responses to selection and potentially restrict the extent of evolutionary change. In this study, we use experimental evolution to dissect the genetic architecture of natural variation for acute heat stress and oxidative stress response in the nematode Caenorhabiditis remanei. Previous work in the classic model nematode Caenorhabiditis elegans has found that abiotic stress response is controlled by a handful of genes of major effect and that mutations in any one of these genes can have widespread pleiotropic effects on multiple stress response traits. Here, we find that acute heat stress response and acute oxidative response in C. remanei are polygenic, complex traits, with hundreds of genomic regions responding to selection. In contrast to expectation from mutation studies, we find that evolved acute heat stress and acute oxidative stress response for the most part display independent genetic bases. This lack of correlation is reflected at the levels of phenotype, gene expression, and in the genomic response to selection. Thus, while these findings support the general view that rapid adaptation can be generated by changes at hundreds to thousands of sites in the genome, the architecture of segregating variation is likely to be determined by the pleiotropic structure of the underlying genetic networks.
Keywords: evolutionary quantitative genetics, experimental evolution, complex traits
Introduction
Biological organisms are complex, integrated systems. From an evolutionary point of view, a central consequence of this integration is that natural selection acting on one feature of an organism has the potential to have cascading effects across the whole organism (Lande 1979; Cheverud 1984; Phillips and McGuigan 2006). Evolutionary quantitative genetics has created a powerful statistical framework for analyzing complex phenotypes, even in the absence of knowledge of seemingly important factors such as the exact number or identity of genes or the distribution of their phenotypic effects (Barton and Turelli 1989). The advent of whole-genome analyses would seem to herald the advent of a new era in which we have the power to understand the genetic basis of complex, multifactorial traits. However, even now, the field has achieved remarkably little success identifying the genetic basis of most adaptive phenotypes within natural populations, aside from traits where a majority of the variation is due to a handful of well-characterized mutations, such as coat color and oxygen affinity in deer mice (Steiner et al. 2007; Linnen et al. 2013; Natarajan et al. 2013). There may be a small handful of cases in which natural variation is generated by simple genetics, but it is clear that for many, if not most, traits this will not be the case (Phillips 2005; Rockman 2012). More critically, genes rarely affect only a single, isolated trait within an organism. As limited as our current information on the structure of the genotype–phenotype map for single traits, the potentially complex distribution of pleiotropic effects across suites of co-evolving traits is still largely unknown (Phillips and McGuigan 2006).
The idea that genetic coupling across functional systems should be the rule rather than exception led Sewall Wright (1968) to posit the idea of “universal pleiotropy” for genetic systems. More recently, Boyle et al. (2017) proposed an “omnigenic” model for complex diseases. This model posits that complex diseases could be affected by highly connected gene networks such that, while there may only be a small set of “core” genes that directly affect a trait, variation in traits will be affected by both core and peripheral network genes, because genes often exist in highly connected networks. To a large extent, the omnigenetic paradigm is simply a translation of one of the central conceits of evolutionary quantitative genetics to the setting of human association mapping. At its limit, extensive pleiotropy can serve to “lock” the response to selection, creating a genetic constraint that limits the rate of evolutionary change (Lande 1979; Charlesworth 1990; Arnold 1992). On the other hand, variation in the functional specificity across the network of genes affecting complex traits, such as differences in tissue-specific regulation (Carroll 2008), holds the possibility that the genetic changes that actually lead to evolutionary divergence could be biased toward subsets of genes with either more or less pleiotropy, depending on the specific pattern of selection (Phillips and McGuigan 2006).
Pleiotropy may therefore play a twofold role in the response to selection. First, following traditional quantitative genetic approaches, patterns of pleiotropy underlying standing variation may lead to correlated responses to selection across broad suites of characters. Alternatively, following a developmental-genetic perspective, long-term evolutionary change may be strongly dependent on variation in pleiotropy and may subsequently lead to a biased subset of genes exhibiting reduced pleiotropic effects, leading to the evolutionary change in the pattern of pleiotropy itself (Phillips and McGuigan 2006; Arnold et al. 2008; Jones et al. 2014). At the extremes, these perspectives lead to two fairly opposing hypotheses regarding the nature of single-locus responses to adaptive evolution. Under the Wrightian view of universal pleiotropy, we might expect allelic change to be reflective of patterns of standing variation in pleiotropy, whereas the developmental-genetic perspective would suggest that pleiotropy itself should evolve as selection creates a sieve favoring the fixation of less pleiotropic alleles and/or change at loci with less severe pleiotropic effects in general.
At a functional level, median levels of pleiotropy have been found to be between four and seven traits affected by every gene (Wagner and Zhang 2011; Paaby and Rockman 2013), but there are many cases in which a single mutation can affect dozens of traits (Knight et al. 2006). These studies tend to focus on what Paaby and Rockman (2013) call “molecular gene pleiotropy”: how many functions does a given locus affect when that gene is knocked out. There is substantially less information on the extent of pleiotropy generated by naturally segregating variation within populations, or “mutational pleiotropy” (Wagner and Zhang 2011; Paaby and Rockman 2013). Here the focus is on the entire spectrum of pleiotropy generated by segregating alleles as opposed to genetic knockouts. Given that the allele—and not the gene—is the appropriate unit of variation for evolutionary change (Wright 1968; Lande 1984; Phillips and McGuigan 2006; Wagner and Zhang 2011), studies that use forward genetic screens may find a large fraction of potential targets of those genes, but that does not necessarily inform us as to how a trait of interest will respond to selection.
How can we understand the balance between molecular and mutational pleiotropy, especially in the context of competing hypotheses about the role of the genetic architecture of pleiotropy in structuring the evolution of suites of complex traits? Experimental evolution coupled with whole-genome sequencing, or evolve and re-sequence, has emerged as a powerful method for studying the genetic architecture of complex traits (Kofler and Schlötterer 2014). Selection on complex traits can leave weak or ambiguous signals of selection on the genome (Kemper et al. 2014), but evolve and re-sequence facilitates direct comparison between ancestral and evolved populations and quantification of evolutionary change across the genome. In particular, replicated experiments within a well-defined hypothesis testing framework allow sampling variance to be accounted for in a way that historical contingency renders impossible within natural populations.
The nematode Caenorhabditis remanei is ideal for addressing questions relating to complex traits via experimental evolution (Sikkink et al. 2014b; Castillo et al. 2015; Teotónio et al. 2017). It is a genetically diverse, sexually reproducing organism (Jovelin et al. 2003; Cutter et al. 2006). Large populations can easily be maintained in a lab, with upwards of 2000 individuals living on one 10 cm agar plate, so an entire experiment can occupy one shelf in an incubator. Additionally, its relationship to the model nematode Caenorhabditis elegans allows both genomic and functional information to be applied across species. And abiotic stress response in nematodes provides an interesting model system of interacting traits because many important stress response pathways are well conserved throughout animals and have pleiotropic effects across many different abiotic stressors (Murphy and Hu 2013; Rodriguez et al. 2013). For example, mutations within the well-studied insulin/insulin-like growth factor signaling pathway in C. elegans often affect resistance to a wide variety of stressors including heat stress, oxidative stress, ultraviolet radiation, and pathogen stress (Murphy and Hu 2013). However, the role that natural genetic variation plays in individual variation in these traits is less clear (Reynolds and Phillips 2013; Jovelin et al. 2014).
Here, we use experimental evolution and whole-genome sequencing to dissect the genetic architecture of acute heat stress and acute oxidative stress response in C. remanei and to test whether expectations of a high degree of molecular pleiotropy generated using standard genetic approaches are reflected in patterns of mutational pleiotropy as reflected in the response to selection on natural genetic variation. In previous work, we saw a strong phenotypic response to direct selection on both acute heat stress and acute oxidative stress but little to no correlated response to selection for the alternative phenotype (Figure 1; Sikkink et al. 2015). In this study, we seek to align these global phenotypic patterns with a detailed analysis of gene expression and the genomic response to selection at single nucleotide resolution in order to test the complexity and coherence of genotypic and phenotypic responses to selection.
Figure 1.

Direct and correlated response to selection for each replicate of experimentally evolved lines. A direct response to selection is measured by the response to selection where the phenotyping environment matches the acute selection environment and a correlated response to selection is measured by the response to selection where the phenotyping environment does not match the acute selection environment. There is a strong direct response to selection seen in both acute heat and oxidative selected populations but no correlated response to selection. Modified from Supplementary Figure S1 in Sikkink et al. (2015).
Materials and methods
Experimental evolution
As described in (Sikkink et al. 2014b), the base “ancestral” population used to initiate the experimental evolution replicates was created using 26 isofemale strains, to create a population representative of the naturally segregating genetic variation of a single population of C. remanei collected in Ontario, Canada. This population (PX443) was used to establish each of the replicate selection and control lines and was frozen soon after creation to prevent adaptation to the lab environment. Using the methods described below, we determined that this population had high initial levels of genetic diversity (genome wide average π = 0.0178, Supplementary Figure S1). All natural isolates and experimental lines were raised on Nematode Growth Medium-lite (NGM-lite, U.S. Biological) seeded with Escherichia coli strain OP50 (Brenner 1974).
Evolved populations of C. remanei belong to one of two replicate experimental blocks, each derived from an independently thawed subset of the ancestral population. Within each replicate block populations were evolved in parallel to one of three acute environments: control (2 lines/block), acute heat stress (1 line/block), and acute oxidative stress (1 line/block) as previously described (Sikkink et al. 2014b; Sikkink et al. 2015). Here, an acute stress is one that the worms experienced for 4 h as L1 juveniles before returning to the laboratory control environment. The acute heat stress assay induced ∼70% mortality in the ancestor population and the acute oxidative stress assay induced ∼80% mortality in the ancestor population (Sikkink et al. 2015). Populations were subjected to acute stress conditions every two generations or whenever the population produced ≥ 24,000 eggs, whichever happened later. Control populations were randomly culled to 1000 worms during selective generations. For all acute stress events, each population (control evolved, acute heat stress evolved and acute oxidative stress evolved) was age-synchronized via a bleach treatment (Stiernagle 2006). All experimentally evolved populations were subject to a total of 10 acute stress events. As described in Sikkink et al. (2014b), each population was frozen after about every second generation of acute stress selection to ensure that the worms did not lose the ability to survive a freeze and to provide a record of evolutionary changes. All told, there were a total of eight experimentally evolved populations created from the ancestor population: four control replicates, two acute heat stress replicates, and two oxidative stress replicates.
Phenotypic response to selection was calculated as described in Sikkink et al. 2015. Briefly, resistance to either acute heat stress or acute oxidative stress was measured in populations that had undergone 10 generations of selection. Resistance was quantified as the proportion of the phenotyped population that survived an acute stress assay and matured to adulthood, relative to the survival of control samples. Evolved differences in acute heat or oxidative stress resistance were tested using a generalized linear mixed model (GLMM) implemented in the lme4 package (Bates et al. 2015) in R. The selection treatment was classified as a fixed effect and comparisons were made between the ancestor population and every evolved line.
Preparation of whole-genome sequencing libraries
We determined the genetic response to selection using a population-based pooled sequencing (pool-seq) approach (Schlotterer et al. 2014). Ancestral and acute evolved populations were sequenced via whole-genome shotgun sequencing. Approximately 10,000 L1 individuals (∼24 h old juvenile) were pooled together for DNA extraction and sequencing library preparation. Samples were prepared using the Nextera DNA Sample Preparation Kit (Illumina). Multiple sequencing libraries were prepared from the original DNA sample as needed to ensure adequate mean sequencing coverage (Supplementary Table S1). Whole-genome sequencing libraries were obtained for the ancestor and all eight evolved populations. Samples were sequenced on an Illumina HiSeq 2000 and Illumina HiSeq 2500 at the University of Oregon Genomics and Cell Characterization Core Facility.
Whole-genome sequencing analysis
Raw sequence reads were quality filtered using the “process_shortreads” component of Stacks (Catchen et al. 2013). Low quality reads (mapping and base quality less than 20) were trimmed or discarded; all reads that passed quality filtering were aligned to the C. remanei reference genome assembled from the PX356 C. remanei inbred strain (Fierst et al. 2015) using the alignment program GMAP–GSNAP (Wu and Nacu 2010). Single nucleotide polymorphism (SNP) tolerant alignment parameters were used to ensure that divergent SNPs would align to the reference genome; specifically, we did not use a suffix array, which biases against SNP alleles (–use-suffix array = 0). We used available gene annotation data for PX356 (Fierst et al. 2015) in downstream data analysis. However, we also wanted to make use of the more extensive functional annotation data available for C. elegans. To that end, we used the software OrthoFinder (Emms and Kelly 2015) to identify C. elegans orthologs of C. remanei genes and protein domains. The C. elegans protein annotations were obtained from Wormbase ParaSite (Lee et al. 2018), version WS258.
We used the R (R Core Team 2017) package Nest (Jonas et al. 2016) to estimate effective population size (Ne) of each experimental replicate using temporal changes in allele frequency based on existing theory (Krimbas and Tsakas 1971; Jorde and Ryman 2007; Waples et al. 2016), modified for samples taken from pooled population data. The input data, allele frequency and coverage data for each SNP at generation 0 (ancestor population) and generation 30 (each evolved population) was obtained from the program “snp-frequency-diff.pl” from Popoolation2 (Kofler et al. 2011). Only SNPs with a minimum coverage of 10X in each population were included in the effective population size estimator. Adding a maximum coverage threshold did not affect the estimated Ne. We used a pool sample size (the number of individuals who went into the original sequencing sample) of 1000 but increasing the pool size from 1,000 to 10,000 individuals had a negligible effect on the estimated Ne. Expected Ne based on census population sizes for the duration of the experiment were calculated based on Equation 3.5 in Kimura (1983) using the “harmonic.mean” function in the R (R Core Team 2017) package psych (https://CRAN.R-project.org/package=psych).
Identification of selected sites
Allele frequencies were calculated using the snp-frequency-diff.pl script from the program Popoolation2 (Kofler et al. 2011). Each SNP had to have a minimum of 15X coverage, a maximum coverage of 98% of total sequence coverage across the genome and the minor allele had to have at least two copies at a site in order to be retained for further analysis.
We modeled the effects of stress treatment on allele frequency using a general linear model (GLM) with a quasibinomial error distribution using the “glm” function in the R (R Core Team 2017) stats package. We followed the method described in Wiberg et al. (2017). Stress treatments (heat and oxidative) were modeled jointly and separately. Estimated marginal means for all the predictor combinations were calculated using the emmeans R package (https://github.com/rvlenth/emmeans). Each genomic site was modeled separately, and multiple testing correction was done using a Bonferroni correction. For a genomic site to be called as divergent, the difference between ancestor and stress treated populations had to be significant and the difference between the ancestor and control treated populations had to not be significant. BEDTools (v 2.29.2) “intersect” (Quinlan and Hall 2010) was used to identify SNPs that overlapped genes.
Haplotype phasing using single worm RAD sequencing
We tested for the potential buildup of linkage disequilibrium within selection lines by crossing worms from the polymorphic ancestral population with the reference genome strain (PX356), thereby generating F1s heterozygous for a single ancestral population haplotype. Single worm RAD sequencing libraries were prepared for 77 male F1 worms. Because the genotype of the reference strain is known, the haplotype of the target crossed individual could be directly determined in the F1 heterozygotes.
The RAD capture (Ali et al. 2016) method was used to genotype F1 worms. RAD capture is a flexible reduced-representation sequencing method that allowed us to multiplex and economically sequence all 77 genomes in a single Illumina lane. We digested genomic DNA with the restriction enzyme EcoRI; ligated digested fragments to barcoded, biotinylated adaptors; and sheared fragments with a BioRuptor. We enriched for fragments containing EcoRI cut sites with streptavidin beads and prepared libraries for sequencing with the GE GenomiPhi V3 DNA Amplification kit. Samples were sequenced on an Illumina HiSeq 4000 at the University of Oregon Genomics and Cell Characterization Core Facility.
Raw fastq files were reoriented using flip2BeRAD (https://github.com/tylerhether/Flip2BeRAD), which reorients read-pairs such that all RAD tags and inline barcodes are present as read 1. Barcodes on the forward read (read 1) are necessary for some downstream analyses. Retained reads were filtered and demultiplexed with “process_radtags” from Stacks using standard stringencies. Reads were aligned to the C. remanei PX356 reference sequence (Fierst et al. 2015) using GSNAP ultrafast settings. We only used read-pairs that mapped to the reference in the expected orientation (pairs facing inward toward each other) in downstream analyses. Individuals were genotyped using the “HaplotypeCaller” and “GenotypeGVCF” programs from GATK (https://software.broadinstitute.org/gatk/) (Van der Auwera et al. 2013). VCFtools (Danecek et al. 2011) was used to filter sites based on missing data, minor allele frequencies and genomic position. For a site to be included, the maximum non-reference allele frequency allowed was 0.49, there had to be less than 10% missing data and the minimum mean depth of coverage was 10X. PLINK (http://pngu.mgh.harvard.edu/purcell/plink/); (Purcell et al. 2007) was used to calculate linkage disequilibrium on the 13 largest contigs, which account for ∼54% of total genome length. The squared inter-variant allele count correlations (r2 values) were reported from PLINK (Purcell et al. 2007).
Transcriptional profiling of evolved populations
RNA sequencing libraries were prepared as described in (Sikkink et al. 2014b). Briefly, frozen stocks of worms from the end of the experimental evolution project were thawed and the worms raised at 20°C for three generations or until there were at least 250,000 individuals in a population. Pooled samples of ∼100,000 age-synchronized L1 larval (∼24 h old) worms were collected from the ancestor population, one of the control populations from the replicate two block (Control line—2), and the acute heat stress and acute oxidative stress evolved populations from the replicate two block. Total RNA was isolated from each sample using standard TRIzol (Ambion) methods. All tissue samples were collected from L1 larval worms. The two stress evolved populations were not exposed to the stressor (either heat stress or oxidative stress) prior to tissue collection. We collected six to eight replicate samples total from each evolved line and the ancestor population from at least two independently thawed populations for each line, except for the oxidative stress evolved line, where six replicate samples were collected from one thaw of frozen stock. Six ancestor population replicates were sequenced in three batches, eight control evolved replicates were sequenced in four batches, eight heat stress evolved replicates were sequenced in four batches, and six oxidative stress evolved replicates were sequenced in one batch. Samples were sequenced on an Illumina HiSeq 2000 at the University of Oregon Genomics and Cell Characterization Core Facility.
Raw sequence reads were quality filtered as described in (Sikkink et al. 2014a). Briefly, raw sequencing reads were quality filtered using the “process_shortreads” component of Stacks (Catchen et al. 2013) and all reads that passed quality filtering were aligned to a C. remanei reference genome assembled from the PX356 C. remanei inbred strain (Fierst et al. 2015) using GMAP–GSNAP (Wu and Nacu 2010). We used the “htseq-count” tool from the Python HTSeq package (Anders et al. 2015) to count all reads that aligned to protein–coding genes, using the criteria described in (Sikkink et al. 2014b).
Differential gene expression analysis was conducted using the R package DESeq2 (Love et al. 2014). Low variance genes were filtered using DESeq2’s automatic filter. We tested for differences in gene expression between the ancestor and three experimentally evolved populations (control line—2, acute heat stress evolved and acute oxidative stress evolved). Genes were only called as differentially expressed in each comparison if the P-value was less than 0.05 after Benjamini–Hochberg adjustment as implemented in DESeq2. We also tested for a relationship between log2 fold changes in gene expression between acute heat stress–ancestor and acute oxidative stress–ancestor comparisons using Model II linear regression. This analysis was implemented in the lmodel2 package in R (R Core Team 2017).
Data availability
Supplementary Files S1 and S2 contain the full list of genes identified as differentially expressed and/or divergent. Supplementary Table S1 contains sequencing coverage for all experimental populations. Supplementary Files S1–S2, Supplementary Table S1 and all supplemental figures available on figshare (https://figshare.com/projects/Supplemental_material_for_Complex_pleiotropic_genetic_architecture_of_evolved_heat_stress_and_oxidative_stress_resistnace_in_the_nematode_Caenorhabditis_remanei_/58364). Whole-genome sequencing data are available at NCBI SRA database under accession number PRJNA422140. The transcriptome data have been deposited in NCBI’s Gene Expression Omnibus (Edgar et al. 2002) and are accessible through GEO Series accession number GSE108235. This Whole Genome Shotgun project has been deposited at DDBJ/ENA/GenBank under the accession LFJK00000000. The version described in this paper is version LFJK02000000.
Results
Adaptation to acute stress is multifactorial
As demonstrated previously, selection for resistance to acute heat stress and acute oxidative stress leads to the evolution of significantly increased survival within the acute heat stress and acute oxidative stress environments (Figure 1; Sikkink et al. 2015). Using whole-genome resequencing of the selected lines, we find that this phenotypic response is strongly echoed across the entire genome. Evolved acute heat stress and acute oxidative stress response are both highly polygenic (Figure 2): over 12,000 divergent SNPs were identified in the heat stress evolved populations and 14,000 were identified in the oxidative stress evolved populations. About 45% of divergent SNPs identified in the heat stress and oxidative stress populations were unique within that stress treatment while the other 55% were significantly divergent in both stress populations.
Figure 2.

Location of divergent SNPs on two contigs in the heat stress evolved populations (top panel), the oxidative stress evolved populations (middle panel), and all evolved populations together (bottom panel). Only genomic sites with a Bonferroni corrected P-value less than or equal to 0.05 are shown.
Linkage disequilibrium as a possible source of complexity in genetic response
The large number of genomic regions that we saw responding to selection could be due to a large number of genes underlying the traits of interest or, alternatively, due to the impact of linked selection on a smaller number of causative loci during adaptation (Franssen et al. 2015). We used single-individual SNP data in the ancestral population to estimate the degree of linkage disequilibrium within these populations. We found that linkage disequilibrium in the ancestor decays to background levels within 200 bp (Supplementary Figures S2 and S3), very similar to the pattern observed within natural populations (Cutter et al. 2006), and found no evidence of local or long-distance linkage disequilibrium beyond that (Supplementary Figures S4 and S5).
Even in the absence of haplotype structure in the ancestral population, selection itself may generate linked responses to selection within specific chromosomal regions, especially those with reduced recombination rates (Burri et al. 2015). We cannot directly address this with pool-seq data, which is one limitation of our resequencing approach (Franssen et al. 2015). However, any form of linked selection would be expected to bias the results in favor of finding apparent pleiotropy, since linkage is another important source of genetic correlation among traits (Lande 1984). The larger the haplotype block, the higher the probability that two genes with independent effects on a suite of traits display a correlated response to selection.
Effective population size
Effective population size is an important parameter in experimental evolution, as effective population size is directly related to the relative opportunity and strength of random genetic drift versus selection in a population (Kimura 1983). Estimates of effective population size (Ne) for each of the evolved populations ranged from 379 to 1602 (Table 1). This is much smaller than the expected Ne given our census population sizes (Table 2), which fluctuated between 1,000 and 24,000 worms (Sikkink et al. 2015). We also obtained Ne estimates using SNPs found only on the X chromosome. C. remanei has an XX/XO sex determination system (Hodgkin 1987; Thomas et al. 2012) so we would expect Ne on the X chromosome to be around 75% of the Ne on the autosomes. However, our estimates show X chromosome Ne values that range from 60 to 146% of the all SNP Ne estimates (Table 1).
Table 1.
Estimated effective population (Ne) size for each experimentally evolved population. Ne estimated for all eight evolved populations using allele frequency and coverage data estimated using Popoolation2 (Kofler et al. 2011). Ne for all SNPs and just SNPs on the assembled X chromosome shown
| Population | N e | X Chr Ne |
|---|---|---|
| Replicate 1 Control—1 | 650 | 619 |
| Replicate 1 Control—2 | 781 | 479 |
| Replicate 1 Heat stress | 978 | 640 |
| Replicate 1 Oxidative stress | 1602 | 1449 |
| Replicate 2 Control—1 | 1051 | 1507 |
| Replicate 2 Control—2 | 821 | 805 |
| Replicate 2 Heat stress | 654 | 528 |
| Replicate 2 Oxidative stress | 379 | 557 |
Table 2.
Expected effective population sizes for the three experimental evolution conditions given the cyclical census population sizes described in Sikkink et al. (2015). Ranges come from different intermediate generation census population sizes. Ne values calculated using Equation (3.5) in Kimura (1983)
| Population | Expected Ne |
|---|---|
| Control evolved | ∼2500–∼2800 |
| Heat stress evolved | ∼5000–∼6100 |
| Oxidative stress evolved | ∼3500–∼4600 |
Pleiotropic structure of gene expression
The lack of correlated response to selection in the stress resistance phenotypes is echoed at the level of the molecular phenotype of gene expression as well. In effect, however, this approach allows the simultaneous interrogation of many thousand phenotypes. Here, changes in expression are based on the comparison of baseline expression in the evolved populations versus those in the ancestor population. The numbers of differentially expressed genes greatly differ across selective environments (906 in the oxidative stress evolved population vs 91 in the heat stress evolved populations), and 21 genes are in common between the two groups (Figure 3). One of the common significantly differentially expressed genes is a putative member of the HSP70 family that promotes protein binding in response to stress and constitutively, but the other shared differentially expressed genes were not part of any canonical stress response pathways (Supplementary File S1). There were 22 genes that were differentially expressed between the ancestor and control evolved populations, 7 of which were not differentially expressed in either the heat stress evolved population or the oxidative stress evolved population (Figure 3, Supplementary File S1).
Figure 3.
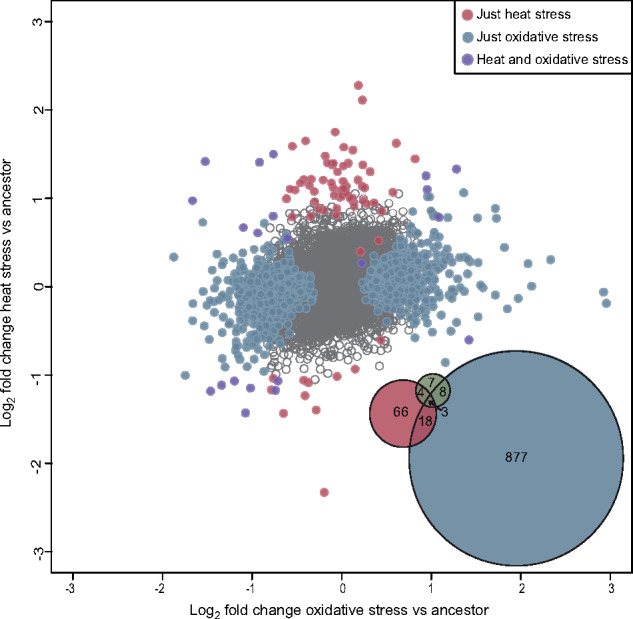
Correlation between log2 fold change of heat stress evolved vs ancestor and oxidative stress evolved vs ancestor tests for differential gene expression. The Venn diagram in the lower right shows the overlap in identity of significantly differentially expressed genes in the heat stress evolved (red), oxidative stress evolved (blue) and control evolved populations (green).
In addition, we observed an interesting pattern in the directionality of the evolution of gene expression. Genes differentially expressed in the heat stress evolved population were more likely to be up-regulated than down-regulated compared to both the oxidative stress evolved population (Fisher’s exact test, P = 1.7 × 10⁻⁸) and the control population (Fisher’s exact test, P = 1.9 × 10⁻⁴). However, the proportions of up-regulated vs down-regulated differentially expressed genes in the oxidative stress evolved population were not significantly different from the control population (Fisher’s exact test, P = 0.29). There was also a weak correlation between changes in gene expression between oxidative stress evolved and heat stress evolved populations (r2 = 0.049, P = 0.01), but this correlation appears to be largely driven by a relationship between the genes that have not changed in expression very much (i.e., it is a weak aggregate response over many genes).
Candidate genes under selection for acute heat stress and acute oxidative stress
Genes implicated as potentially being involved in the phenotypic response to selection, either via differences in gene expression or divergence due to allele frequency changes tended to create non-overlapping sets among the stress response environments. Specifically, 11 genes were found to be in common for the differential expression and genomic divergence gene sets within the heat stress evolved populations and 136 in common for the oxidative stress evolved populations. None of the shared genes had annotations associated with, or were orthologs of, genes known to be relevant to stress resistance (Supplementary Files S1 and S2).
Differentiated genes due to allele frequency changes
There were 3061 genes with at least one divergent SNP in an exon in the heat stress evolved population and there were 3058 genes with at least one divergent SNP in an exon in the oxidative stress evolved population. Of the 3058 genes that had at least one divergent SNP in the heat stress population, 926 (30.2%) were only identified in the heat stress evolved population, and of the 3406 genes that had at least one divergent SNP in the oxidative stress population 1274 (37.4%) were only identified in the oxidative stress evolved population.
We identified a small number of stress response pathway candidate genes found within the differentiated genes that overlapped between the heat stress and oxidative stress populations: age-1, daf-2 and lrk-1. The age-1 gene is a part of the insulin-like signaling pathway (IIS), which is involved in stress resistance, including resistance to heat and oxidative stress (Murphy and Hu 2013). Similarly, daf-2 activation promotes the IIS pathway and daf-2 mutants are well known for their stress resistance and a longevity phenotype (Murphy and Hu 2013). It should be noted that the divergent SNPs identified in age-1 and daf-2 are polymorphic in both the ancestor and descendent stress selected populations, and that any divergent SNPs identified are not indicative of a selective sweep to fixation in the stress selected populations. Lrk-1 was found to affect oxidative stress sensitivity in a study by Sämann et al. (2009). In addition, a handful of genes with putative heat shock protein (HSP) domains were identified in both the heat stress and oxidative stress evolved populations. HSPs help stress response by rescuing misfolded proteins (Rodriguez et al. 2013).
Differentially expressed genes
Similar to the pattern described above for differentiated genes, only a handful of the significantly differentially expressed genes have known or putative functions in abiotic stress response. There were significantly up-regulated HSPs in both the heat shock evolved and oxidative shock evolved populations, and up-regulated insulin-like growth factor binding proteins in the oxidative shock evolved population. Similar to previous work (Sikkink et al. 2014a), we find that up-regulated HSPs are significantly enriched in the heat stress evolved population (Fisher’s exact test, P = 0.00146), as well as in the oxidative stress evolved population (Fisher’s exact test, P = 0.029). In addition to up-regulated HSPs, SKN-1, a transcription factor whose regulatory targets are important for oxidative stress resistance (An and Blackwell 2003; Murphy and Hu 2013), was also significantly up-regulated in oxidative stress evolved population.
Discussion
Whole organism phenotypes are the combined result of the effects of and interactions among tens of thousands of genes. The classic assumption within the field of quantitative genetics is that majority of phenotypic variation found within natural populations is quantitative, with the phenotypic differences among individuals likely caused by a large number of genes operating within a complex environmental context (Hill 2010). Yet over the last two decades a small controversy has emerged about whether we expect the genetic basis of adaptation to be dominated by a few genes of major effect or whether it will be highly polygenic (Orr and Coyne 1992; Orr 2009; Rockman 2012). While this question is obviously most relevant in the context of evolution within specific natural populations, there is an unavoidable conflation of adaptation, demographic history, and chance events for any particular realization of an evolutionary lineage that makes it impossible to test specific hypotheses within a single instance. For example, even in the case of putatively adaptive armor loss in sticklebacks, in which it initially appeared that the same syndrome had been replicated many times independently during adaptation to fresh water, we now know that the genetic basis of this adaptation in each case is generated by a complex set of alleles that have likely been forged by thousands of generations of migration-selection balance (Colosimo et al. 2005; Nelson and Cresko 2018). Experimental evolution provides a means of addressing these questions in a controlled, repeatable manner. Our previous work has demonstrated that the nematode C. remanei is a powerful system for experimental evolution of stress resistance phenotypes (Sikkink et al. 2014b, 2015). Here, we use an evolve and re-sequence approach to probe the genetic basis of these phenotypic changes.
Our data demonstrate that both heat stress response and oxidative stress response are complex, polygenic traits, where hundreds of regions in the genome respond to selection (Figure 2) and hundreds of genes show significant changes in gene expression (Figure 3). This fits the pattern shown by many other experimental evolution and artificial selection studies (Turner et al. 2011; Orozco-terWengel et al. 2012; Pettersson et al. 2013; Hirsch et al. 2014), in which hundreds of differentiated genes and/or genomic regions have been identified that influence traits as varied as seed size, novel temperature regimes and body size.
The infinitesimal model, which allows researchers to predict the effects of selection on a trait without knowing the identity of the genes that underlie variation in that trait (Fisher 1918; Hill 2010), forms the cornerstone of quantitative genetics (Falconer and Mackay 1996) and has been very successful in plant and animal breeding (Hill 2014). Recent work in human genetics has found that that the vast majority of human traits and diseases are caused by variation in hundreds if not thousands of loci (Wood et al. 2014; Visscher et al. 2017). Taken in the context of this larger body of work, our study supports the view that much variation is quantitative in nature and responses to selection are generated by changes in a large number of genes, even when selection itself is extremely strong (Johansson et al. 2010; Pettersson et al. 2013; Hirsch et al. 2014).
We find that linkage disequilibrium within our base population decays very quickly in the ancestral population, consistent with previous observations within this species (Cutter et al. 2006; Jovelin et al. 2009). However, there does appear to be a pattern of chromosome blocks responding to selection, which would be expected when specific adaptive haplotypes increase in frequency under selection, even when initially found in apparent linkage equilibrium before selection (Barghi and Schlötterer 2020). The actual number of sites responding to selection is therefore undoubtedly lower than what we have observed here, although we did use a genomic-window based approach to control for this to some extent. Interestingly, increased linkage caused by selection actually makes our conclusions regarding pleiotropy conservative, since it is effectively impossible to distinguish pleiotropy from linkage at fine genomic resolution (Lande 1984). The approaches used here are not ideal for distinguishing these potential confounding effects. Instead, other experimental and analytical approaches will be needed to (1) detect patterns of haplotype sweeps (Otte and Schlötterer 2021) and (2) potentially break up haplotype blocks prior or during selection.
The genomic basis of mutational pleiotropy
Despite the expectation set by many molecular biology studies of stress response pathways in C. elegans (Kenyon 2010; Murphy and Hu 2013; Rodriguez et al. 2013), we found mixed evidence overall for pleiotropy for the genetic basis of acute heat stress resistance and acute oxidative stress resistance. There was little to no correlated response to selection for either stress in terms of survival in the non-selected environment (Figure 1, Sikkink et al. 2015) and mixed evidence for a correlated response for changes in gene expression (Figure 3). At the level of genomic response to selection, we do see some evidence for pleiotropy between the heat stress evolved and oxidative stress evolved populations at the level of individual genes (Figure 2), in particular with the presence of shared divergent SNPs in daf-2 and age-1.
This discrepancy could be due to a number of different factors. First, a correlated response to selection is generated by the alleles that actually respond to selection, not all possible alleles for a gene (Lande 1979). It is possible that many of the stress response genes that have been identified via mutagenesis have broadly pleiotropic effects such that they cannot respond to direct selection for increased stress resistance per se because of potential negative pleiotropic effects on other traits (e.g., developmental rate, reproduction). That is, the genes that respond to selection are not major genes with many pleiotropic effects, since they would likely have some other negative pleiotropic effects. Second, molecular geneticists and quantitative geneticists focus on related but subtlety different definitions of the term pleiotropy. Most fundamentally, pleiotropy is a property of alleles, not genes (Phillips and McGuigan 2006), and so it is possible for there to be variation in pleiotropy at a single locus such that some segregating alleles will lead to a correlated response to selection while others will not. For stress resistance, we do not find a clear signal for canonical stress response pathway members in the first place, and so variance in pleiotropy at genes defined via measures of molecular pleiotropy still does not appear to be the primary driver here, regardless of any potential variation in allelic effects.
Because of the scope of the much larger, multifactorial experiment within which this experiment is a component (Sikkink et al. 2015), the number of replicates is well below that recommended for evolve and re-seq experiments (Kessner and Novembre 2015; Schlotterer et al. 2015). This almost certainly limits our ability to robustly identify single-locus effects at each site. The challenge is not whether an individual site generates a false positive in a statistical sense, as this strictly controlled via conservative multiple-comparisons adjustments. Instead, it is whether one can distinguish “evolutionary causation” (genetic drift vs natural selection) that is difficult without a large number of replicates (Schlotterer et al. 2015). Here we have used direct comparisons among experimental populations and between the experimental populations and matched controls, which is not present in many evolve and re-seq experiments, to help address this challenge. More work, such as simulation studies, are needed to understand how this experimental design affects power per se, but there is no question that future studies will greatly benefit from increased replication and that some of the specific sites identified here could be due to a chance lack of change in the controls and simultaneous drift in the selected lines.
The genetic and genomic basis of the response to selection
While there are a handful of genetically differentiated and differentially expressed genes with functions that are directly related to abiotic stress response, it is clear that the response to acute heat stress and acute oxidative stress cannot be explained by these genes alone. We do not find evidence that many of the canonical stress response genes, including hsf-1 or daf-16 (Murphy and Hu 2013; Rodriguez et al. 2013) for heat stress and pink-1, lrk-1 and sod-1, -2 or -3 for oxidative stress (Rodriguez et al. 2013) responded to selection for acute heat stress or acute oxidative stress survival, although skn-1 is constitutively up-regulated in the oxidative stress evolved population. This is further evidence that gene knockouts can paint an incomplete picture of the genetic architecture of a phenotype of interest and the prediction that the genes that respond to selective pressures in a population are unlikely to be highly pleiotropic genes of large effect.
Selection on heat and oxidative stress yielded similar amounts genomic divergence as reflected in allele frequency changes, but fairly large differences in the degree of gene expression. It is difficult to determine at this point if this reflects an important functional difference between these traits (e.g., that oxidative stress resistance is more apt to be achieved via changes in constitutive levels stress resistant genes whereas heat stress is achieved by structural changes within the proteins themselves). Distinctions of this type are really only possible by dissecting the direct functional causation of individual SNPs—something that becomes more daunting as the total number of divergent sites under selection becomes large. There is also weak correspondence between divergent SNPs and genes displaying patterns of differential gene expression. This could suggest that transacting factors, especially within the oxidative stress populations, might play an important role in the overall response to selection. Again, this largely pure speculation in the absence of more detailed functional information.
An advantage of using C. remanei as a model system for experimental evolution is that is allows laboratory population sizes one to two orders of magnitude larger than most previous selection experiments in animals. Demographic factors, including selection itself, can lead to effective population sizes that are below census sizes, however. The genomic data collected here allows for these effects to be precisely estimated in this system for the first time. We find that most our estimated effective population sizes are about an order of magnitude smaller than the post-selection census population size (Tables 1 and 2; Sikkink et al. 2015). Fluctuating population sizes will reduce Ne (Kimura 1983), and in our case very strong selection has the potential to strongly reduce the level of variation at linked sites via the Hill–Robertson effect (Hill and Robertson 1966; Charlesworth 1996, 2012; Comeron et al. 2008). Even so, the reduction in Ne seems to be particularly severe relative to the very large population sizes (for an animal) carefully maintained throughout the experiment. For example, despite maintaining a census population size 10–20X larger than similar experiments in Drosophila melanogaster, our estimated Ne values are only two to three times higher than estimated Ne values for those populations (Orozco-terWengel et al. 2012; Jonas et al. 2016). Differences in overall strength of selection may play a role here (strength of selection is unknown in Jonas et al. 2016), but one additional source of reduction in Ne is potential variance in mating such that male mating success and/or female reproductive output displays a greater than Poisson variance (Wright 1931; Kimura 1983). This seems particularly likely because the control populations have similar effective population sizes to the selected lines. Variation in male mating ability has been previously documented within C. remanei (Palopoli et al. 2015) and bears further investigation within the context of experimental evolution within this species.
Conclusion
Organisms are complex, integrated systems and the manner in which natural variation percolates though that system is likely to be highly structured by functional interactions. Although pleiotropy may be ubiquitous throughout the genome, individuals with mutations in highly pleiotropic genes are likely to suffer from reduced fitness since those mutations will most likely affect more traits than those under selection. As such, seeking to understand the genetic architecture of traits solely via an analysis of gene knockouts is likely to leave an incomplete picture of the overall structure of the pleiotropic network, especially with respect to segregating variation within natural populations. Using standing genetic variation, experimental evolution, and whole-genome sequencing therefore provides a powerful toolkit for understanding the genetic architecture of complex traits, no matter how complex they ultimately prove to be.
Acknowledgments
We thank Sally E. Claridge and Erik Johnson for their help setting up crosses and samples for single worm RAD sequencing. We thank Gavin Woodruff for creating a script to run OrthoFinder. We also thank John Willis for creating the single worm RADseq libraries.
Funding
This work was supported grants from the National Science Foundation (DEB-1210922 to W.A.C. and K.L.S.; DEB-1607194 to P.C.P. and C.H.O.), grants from the National Institutes of Health (GM096008, GM102511, and GM131838 to P.C.P.; RR032670 to W.A.C.), and pre-doctoral fellowships to C.H.O. from the National Science Foundation and National Institutes of Health (T32 GM007413).
Conflicts of interest: None declared.
Literature cited
- Ali OA, O’Rourke SM, Amish SJ, Meek MH, Luikart G. et al. 2016. RAD Capture (Rapture): flexible and efficient sequence-based genotyping. Genetics 202:389–400. [DOI] [PMC free article] [PubMed] [Google Scholar]
- An JH, Blackwell TK.. 2003. SKN-1 links C. elegans mesendodermal specification to a conserved oxidative stress response. Genes Dev. 17:1882–1893. [DOI] [PMC free article] [PubMed] [Google Scholar]
- Anders S, Pyl PT, Huber W.. 2015. HTSeq—a Python framework to work with high-throughput sequencing data. Bioinformatics. 31:166–169. [DOI] [PMC free article] [PubMed] [Google Scholar]
- Arnold SJ. 1992. Constraints on phenotypic evolution. Am Nat. 140:S85–107. [DOI] [PubMed] [Google Scholar]
- Arnold SJ, Bürger R, Hohenlohe PA, Ajie BC, Jones AG.. 2008. Understanding the evolution and stability of the G-matrix. Evolution. 62:2451–2461. [DOI] [PMC free article] [PubMed] [Google Scholar]
- Barghi N, Schlötterer C.. 2020. Distinct patterns of selective sweep and polygenic adaptation in evolve and resequence studies. Genome Biol Evol. 12:890–904. [DOI] [PMC free article] [PubMed] [Google Scholar]
- Barton NH, Turelli M.. 1989. Evolutionary quantitative genetics: how little do we know? Annu Rev Genet. 23:337–370. [DOI] [PubMed] [Google Scholar]
- Bates D, Mächler M, Bolker B, Walker S.. 2015. Fitting linear mixed-effects models using lme4. J Stat Soft. 67:1–48. [Google Scholar]
- Boyle EA, Li YI, Pritchard JK.. 2017. An expanded view of complex traits: from polygenic to omnigenic. Cell. 169:1177–1186. [DOI] [PMC free article] [PubMed] [Google Scholar]
- Brenner S. 1974. The genetics of Caenorhabditis elegans. Genetics. 77:71–94. [DOI] [PMC free article] [PubMed] [Google Scholar]
- Burri R, Nater A, Kawakami T, Mugal CF, Olason PI. et al. 2015. Linked selection and recombination rate variation drive the evolution of the genomic landscape of differentiation across the speciation continuum of Ficedula flycatchers. Genome Res. 25:1656–1665., [DOI] [PMC free article] [PubMed] [Google Scholar]
- Carroll SB. 2008. Evo-devo and an expanding evolutionary synthesis: a genetic theory of morphological evolution. Cell. 134:25–36. [DOI] [PubMed] [Google Scholar]
- Castillo DM, Burger MK, Lively CM, Delph LF.. 2015. Experimental evolution: assortative mating and sexual selection, independent of local adaptation, lead to reproductive isolation in the nematode Caenorhabditis remanei. Evolution. 69:3141–3155. [DOI] [PubMed] [Google Scholar]
- Catchen J, Hohenlohe PA, Bassham S, Amores A, Cresko WA.. 2013. Stacks: an analysis tool set for population genomics. Mol Ecol. 22:3124–3140. [DOI] [PMC free article] [PubMed] [Google Scholar]
- Charlesworth B. 1990. Optimization models, quantitative genetics, and mutation. Evolution. 44:520–538. [DOI] [PubMed] [Google Scholar]
- Charlesworth B. 1996. Background selection and patterns of genetic diversity in Drosophila melanogaster. Genet Res. 68:131–149. [DOI] [PubMed] [Google Scholar]
- Charlesworth B. 2012. The effects of deleterious mutations on evolution at linked sites. Genetics. 190:5–22. [DOI] [PMC free article] [PubMed] [Google Scholar]
- Cheverud JM. 1984. Quantitative genetics and developmental constraints on evolution by selection. J Theor Biol. 110:155–171. [DOI] [PubMed] [Google Scholar]
- Colosimo PF, Hosemann KE, Balabhadra S, Villarreal G Jr., Dickson M. et al. 2005. Widespread parallel evolution in sticklebacks by repeated fixation of ectodysplasin alleles. Science. 307:1928–1933. [DOI] [PubMed] [Google Scholar]
- Comeron JM, Williford A, Kliman RM.. 2008. The Hill–Robertson effect: evolutionary consequences of weak selection and linkage in finite populations. Heredity. 100:19–31. [DOI] [PubMed] [Google Scholar]
- Cutter AD, Baird SE, Charlesworth D.. 2006. High nucleotide polymorphism and rapid decay of linkage disequilibrium in wild populations of Caenorhabditis remanei. Genetics. 174:901–913. [DOI] [PMC free article] [PubMed] [Google Scholar]
- Danecek P, Auton A, Abecasis G, Albers CA, 1000 Genomes Project Analysis Group et al. 2011. The variant call format and VCFtools. Bioinformatics. 27:2156–2158., [DOI] [PMC free article] [PubMed] [Google Scholar]
- Edgar R, Domrachev M, Lash AE.. 2002. Gene expression omnibus: NCBI gene expression and hybridization array data repository. Nucleic Acids Res. 30:207–210. [DOI] [PMC free article] [PubMed] [Google Scholar]
- Emms DM, Kelly S.. 2015. OrthoFinder: solving fundamental biases in whole genome comparisons dramatically improves orthogroup inference accuracy. Genome Biol. 16:157. [DOI] [PMC free article] [PubMed] [Google Scholar]
- Falconer DS, Mackay TFC.. 1996. Introduction to Quantitative Genetics. New York: Pearson. [Google Scholar]
- Fierst JL, Willis JH, Thomas CG, Wang W, Reynolds RM. et al. 2015. Reproductive mode and the evolution of genome size and structure in Caenorhabditis Nematodes. PLoS Genet. 11:e1005323. [DOI] [PMC free article] [PubMed] [Google Scholar]
- Fisher RA. 1918. The correlation between relatives on the supposition of Mendelian inheritance. Trans R Soc Edinb. 52:399–433. [Google Scholar]
- Franssen SU, Nolte V, Tobler R, Schlötterer C.. 2015. Patterns of linkage disequilibrium and long range hitchhiking in evolving experimental Drosophila melanogaster populations. Mol Biol Evol. 32:495–509. [DOI] [PMC free article] [PubMed] [Google Scholar]
- Hill WG. 2010. Understanding and using quantitative genetic variation. Phil Trans R Soc B. 365:73–85. [DOI] [PMC free article] [PubMed] [Google Scholar]
- Hill WG. 2014. Applications of population genetics to animal breeding: from Wright, Fisher and Lush to genomic prediction. Genetics. 196:1–16. [DOI] [PMC free article] [PubMed] [Google Scholar]
- Hill WG, Robertson A.. 1966. The effect of linkage on limits to artificial selection. Genet Res. 8:269–294. [PubMed] [Google Scholar]
- Hirsch CN, Flint-Garcia SA, Beissinger TM, Eichten SR, Deshpande S. et al. 2014. Insights into the effects of long-term artificial selection on seed size in maize. Genetics. 198:409–421. [DOI] [PMC free article] [PubMed] [Google Scholar]
- Hodgkin J. 1987. Primary sex determination in the nematode C. elegans. Development. 101:5–15. [DOI] [PubMed] [Google Scholar]
- Johansson AM, Pettersson ME, Siegel PB, Carlborg Ö.. 2010. Genome-wide effects of long-term divergent selection. PLoS Genet. 6:e1001188. [DOI] [PMC free article] [PubMed] [Google Scholar]
- Jonas A, Taus T, Kosiol C, Schlötterer C, Futschik A.. 2016. Estimating the effective population size from temporal allele frequency changes in experimental evolution. Genetics. 204:723–735. [DOI] [PMC free article] [PubMed] [Google Scholar]
- Jones AG, Rger RBU, Arnold SJ.. 2014. Epistasis and natural selection shape the mutational architecture of complex traits. Nature Comm. 5:1–10. [DOI] [PMC free article] [PubMed] [Google Scholar]
- Jorde PE, Ryman N.. 2007. Unbiased estimator for genetic drift and effective population size. Genetics. 177:927–935. [DOI] [PMC free article] [PubMed] [Google Scholar]
- Jovelin R, Ajie BC, Phillips PC.. 2003. Molecular evolution and quantitative variation for chemosensory behaviour in the nematode genus Caenorhabditis. Mol Ecol. 12:1325–1337. [DOI] [PubMed] [Google Scholar]
- Jovelin R, Comstock JS, Cutter AD, Phillips PC.. 2014. A recent global selective sweep on the age-1 phosphatidylinositol 3-OH kinase regulator of the insulin-like signaling pathway within Caenorhabditis remanei. G3 (Bethesda) 4:1123–1133. [DOI] [PMC free article] [PubMed] [Google Scholar]
- Jovelin R, Dunham JP, Sung FS, Phillips PC.. 2009. High nucleotide divergence in developmental regulatory genes contrasts with structural elements of olfactory pathways in Caenorhabditis. Genetics. 181:1387–1397. [DOI] [PMC free article] [PubMed] [Google Scholar]
- Kemper KE, Saxton SJ, Bolormaa S, Hayes BJ, Goddard ME.. 2014. Selection for complex traits leaves little or no classic signatures of selection. BMC Genomics. 15:246–214. [DOI] [PMC free article] [PubMed] [Google Scholar]
- Kenyon CJ. 2010. The genetics of ageing. Nature. 464:504–512. [DOI] [PubMed] [Google Scholar]
- Kessner D, Novembre J.. 2015. Power analysis of artificial selection experiments using efficient whole genome simulation of quantitative traits. Genetics. 199:991–1005. [DOI] [PMC free article] [PubMed] [Google Scholar]
- Kimura M. 1983. The Neutral Theory of Molecular Evolution. New York: Cambridge Univ. Press. [Google Scholar]
- Knight CG, Zitzmann N, Prabhakar S, Antrobus R, Dwek R. et al. 2006. Unraveling adaptive evolution: how a single point mutation affects the protein coregulation network. Nat Genet. 38:1015–1022., [DOI] [PubMed] [Google Scholar]
- Kofler R, Pandey RV, Schlötterer C.. 2011. PoPoolation2: identifying differentiation between populations using sequencing of pooled DNA samples (Pool-Seq). Bioinformatics. 27:3435–3436. [DOI] [PMC free article] [PubMed] [Google Scholar]
- Kofler R, Schlötterer C.. 2014. A guide for the design of evolve and resequencing studies. Mol Biol Evol. 31:474–483. [DOI] [PMC free article] [PubMed] [Google Scholar]
- Krimbas CB, Tsakas S.. 1971. The genetics of Dacus oleae. v. changes of esterase polymorphism in a natural population following insecticide control-selection or drift. Evolution. 25:454–460. [DOI] [PubMed] [Google Scholar]
- Lande R. 1979. Quantitative genetic analysis of multivariate evolution, applied to brain: body size allometry. Evolution. 33:402–416. [DOI] [PubMed] [Google Scholar]
- Lande R. 1984. The genetic correlation between characters maintained by selection, linkage and inbreeding. Genet Res. 44:309–320. [DOI] [PubMed] [Google Scholar]
- Lee RYN, Howe KL, Harris TW, Arnaboldi V, Cain S. et al. 2018. WormBase 2017: molting into a new stage. Nucleic Acids Res. 46:D869–D874., [DOI] [PMC free article] [PubMed] [Google Scholar]
- Linnen CR, Poh Y-P, Peterson BK, Barrett RDH, Larson JG. et al. 2013. Adaptive evolution of multiple traits through multiple mutations at a single gene. Science. 339:1312–1316., [DOI] [PMC free article] [PubMed] [Google Scholar]
- Love MI, Huber W, Anders S.. 2014. Moderated estimation of fold change and dispersion for RNA-seq data with DESeq2. Genome Biol. 15:550. [DOI] [PMC free article] [PubMed] [Google Scholar]
- Murphy CT, Hu PT.. 2013. Insulin/insulin-like growth factor signaling in C. elegans. In: The C. elegans Research Community WormBook, editor. WormBook. doi/10.1895/wormbook.1.164.1. http://www.wormbook.org.
- Natarajan C, Inoguchi N, Weber RE, Fago A, Moriyama H. et al. 2013. Epistasis among adaptive mutations in deer mouse hemoglobin. Science. 340:1324–1327. [DOI] [PMC free article] [PubMed] [Google Scholar]
- Nelson TC, Cresko WA.. 2018. Ancient genomic variation underlies repeated ecological adaptation in young stickleback populations. Evol Lett. 2:9–21. [DOI] [PMC free article] [PubMed] [Google Scholar]
- Orozco-terWengel P, Kapun M, Nolte V, Kofler R, Flatt T. et al. 2012. Adaptation of Drosophila to a novel laboratory environment reveals temporally heterogeneous trajectories of selected alleles. Mol Ecol. 21:4931–4941. [DOI] [PMC free article] [PubMed] [Google Scholar]
- Orr HA. 2009. Fitness and its role in evolutionary genetics. Nat Rev Genet. 10:531–539. [DOI] [PMC free article] [PubMed] [Google Scholar]
- Orr HA, Coyne JA.. 1992. The genetics of adaptation: a reassessment. Am Nat. 140:725–742. [DOI] [PubMed] [Google Scholar]
- Otte KA, Schlötterer C.. 2021. Detecting haplotype blocks in evolve and resequence experiments. Mol Ecol Resour. 21:93–109. [DOI] [PMC free article] [PubMed] [Google Scholar]
- Paaby AB, Rockman MV.. 2013. The many faces of pleiotropy. Trends Genet. 29:66–73. [DOI] [PMC free article] [PubMed] [Google Scholar]
- Palopoli MF, Peden C, Woo C, Akiha K, Ary M.. 2015. Natural and experimental evolution of sexual conflict within Caenorhabditis nematodes. BMC Evol Biol. 1–13. [DOI] [PMC free article] [PubMed] [Google Scholar]
- Pettersson ME, Johansson AM, Siegel PB, Carlborg Ö.. 2013. Dynamics of adaptive alleles in divergently selected body weight lines of chickens. G3 (Bethesda). 3:2305–2312. [DOI] [PMC free article] [PubMed] [Google Scholar]
- Phillips PC. 2005. Testing hypotheses regarding the genetics of adaptation. Genetica. 123:15–24. [DOI] [PubMed] [Google Scholar]
- Phillips PC, McGuigan KL.. 2006. Evolution of genetic variance-covariance structure. In: Fox CW, Wolf JB, editors. Evolutionary Genetics. New York: Oxford Univ. Press, p. 310–325. [Google Scholar]
- Purcell S, Neale B, Todd-Brown K, Thomas L, Ferreira MAR. et al. 2007. PLINK: a tool set for whole-genome association and population-based linkage analyses. Am J Hum Gen. 81:559–575., [DOI] [PMC free article] [PubMed] [Google Scholar]
- Quinlan AR, Hall IM.. 2010. BEDTools: a flexible suite of utilities for comparing genomic features. Bioinformatics. 26:841–842. [DOI] [PMC free article] [PubMed] [Google Scholar]
- R Core Team, R. C. 2017. R: A Language and Environment for Statistical Computing. Vienna, Austria: R Foundation for Statistical Computing. https://www.R-project.org/ [Google Scholar]
- Reynolds RM, Phillips PC.. 2013. Natural variation for lifespan and stress response in the nematode Caenorhabditis remanei. PLoS One. 8:e58212. [DOI] [PMC free article] [PubMed] [Google Scholar]
- Rockman MV. 2012. The QTN program and the alleles that matter for evolution: all that's gold does not glitter. Evolution. 66:1–17. [DOI] [PMC free article] [PubMed] [Google Scholar]
- Rodriguez M, Snoek LB, De Bono M, Kammenga JE.. 2013. Worms under stress: C. elegans stress response and its relevance to complex human disease and aging. Trends Genet. 29:367–374. [DOI] [PubMed] [Google Scholar]
- Sämann J, Hegermann J, von Gromoff E, Eimer S, Baumeister R. et al. 2009. Caenorhabditits elegans LRK-1 and PINK-1 act antagonistically in stress response and neurite outgrowth. J Biol Chem. 284:16482–16491. [DOI] [PMC free article] [PubMed] [Google Scholar]
- Schlotterer C, Kofler R, Versace E, Tobler R, Franssen SU.. 2015. Combining experimental evolution with next-generation sequencing: a powerful tool to study adaptation from standing genetic variation. Heredity. 114:431–440. [DOI] [PMC free article] [PubMed] [Google Scholar]
- Schlotterer C, Tobler R, Kofler R, Nolte V.. 2014. Sequencing pools of individuals — mining genome-wide polymorphism data without big funding. Nat Rev Genet. 15:749–763. [DOI] [PubMed] [Google Scholar]
- Sikkink KL, Ituarte CM, Reynolds RM, Cresko WA, Phillips PC.. 2014a. The transgenerational effects of heat stress in the nematode Caenorhabditis remanei are negative and rapidly eliminated under direct selection for increased stress resistance in larvae. Genomics. 104:438–446. [DOI] [PMC free article] [PubMed] [Google Scholar]
- Sikkink KL, Reynolds RM, Cresko WA, Phillips PC.. 2015. Environmentally induced changes in correlated responses to selection reveal variable pleiotropy across a complex genetic network. Evolution. 69:1128–1142. [DOI] [PMC free article] [PubMed] [Google Scholar]
- Sikkink KL, Reynolds RM, Ituarte CM, Cresko WA, Phillips PC.. 2014b. Rapid evolution of phenotypic plasticity and shifting thresholds of genetic assimilation in the nematode Caenorhabditis remanei. G3 (Bethesda). 4:1103–1112. [DOI] [PMC free article] [PubMed] [Google Scholar]
- Steiner CC, Weber JN, Hoekstra HE.. 2007. Adaptive variation in beach mice produced by two interacting pigmentation genes. PLoS Biol. 5:e219. [DOI] [PMC free article] [PubMed] [Google Scholar]
- Stiernagle T. 2006. Maintenance of C. elegans. In: The C. elegans Research Community WormBook, editor. WormBook. doi/10.1895/wormbook.1.101.1. http://www.wormbook.org. [DOI] [PMC free article] [PubMed]
- Teotónio H, Estes S, Phillips PC, Baer CF.. 2017. Experimental evolution with Caenorhabditis nematodes. Genetics. 206:691–716. [DOI] [PMC free article] [PubMed] [Google Scholar]
- Thomas CG, Woodruff GC, Haag ES.. 2012. Causes and consequences of the evolution of reproductive mode in Caenorhabditis nematodes. Trends Genet. 28:213–220. [DOI] [PMC free article] [PubMed] [Google Scholar]
- Turner TL, Stewart AD, Fields AT, Rice WR, Tarone AM.. 2011. Population-based resequencing of experimentally evolved populations reveals the genetic basis of body size variation in Drosophila melanogaster. PLoS Genet. 7:e1001336. [DOI] [PMC free article] [PubMed] [Google Scholar]
- Van der Auwera GA, Carneiro MO, Hartl C, Poplin R, Del Angel G. et al. 2013. From FastQ data to high confidence variant calls: the Genome Analysis Toolkit best practices pipeline. Curr Protoc Bioinformatics. 43:11.10.1–33., [DOI] [PMC free article] [PubMed] [Google Scholar]
- Visscher PM, Wray NR, Zhang Q, Sklar P, McCarthy MI. et al. 2017. 10 Years of GWAS discovery: biology, function, and translation. Am J Hum Genet. 101:5–22. [DOI] [PMC free article] [PubMed] [Google Scholar]
- Wagner GP, Zhang J.. 2011. The pleiotropic structure of the genotype–phenotype map: the evolvability of complex organisms. Nat Rev Genet. 12:204–213. [DOI] [PubMed] [Google Scholar]
- Waples RK, Larson WA, Waples RS.. 2016. Estimating contemporary effective population size in non-model species using linkage disequilibrium across thousands of loci. Heredity. 117:233–238. [DOI] [PMC free article] [PubMed] [Google Scholar]
- Wiberg RAW, Gaggiotti OE, Morrissey MB, Ritchie MG.. 2017. Identifying consistent allele frequency differences in studies of stratified populations. Methods Ecol Evol. 8:1899–1909. [DOI] [PMC free article] [PubMed] [Google Scholar]
- Wood AR, Esko T, Yang J, Vedantam S, The Electronic Medical Records and Genomics (eMERGE) Consortium et al. 2014. Defining the role of common variation in the genomic and biological architecture of adult human height. Nat Genet. 46:1173–1186. [DOI] [PMC free article] [PubMed] [Google Scholar]
- Wright S. 1931. Evolution in Mendelian populations. Genetics. 16:97–159. [DOI] [PMC free article] [PubMed] [Google Scholar]
- Wright S. 1968. Evolution and the Genetics of Populations, Vol. I: Genetic and Biometric Foundations. Chicago: University of Chicago Press. [Google Scholar]
- Wu TD, Nacu S.. 2010. Fast and SNP-tolerant detection of complex variants and splicing in short reads. Bioinformatics. 26:873–881. [DOI] [PMC free article] [PubMed] [Google Scholar]
Associated Data
This section collects any data citations, data availability statements, or supplementary materials included in this article.
Data Availability Statement
Supplementary Files S1 and S2 contain the full list of genes identified as differentially expressed and/or divergent. Supplementary Table S1 contains sequencing coverage for all experimental populations. Supplementary Files S1–S2, Supplementary Table S1 and all supplemental figures available on figshare (https://figshare.com/projects/Supplemental_material_for_Complex_pleiotropic_genetic_architecture_of_evolved_heat_stress_and_oxidative_stress_resistnace_in_the_nematode_Caenorhabditis_remanei_/58364). Whole-genome sequencing data are available at NCBI SRA database under accession number PRJNA422140. The transcriptome data have been deposited in NCBI’s Gene Expression Omnibus (Edgar et al. 2002) and are accessible through GEO Series accession number GSE108235. This Whole Genome Shotgun project has been deposited at DDBJ/ENA/GenBank under the accession LFJK00000000. The version described in this paper is version LFJK02000000.