Abstract

Metropolitan subway systems benefit urban communities by increasing accessibility to speedy, affordable transit while helping to decrease traffic-related air pollution and related health problems.1 However, subway commuters and transit workers may encounter unique air pollution exposures underground, including high concentrations of fine particulate matter ().2,3 In a recent study published in Environmental Health Perspectives, investigators led by David Luglio of New York University Langone Health further explored these potential exposures by assessing concentrations and composition across 12 U.S. subway transit lines.4

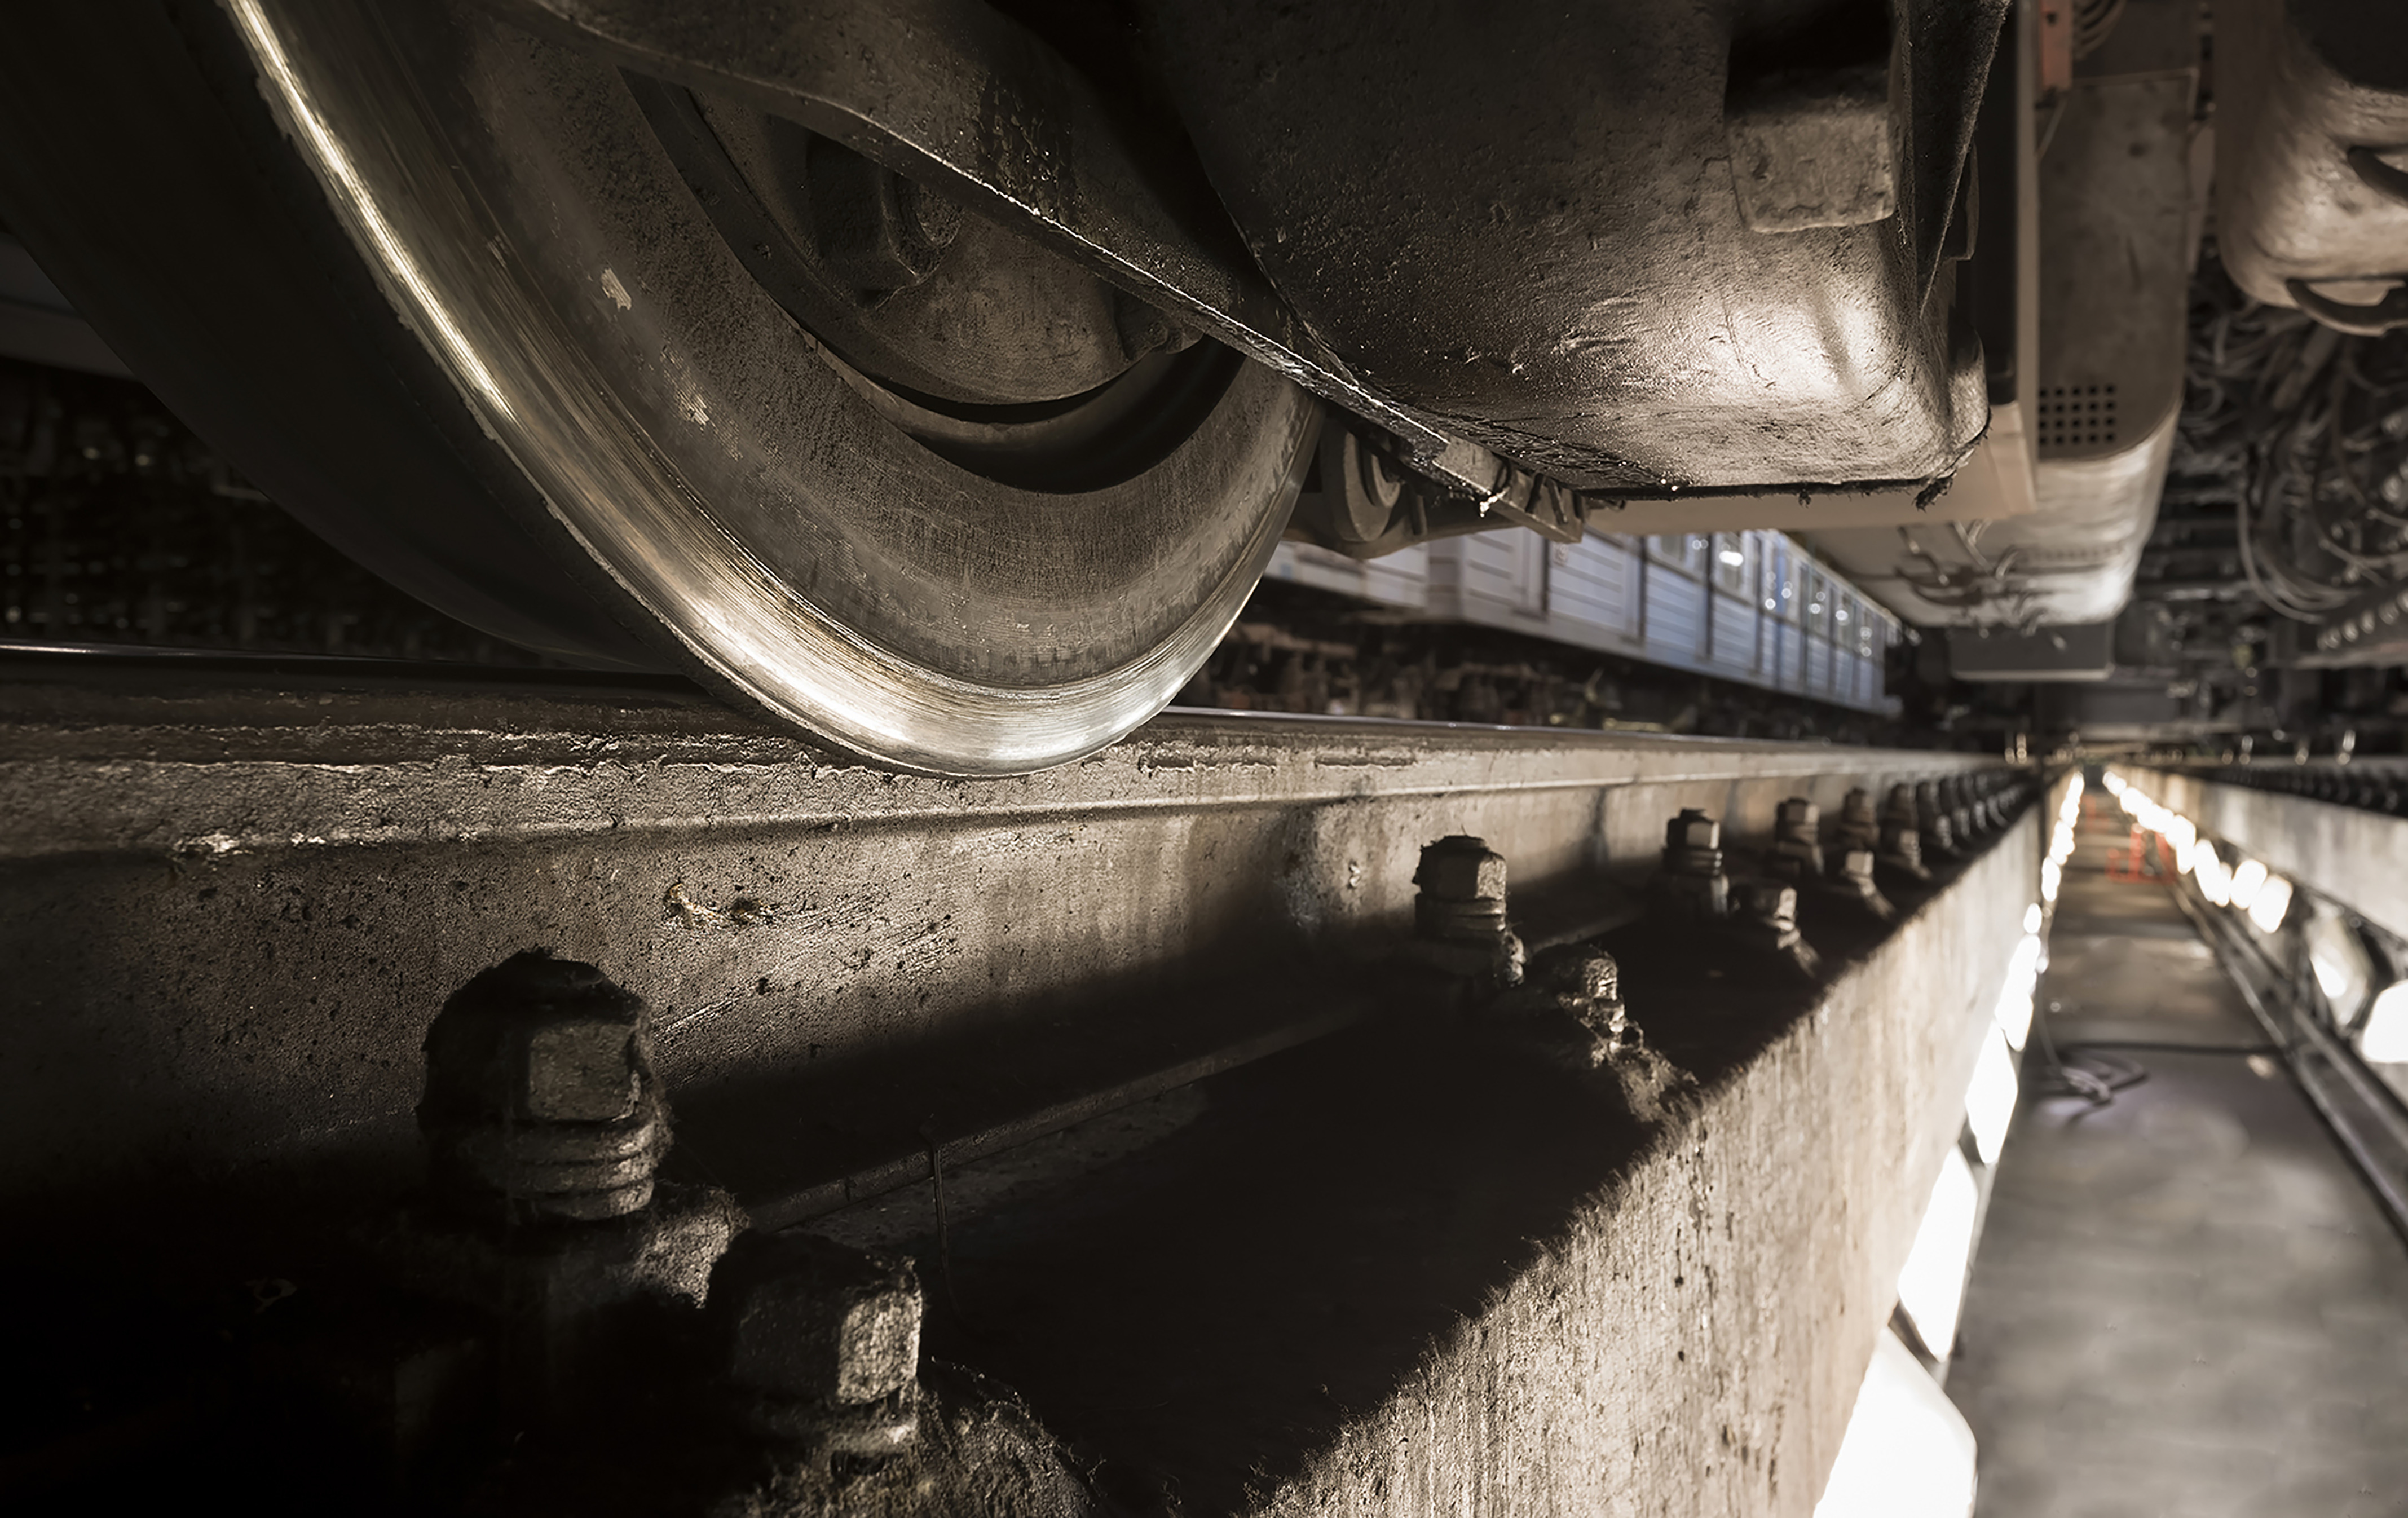
composition varies widely, depending on the sources present where it is collected. The particles collected on a subset of subway platforms varied dramatically from samples collected outside the stations. Iron made up an average of half the total mass of collected underground, likely a result of the nonstop grinding of steel wheels against rails. Image: © momente/Shutterstock.
The researchers measured airborne particles at subway platforms of 71 transit stations in Boston, New York, Philadelphia, and Washington, DC during rush hour. They selected stations from each system based on a variety of criteria, including ridership and previous evidence of high levels. Average concentrations were highest underground at the stations serviced by the New York City/New Jersey Port Authority Trans-Hudson (PATH) system, at . They identified by far the highest concentration——during the morning rush hour at the Christopher Street subway station in Greenwich Village. Concentrations were lowest for the Philadelphia stations, with an average of .
In some locations they also measured ambient concentrations aboveground, outside the subway stations, to compare against underground levels. Across all systems, underground concentrations averaged , compared with an average of aboveground. Even Philadelphia’s subway platforms, which had better air quality compared with the other metros, had an average underground concentration that was nearly nine times the aboveground ambient level.
Rush hour exposures at busy stations such as Christopher Street likely represent worst-case scenarios and may not be typical of exposures at all subway stations at all times of the day, says corresponding study author Terry Gordon, a professor of environmental medicine at New York University Langone Health. However, these worst-case scenarios are important for estimating risk, he says. Future studies should focus on identifying specific station characteristics associated with higher exposures.
Particle composition, which the investigators assessed in a subset of stations, may also be an important factor in assessing health risks and sources of air pollution for abatement efforts. They found differences in the elemental composition of across the selected stations, although iron and total carbon were always the two major constituents, accounting for an average 81% of the .
The high iron content is likely due to friction between the wheels and the rails as well as the wearing away of brake components, Gordon says. High total carbon content is a bit more puzzling, according to Steven Chillrud, a geochemist and exposure scientist at the Columbia University Lamont Doherty Earth Observatory who also has studied subway-related exposures.3 Subway commuter trains typically are powered by electricity, although diesel combustion from subway maintenance trains may be one potential source. “Further research is needed to better understand where the carbon is coming from,” says Chillrud.
It is not clear what these subway exposures mean for the health of either commuters or transit workers. The concentrations measured in subway stations during rush hour were about two to seven times the U.S. Environmental Protection Agency 24-hour ambient air safety standard of .5 For commuters, these exposures are relatively brief but may represent some of the highest exposures they will encounter during the day. Transit workers, on the other hand, may receive high exposures for much of their workday. However, this study was not designed to assess health risks.
In terms of future health research, Chillrud says a relatively easy first step would be to analyze existing health data for subway transit workers, who may have higher exposures than the general public. “If evidence was found of health issues in the workers, then it would make sense to do larger worker studies and eventually a study on the general riding public,” he says. “In vivo tox studies also would be useful.”
Biography
Lindsey Konkel is a New Jersey–based journalist who reports on science, health, and the environment.
References
- 1.Li S, Liu Y, Purevjav AO, Yang L. 2019. Does subway expansion improve air quality? J Environ Econ Manage 96:213–235, 10.1016/j.jeem.2019.05.005. [DOI] [Google Scholar]
- 2.Vilcassim MJR, Thurston GD, Peltier RE, Gordon T. 2014. Black carbon and particulate matter (PM2.5) concentrations in New York City’s subway stations. Environ Sci Technol 48(24):14738–14745, PMID: 25409007, 10.1021/es504295h. [DOI] [PMC free article] [PubMed] [Google Scholar]
- 3.Chillrud SN, Epstein D, Ross JM, Sax S, Pederson ND, Spengler JD, et al. 2004. Elevated airborne exposures of teenagers to manganese, chromium, and iron from steel dust and New York City’s subway system. Environ Sci Technol 38(3):732–737, PMID: 14968857, 10.1021/es034734y. [DOI] [PMC free article] [PubMed] [Google Scholar]
- 4.Luglio AG, Katsigeorgis M, Hess J, Kim R, Adragna J, Raja A, et al. 2021. PM2.5 concentration and composition in subway systems in the Northeastern United States. Environ Health Perspect 129(2):027001, PMID: 33565894, 10.1289/EHP7202. [DOI] [PMC free article] [PubMed] [Google Scholar]
- 5.U.S Environmental Protection Agency. EPA. What are the Air Quality Standards for PM? [website]. https://www3.epa.gov/region1/airquality/pm-aq-standards.html [accessed 4 February 2021].


