Abstract
Poor trans-ancestry portability of polygenic risk scores is a consequence of Eurocentric genetic studies and limited knowledge of shared causal variants. Leveraging regulatory annotations may improve portability by prioritizing functional over tagging variants. We constructed a resource of 707 cell-type-specific IMPACT regulatory annotations by aggregating 5,345 epigenetic datasets to predict binding patterns of 142 transcription factors across 245 cell types. We then partitioned the common SNP heritability of 111 genome-wide association study summary statistics of European (average n ≈ 189,000) and East Asian (average n ≈ 157,000) origin. IMPACT annotations captured consistent SNP heritability between populations, suggesting prioritization of shared functional variants. Variant prioritization using IMPACT resulted in increased trans-ancestry portability of polygenic risk scores from Europeans to East Asians across all 21 phenotypes analyzed (49.9% mean relative increase in R2). Our study identifies a crucial role for functional annotations such as IMPACT to improve the trans-ancestry portability of genetic data.
Approximately 80% of all genome-wide association studies (GWAS) have been performed with individuals of European (EUR) ancestry, who account for a minority of the world’s population1. Linkage disequilibrium (LD) between variants confounds inferences about causal variants, and the ancestral specificity of LD complicates the trans-ancestry portability of GWAS findings (Fig. 1a)2–7. GWAS have the potential to revolutionize the clinical utility of genetic data to the individual, exemplified by current polygenic risk score (PRS) models2,8–16. However, the predictive power of PRS relies on accurate estimation of allelic effect sizes and genetic similarity between training and target cohorts, where causal effects are captured by tagging effects due to linkage. Thus, recent studies have observed poor trans-ancestry portability of prs2,6–8,17,18. PRS are more predictive in EUR populations due to larger training datasets2,6,12,19,20. If large GWAS were performed in all non-EUR populations, trans-ancestry PRS portability would not be a critical issue. Previous studies have shown that functional annotations can improve PRS models when trained and tested on the same population21,22, by introducing biological priors on causal effect sizes and mitigating the inflation of association statistics by LD. However, the potential for functional annotations to improve trans-ancestry PRS models, where causal effects are obscured by population-specific LD, has not been demonstrated convincingly.
Fig. 1 |. Study design to identify regulatory annotations that prioritize regulatory variants in a multi-ancestry setting.
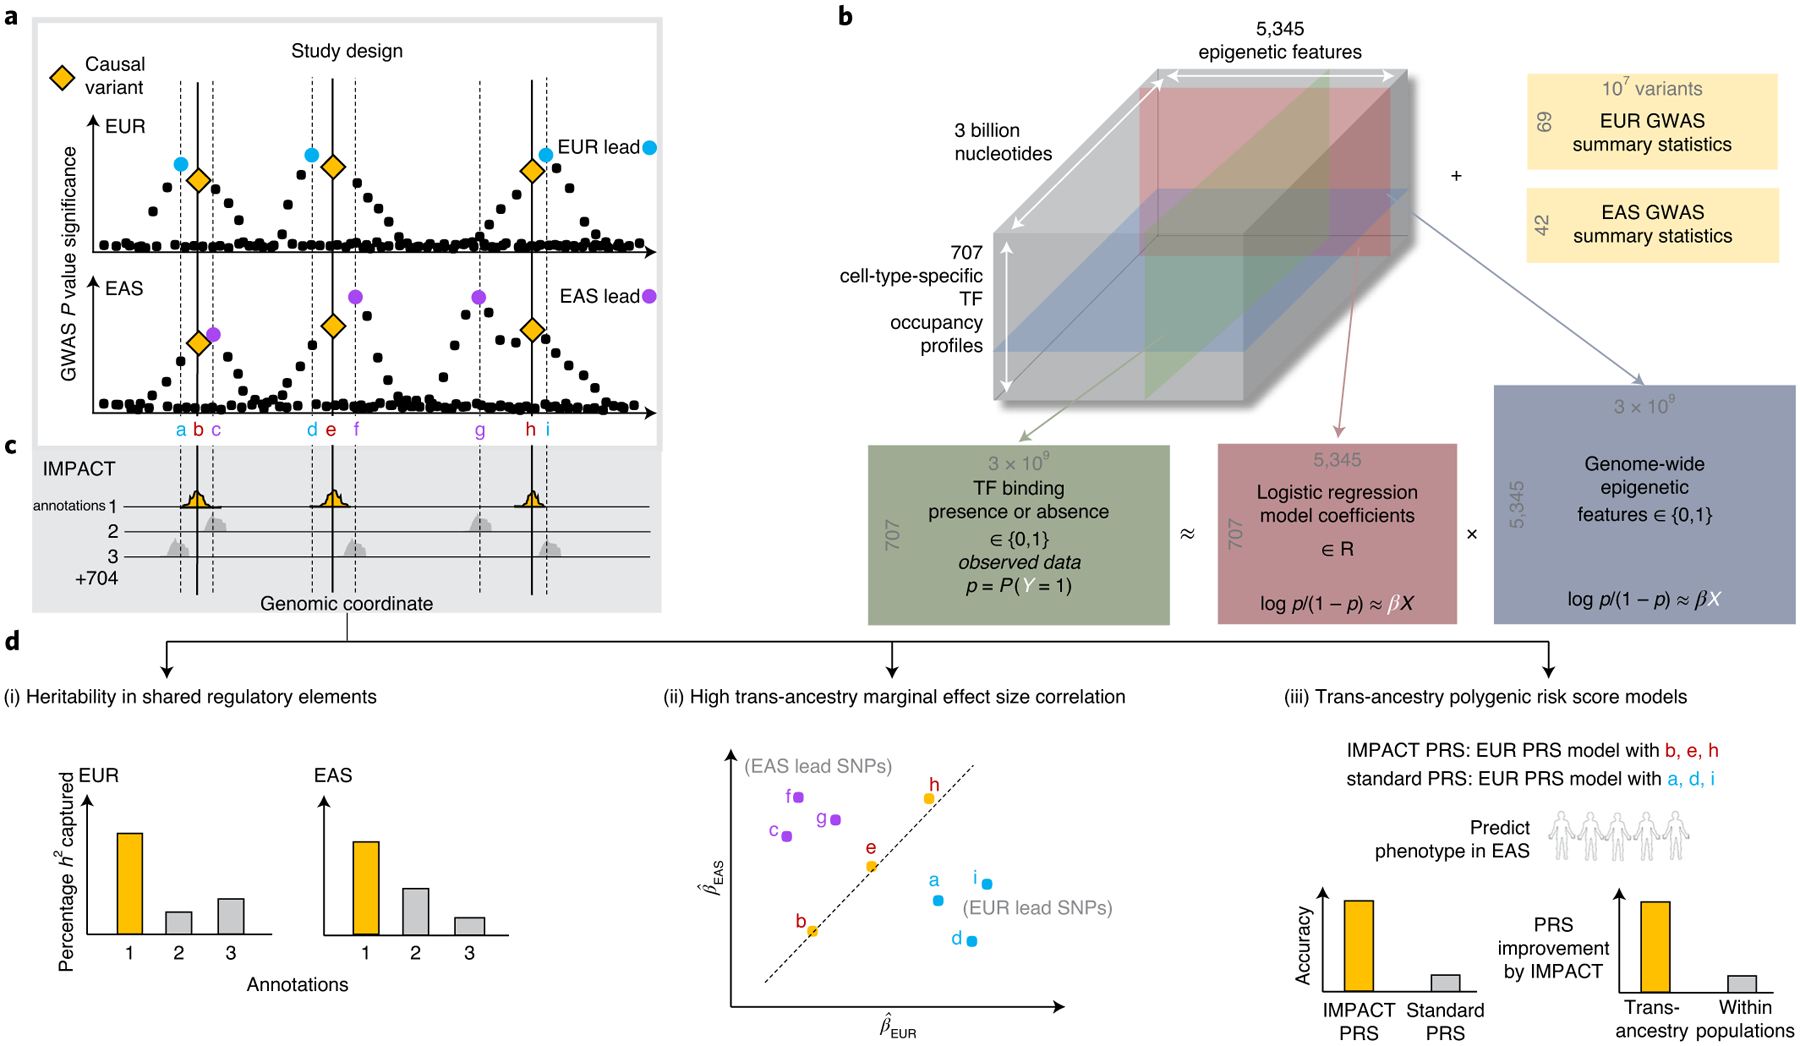
a, Population-specific LD confounding and subsequent inflation of GWAS associations complicate the interpretation of summary statistics and transferability to other populations; functional data may help improve trans-ancestry genetic portability. b, Prism of functional data in IMPACT model: 707 genome-wide TF occupancy profiles (green), 5,345 genome-wide epigenomic feature profiles (blue), and fitted weights for these features (pink) to predict TF binding by logistic regression. Using IMPACT annotations, we investigate 111 GWAS summary datasets (yellow) of EUR and EAS origin. p, probability of site-specific TF binding. c, Compendium of 707 genome-wide cell-type-specific IMPACT regulatory annotations. d, Annotations that prioritize common regulatory variants must capture large proportions of heritability in both populations (i), account for consistent marginal effect size estimations between populations (ii) and improve the trans-ancestry application of PRS (iii). h2 denotes the trait heritability, or genetic variation, causally explained by common SNPs. In (ii), the x and y axes show the the marginal effect sizes observed in EUR and EAS GWAS, respectively.
Designing functional annotations that may improve trans-ancestry PRS models is challenging. Although GWAS have identified thousands of genetic associations with complex phenotypes8,23–25, an estimated 90% of these associations reside in the noncoding genome, making their mechanisms difficult to interpret26,27. Noncoding variants can affect the epigenetic structure of DNA and interacting proteins in cell-type-specific manners. For example, genetic variation at recognition sequences of transcription factors (TFs) can lead to cell-type-specific changes in gene expression28,29. Therefore, functional annotations marking the precise location of TF-mediated cell-type-specific regulation might improve our identification of causal variants for PRS. Previous studies support the fact that the identification of causal variants can improve PRS accuracy2,6,30. We previously developed IMPACT, a genome-wide cell-type-specific regulatory annotation strategy, which learns epigenetic patterns around TF binding sites31. Here, we expand the same framework to create a powerful and generalizable resource of 707 cell-type-specific gene regulatory annotations by modeling the binding profiles of 142 TFs across 245 cell types using 5,345 epigenetic annotations (Fig. 1b,c). We hypothesized that restricting PRS to variants within trait-relevant IMPACT annotations would prioritize causal variants with regulatory roles over those associated solely through linkage. Assuming that causal variants are largely shared between populations7,23, our approach might specifically improve trans-ancestry PRS by mitigating the effects of population-specific LD.
Here, we employed our compendium of 707 IMPACT annotations to analyze complex traits and diseases from 111 GWAS summary datasets of EUR and East Asian (EAS) origin. Our results suggest that IMPACT identifies ancestrally portable genetic effects from association data: trait-associated IMPACT annotations (1) were consistently enriched for genetic variation in both populations, (2) were enriched for trans-ancestry marginal effect size correlation and (3) improved the trans-ancestry portability of PRS (Fig. 1d). Overall, this work improves the interpretation and trans-ancestry portability of genetic data, a critical step toward improved and more equitable clinical implementation of risk prediction models.
Results
A compendium of in silico gene regulatory annotations.
To capture genetic variation of diverse polygenic diseases and quantitative traits, we constructed a comprehensive compendium of 707 cell-type-specific regulatory annotation tracks. We applied the IMPACT31 framework to 707 unique TF-cell-type pairs obtained from a total of 3,181 TF ChIP–seq datasets from NCBI, representing 245 cell types and 142 TFs with known sequence motifs (Methods, Supplementary Table 1 and Extended Data Fig. 1)32. We provide publicly available open-source software corresponding to our analyses. IMPACT learns an epigenetic signature of active TF binding evidenced by ChIP–seq by differentiating bound from unbound TF sequence motifs using logistic regression. We derive this signature from 5,345 epigenetic and sequence features, predominantly generated by ENCODE33 and Roadmap34 (Methods, Supplementary Table 2 and Extended Data Fig. 1) and representing the biological diversity of the 707 candidate models (Fig. 2a). IMPACT probabilistically annotates each nucleotide genome wide on a scale from 0 to 1, without using the TF motif, to indicate regulatory regions that are similar to those that the TF binds. We extensively tested the quality and cell-type specificity of these 707 IMPACT annotations (Supplementary Note).
Fig. 2 |. IMPACT annotates relevant cell-type-specific regulatory elements.
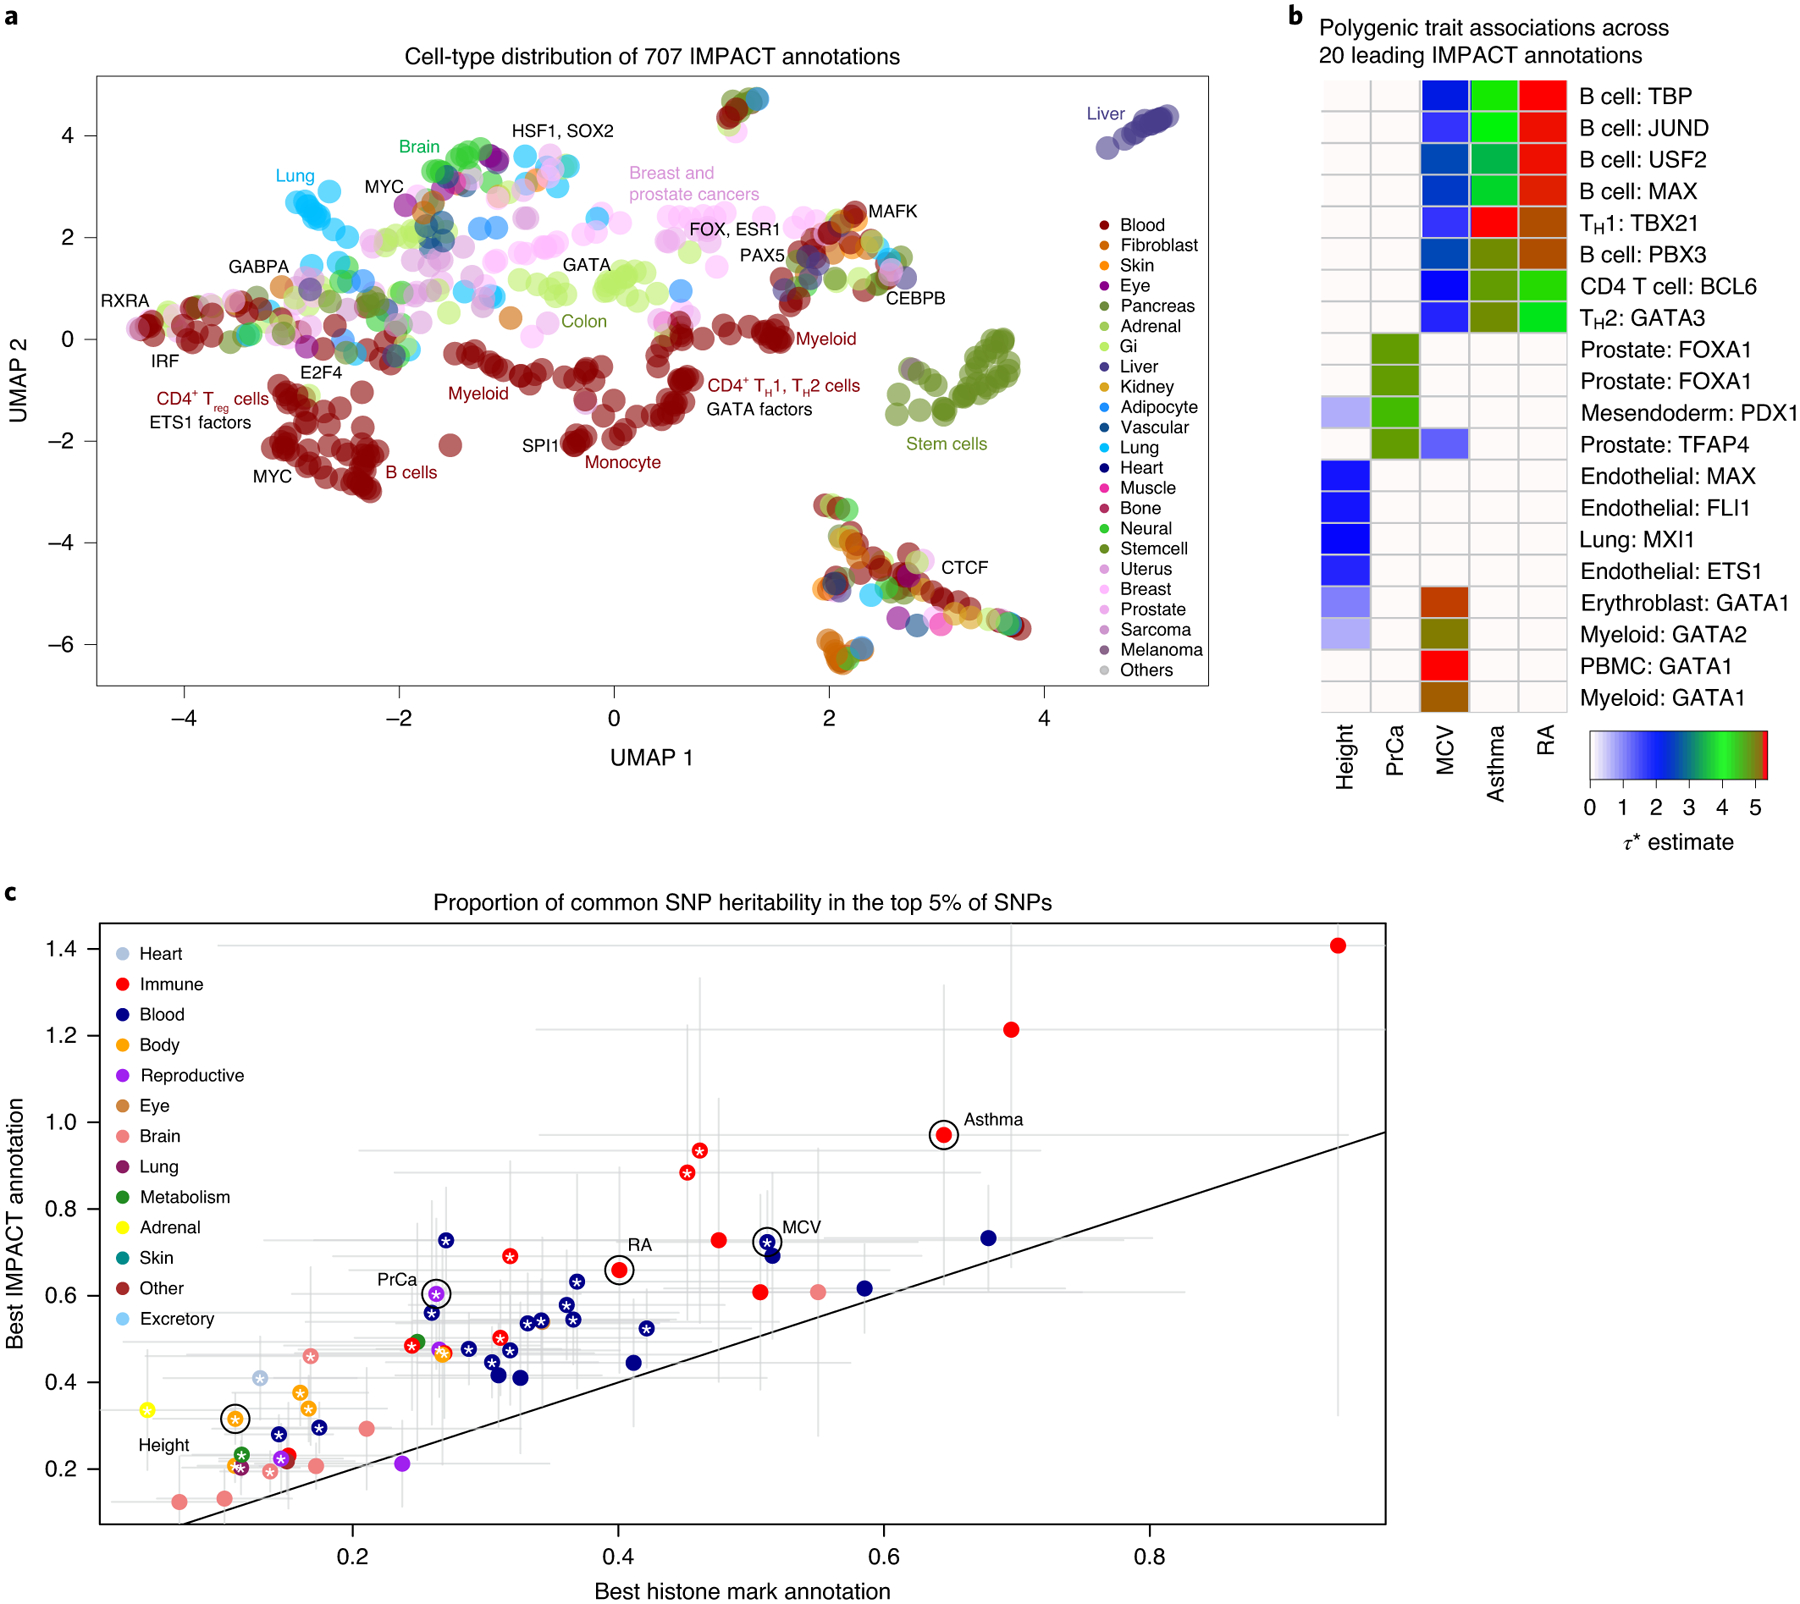
a, Low-dimensional embedding and clustering of 707 IMPACT annotations using uniform manifold approximation projection (UMAP). Annotations colored by cell-type category; TF groups indicated where applicable. b, Biologically distinct regulatory modules revealed by cell type–trait associations with significantly nonzero τ*. Shown here are the 5 representative EUR complex traits and the 4 leading IMPACT annotations for each, resulting in 20 IMPACT annotations highlighted from 707 in total. Color indicates τ* value. c, Lead IMPACT annotations capture more heritability than lead cell-type-specific histone modifications across 60 of 69 EUR summary statistics for which a lead IMPACT annotation was identified. The asterisk indicates the proportion-of-heritability-estimate difference of means P < 0.05. Gray segments indicate the 95% CI around the proportion-of-heritability estimate.
Partitioned SNP heritability of 111 EUR and EAS GWAS.
We obtained summary statistics from 111 publicly available GWAS for diverse polygenic traits and diseases. These included 69 from EUR participants (average n = 188,819, average heritability z-score = 12.9, 41 of 69 from UK BioBank (UKBB))3,31,35,36 and 42 from EAS participants of BioBank Japan6,37–39 (average n = 156.922, average heritability z-score = 6.6)3,24,37–39 (Supplementary Table 3). We focus our study on EUR and EAS populations, as there is a limited number of large GWAS in other populations1,40,41. All summary statistics are from cohorts larger than 10,000 individuals and also have significantly nonzero heritability (z-score > 1.97). There are 29 phenotypes for which we obtained summary statistics from both EUR and EAS; we observed generally high trans-ancestry genetic correlation (Supplementary Note).
To identify IMPACT annotations enriched for causal genetic variation, we then partitioned the common SNP (minor allele frequency (MAF) > 5%) heritability of these 111 datasets using S-LDSC3 with an adapted baseline-LD model excluding cell-type-specific annotations31,35 (Supplementary Fig. 3 and Methods). We tested each of the traits against each of the 707 IMPACT annotations, assessing the significance of a nonzero τ*, which is defined as the proportionate change in per-SNP heritability associated with a 1 s.d. increase in the value of the annotation (Methods)35. Of 707 by 111 (n = 78,477) possible associations subjected to 5% false discovery rate (FDR), we detected 7,993 associations, where 95 phenotypes had at least one significant annotation association (τ* > 0, two-tailed z-test FDR < 0.05; Extended Data Fig. 2, Methods and Supplementary Tables 4–8). For narrative purposes, we exemplify our results using five genetically uncorrelated and biologically diverse traits, representative of the summary statistics analyzed. These five traits include an allergic phenotype (asthma), an autoimmune disease (rheumatoid arthritis (RA)), a neoplastic type (prostate cancer (PrCa)), a hematological quantitative trait (mean corpuscular volume (MCV)) and an anthropometric trait (height). We highlight the four leading IMPACT annotations associated with EUR summary statistics for each of the five exemplary phenotypes (Fig. 2b; associations between all traits and annotations in Extended Data Fig. 2). Consistent with known biology, B and T cells were strongly associated with asthma42, RA43 and MCV44,45, while other blood cell annotations derived predominantly from GATA factors were also associated with MCV. Prostate cancer cell lines were associated with PrCa, while diverse cell types including myoblasts46, fibroblasts47, adipocytes48,49, lung cells and endothelial cells were associated with height, perhaps related to musculo-skeletal developmental pathways.
For each trait, we defined the lead IMPACT regulatory annotation as the annotation capturing the greatest per-SNP heritability, for example, the largest, while significant, τ* estimate (Supplementary Table 9). Identifying functional annotations enriched strongly for heritability is an important step to prioritizing regulatory variants for risk prediction models. With the top 5% of SNPs, lead IMPACT annotations captured an average of 43.3% of common SNP heritability (s.e.m. = 2.8%) across these 95 polygenic traits (Extended Data Fig. 3 and Methods). With the top 5% of EUR SNPs, the T-bet TH1 annotation captured 97.1% (s.d. = 17.6%) of asthma heritability. The B cell TBP annotation captured 65.9% (s.d. = 12.1%) of RA heritability. The prostate cancer cell line (LNCAP) TFAP4 annotation captured 60.4% (s.d. = 8.9%) of PrCa heritability. The GATA1 PBmC annotation captured 72.4% (s.d. = 6.0%) of MCV heritability. Lastly, the lung MXI1 annotation captured 31.6% (s.d. = 3.0%) of height heritability; notably, within the MXI1 gene lies a genome-wide significant variant associated with height50. Overall, we observed higher heritability enrichments for autoimmune diseases and hematological traits than for brain-related, lung-related and adrenal traits, likely reflecting the availability of relevant cell-type-specific functional data. To demonstrate the value of the IMPACT annotation strategy over functional annotations derived from single experimental assays and from machine learning models, we directly compared heritability analysis results and observed that IMPACT consistently outperforms these other annotation strategies (Methods and Supplementary Note). We show an example with cell-type-specific histone marks3 comparing the proportion of heritability captured in Fig. 2c and τ* in Extended Data Fig. 4. Since IMPACT annotations of the same cell type are correlated, we performed serial conditional analyses to identify IMPACT annotations explaining heritability independently from one another; we identified 38 complex traits whose genetic variation regulates multiple distinct cell-type-specific regulatory programs (Supplementary Note).
Concordance of polygenic regulation between EUR and EAS.
Previous studies have shown concordance of polygenic effects between EUR and EAS individuals in RA5 and between EUR and African American individuals in PrCa51. However, to our knowledge, the extent of this concordance has not yet been investigated across diverse traits, or with as many functional annotations as we have created for this study. Assuming shared regulatory variants in EUR and EAS, IMPACT annotations should capture similar amounts of heritability between populations (Fig. 1d–i and Fig. 3a). This would suggest that IMPACT helps pinpoint regulatory variants from association data that are portable across ancestral populations. Here, we quantified the SNP heritability (τ*) of 29 traits in EUR and EAS captured by a set of approximately 100 independent IMPACT regulatory annotations (Fig. 3b, Extended Data Fig. 5 and Methods). Across annotations, we observed that τ* estimates between EUR and EAS are strikingly similar, with a regression coefficient that is consistent with identity (slope = 0.98, s.e.m. = 0.04). For example, we observed a strong Pearson correlation of τ* between EUR and EAS for asthma (r=0.98), RA (r=0.87), MCV (r=0.96), PrCa (r=0.90) and height (r = 0.96). Cross-ancestry functional concordance is not specific to IMPACT annotations as we observed a similar relationship among cell-type-specific histone marks using the same strategy (Supplementary Fig. 11)24. However, we did not observe cross-ancestry concordance for 513 cell-type-specifically expressed gene sets (SEG)24,52, possibly due to a lack of significant associations shared between populations. Furthermore, we found that none of our τ* estimates show evidence of population heterogeneity (all two-tailed difference of means FDR > 0.56). Overall, our results suggest that regulatory variants in EUR and EAS populations are similarly enriched within the same classes of regulatory elements defined by IMPACT. This does not exclude the possibility of population-specific variants or causal effect sizes, as evidenced by 13 traits with trans-ancestry genetic correlation significantly less than 1 (P< 0.05/29 tested traits). Rather, these results suggest that causal biology including disease-driving cell types and associated regulatory elements is largely shared between these populations.
Fig. 3 |. Trans-ancestry concordance of regulatory elements defined by IMPACT.
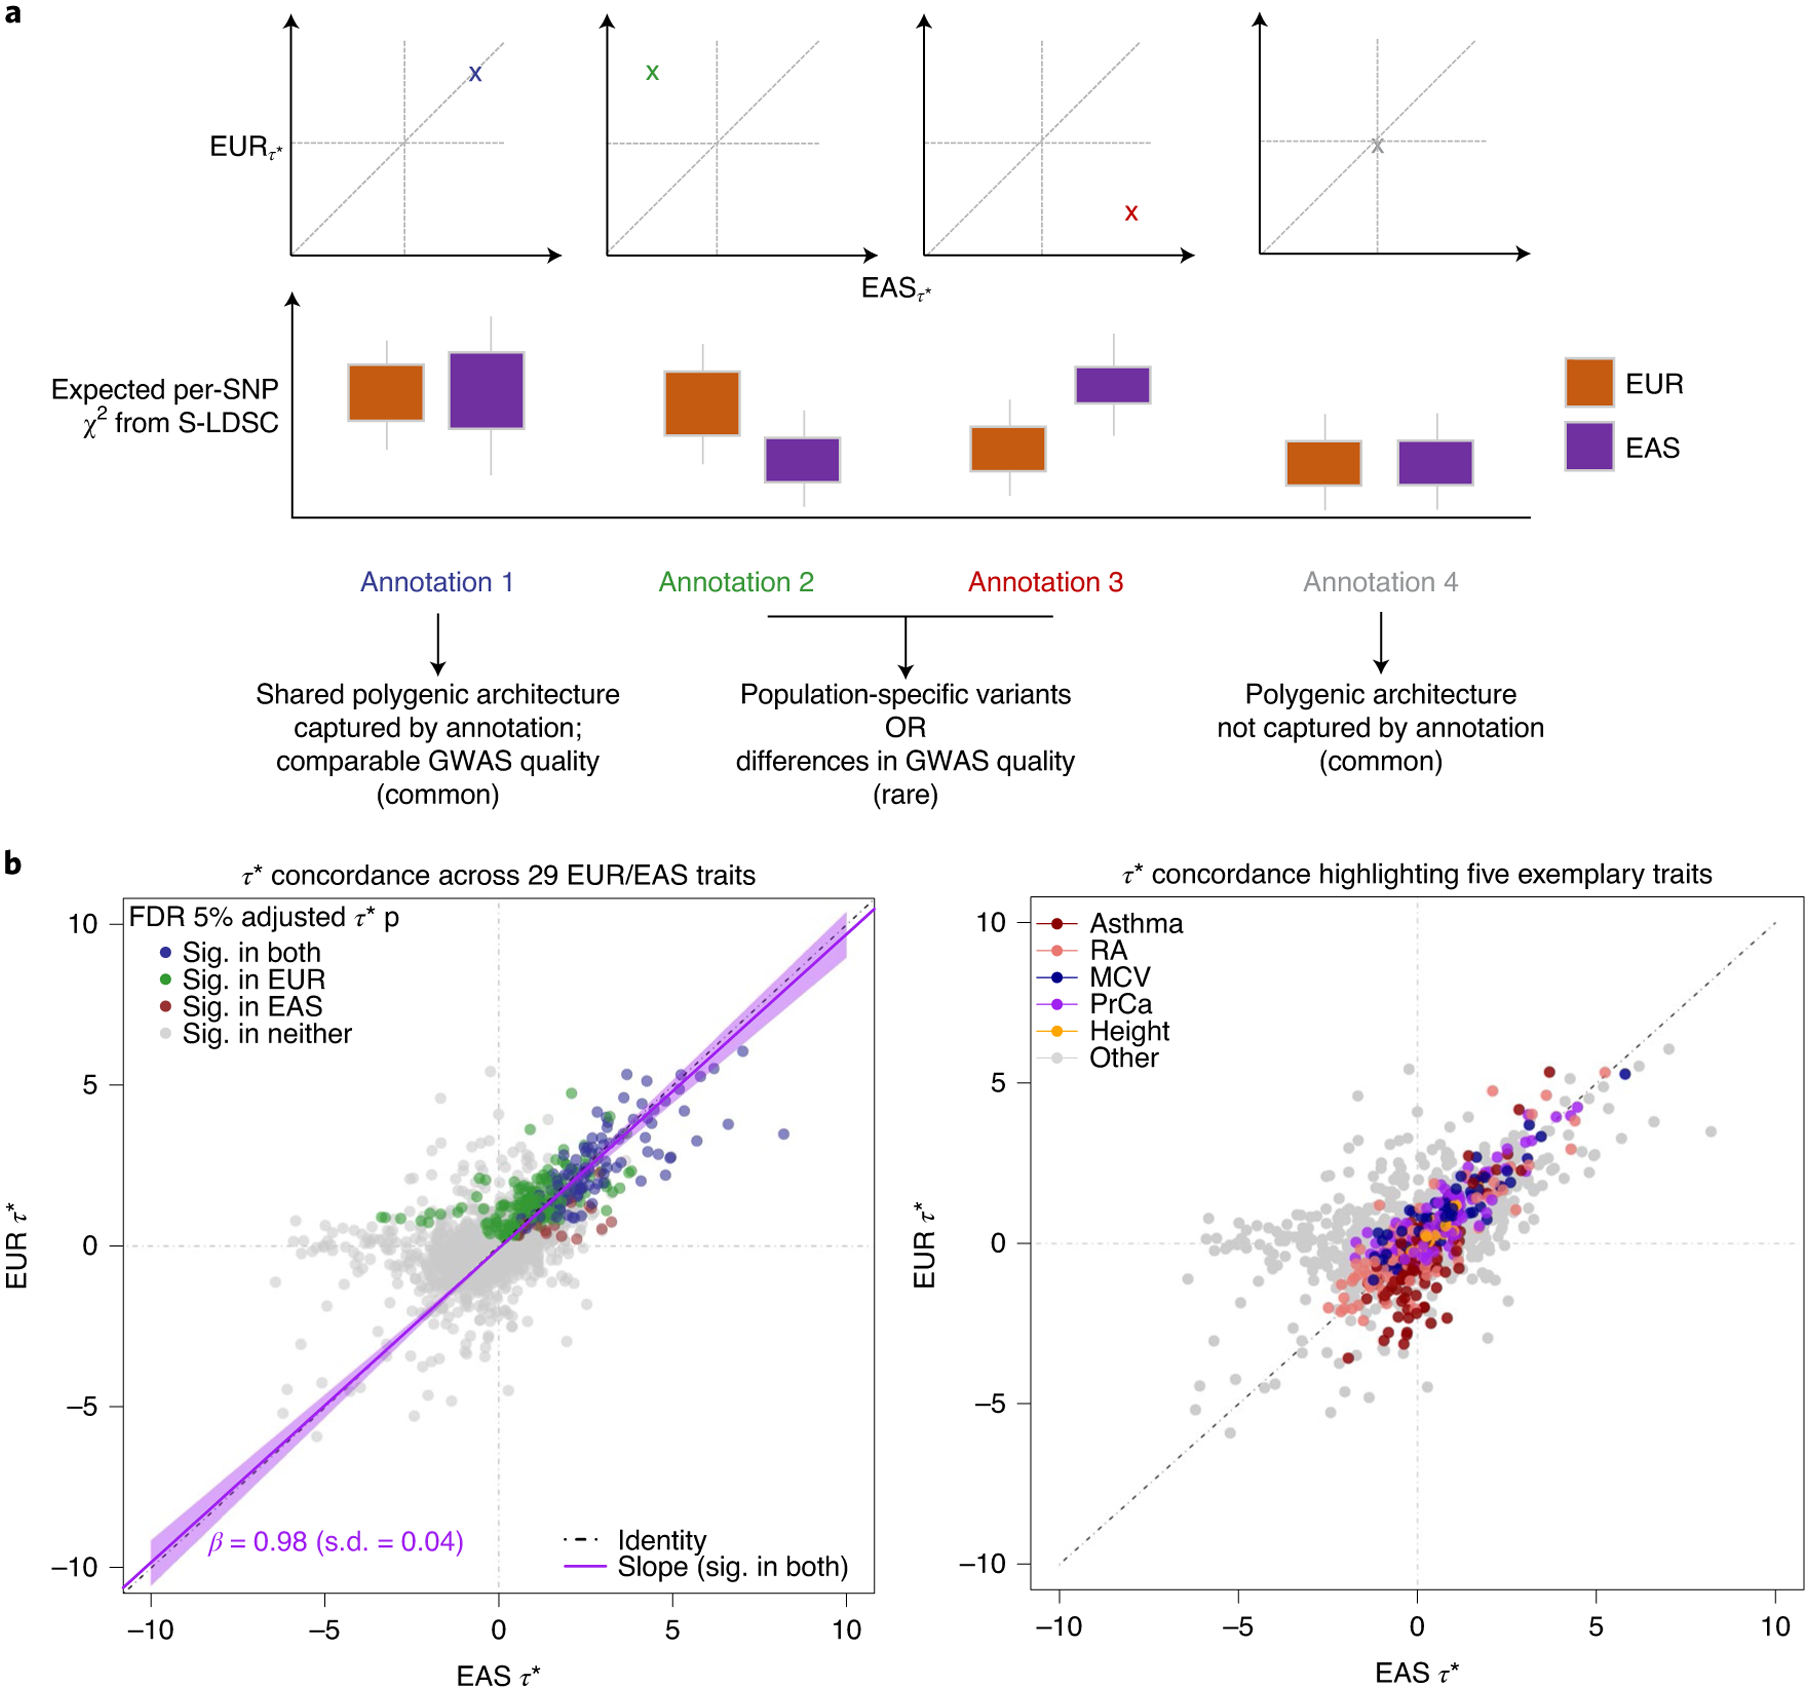
a, Illustrative concept of concordance versus discordance of τ* between populations. Concordance implies a similar distribution of causal variants and effects captured by the same annotation. The implications of discordant τ* are not as straightforward. b, Common per-SNP heritability (τ*) estimate for sets of independent IMPACT annotations across 29 traits shared between EUR and EAS. Left: color indicates τ* significance (sig.; τ* greater than 0 at 5% FDR). Line of best fit through annotations significant in both populations (dark purple line, 95% CI in light purple). Black dotted line is the identity line, y = x. Right: color indicates association to one of five exemplary traits.
IMPACT variant prioritization may improve PRS portability.
PRS models have great clinical potential: previous studies have shown that individuals with higher PRS have increased risk for disease8–12. In the future, polygenic risk assessment may become as common as screening for known mutations of monogenic disease, especially as it has been shown that individuals with severely high PRS may be at similar risk to disease as are carriers of rare monogenic mutations12. However, since PRS rely heavily on GWAS with large sample sizes to estimate effect sizes accurately, there is specific demand for the transferability of PRS from populations with larger GWAS to populations underrepresented by GWAS2,6–8,17,18,22. Here, we chose pruning and thresholding (P+T) as our PRS model6,8. P+T models select an independent subset of all SNPs genome wide by pruning away SNPs correlated by LD and then further thresholding on GWAS P value. We elected to use P+T rather than LDpred2,22 or AnnoPred21, which compute a posterior effect size estimate for all SNPs genome-wide based on membership to functional categories. With P+T, we can partition the genome by IMPACT-prioritized and deprioritized SNPs, whereas the assumptions of the LDpred and AnnoPred models do not support the removal of variants, making it difficult to assess improvement directly due to IMPACT prioritization. Moreover, these models have not been designed or tested explicitly for the trans-ancestry application of PRS and thus are beyond the scope of our work.
We conventionally define PRS as the product of marginal SNP effect size estimates and imputed allelic dosage (ranging from 0 to 2), summed over M SNPs in the model. Conventional P+T utilizes marginal effect size estimates and selects variants with the lowest P value in a locus; therefore, P+T is susceptible to selecting tagging variants. Therefore, we hypothesized that improvement due to leveraging IMPACT annotations could result from prioritizing variants with higher marginal trans-ancestry effect size correlation (Fig. 1d(ii)), suggesting these SNPs are less likely to be associated solely by linkage.
Hence, we tested this hypothesis before assessing PRS performance. We selected 21 of 29 summary statistics shared between EUR and EAS with an identified lead IMPACT association in both populations. Then, using EUR lead IMPACT annotations for each trait, we partitioned the genome in three ways: (1) the SNPs within the top 5% of the IMPACT annotation, (2) the SNPs within the bottom 95% of the IMPACT annotation and (3) the set of all SNPs genome wide (with no IMPACT prioritization). We then performed stringent LD pruning (r2 < 0.1 from EUR individuals of phase 3 of 1000 Genomes53), guided by the EUR GWAS P value, to acquire sets of independent SNPs to compute a EUR–EAS marginal effect size estimate correlation (Methods).
For example, in height, EUR–EAS effect size estimates of SNPs in the top 5% partition are 2.1-fold more similar (Pearson r = 0.29, Fig. 4a) than those in the bottom 95% partition (r = 0.14, Fig. 4b), and 1.6-fold more similar than the set of all SNPs (r = 0.18). For each of 17 GWAS P value thresholds, the marginal trans-ancestry effect size correlation among the top 5% of IMPACT SNPs tended to be greater than the set of all SNPs genome wide across 21 traits (all 17 one-tailed paired Wilcoxon P < 6.9 × 10⁻⁴) (Fig. 4c,d). Furthermore, this observation was consistent across individual traits (Supplementary Fig. 12) and was comparable to using alternative functional annotations (Supplementary Note). Since allele frequency greatly affects disease predictive power, we next analyzed the trans-ancestry concordance of allelic heterozygosity and population divergence (Fst). We found that neither increased concordance of heterozygosity nor substantial difference in Fst is a consequence of IMPACT prioritization (Extended Data Figs. 6 and 7 and Supplementary Note). Overall, our results suggest that we might anticipate improved trans-ancestry portability of PRS models by prioritizing SNPs in key functional annotations by decreasing the likelihood of selecting SNPs associated solely by linkage.
Fig. 4 |. Mechanism by which IMPACT prioritization of shared regulatory variants might improve trans-ancestry PRS performance.
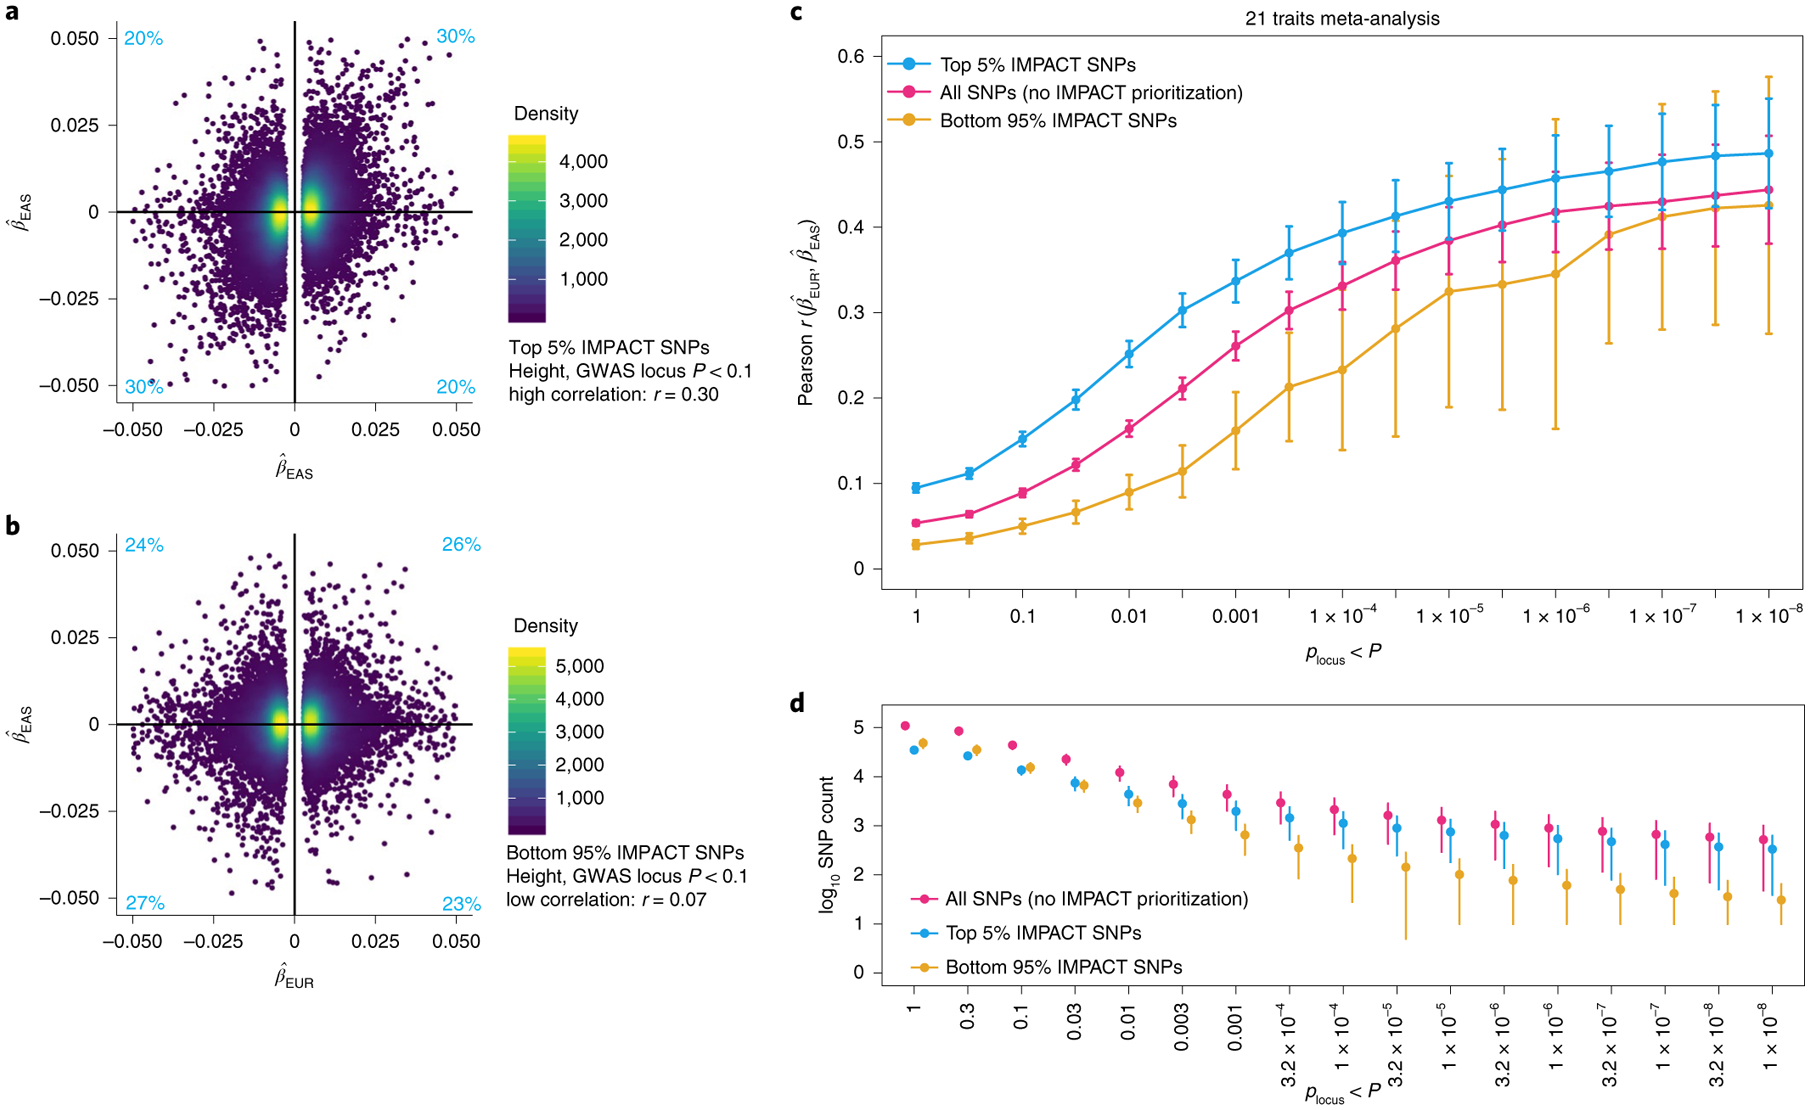
a, Estimated effect sizes of variants from genome-wide EUR and EAS height summary statistics in the top 5% of the lead IMPACT annotation for EUR height. Proportions of variants in each quadrant indicated in light blue. b, Estimated effect sizes from genome-wide EUR and EAS height summary statistics of variants in the bottom 95% of the same lead IMPACT annotation for height; mutually exclusive with SNPs in a. c, Meta-analysis of trans-ancestry marginal effect size correlations between populations across 21 traits shared between EUR and EAS cohorts over 17 GWAS P value thresholds (with reference to the EUR GWAS). Vertical bars indicate the 95% CI around the Pearson r estimate. d, Number of SNPs (log10 scale) at each P value threshold for each partition of the genome corresponding to c. Error bars indicate 1 s.d. above and below the mean.
PRS from regulatory variants improves trans-ancestry accuracy.
Finally, we addressed our hypothesis that IMPACT annotations improve the trans-ancestry portability of PRS (Fig. 1d-(iii)). For each of the 21 previously analyzed traits, we built a PRS using effect size estimates from EUR summary statistics and applied it to predict phenotypes of EAS individuals from BioBank Japan (BBJ) (Fig. 5a). Here, we compare two PRS models, both blind to any EAS genetic or functional information and removing SNPs with LD r2> 0.2, according to European individuals from phase 3 of 1000 Genomes53: (i) standard P+T PRS and (ii) functionally informed P+T PRS using a subset of SNPs prioritized by the lead EUR IMPACT annotation (Methods). In functionally informed PRS models, for each trait separately, we selected a priori the subset of top-ranked IMPACT sNps (top 1%, 5%, 10% or 50%) that explained the closest to 50% of common SNP heritability (Methods). This ensures that functional prioritization captures approximately the majority of trait-relevant genetic variation and the cumulative genetic signal among functionally prioritized variants was consistent across traits, allowing for varying degrees of polygenicity. For all PRS models, we report results from the most accurate model across nine EUR GWAS P value thresholds.
Fig. 5 |. Identifying shared regulatory variants with IMPACT annotations to improve the trans-ancestry portability of PRS.
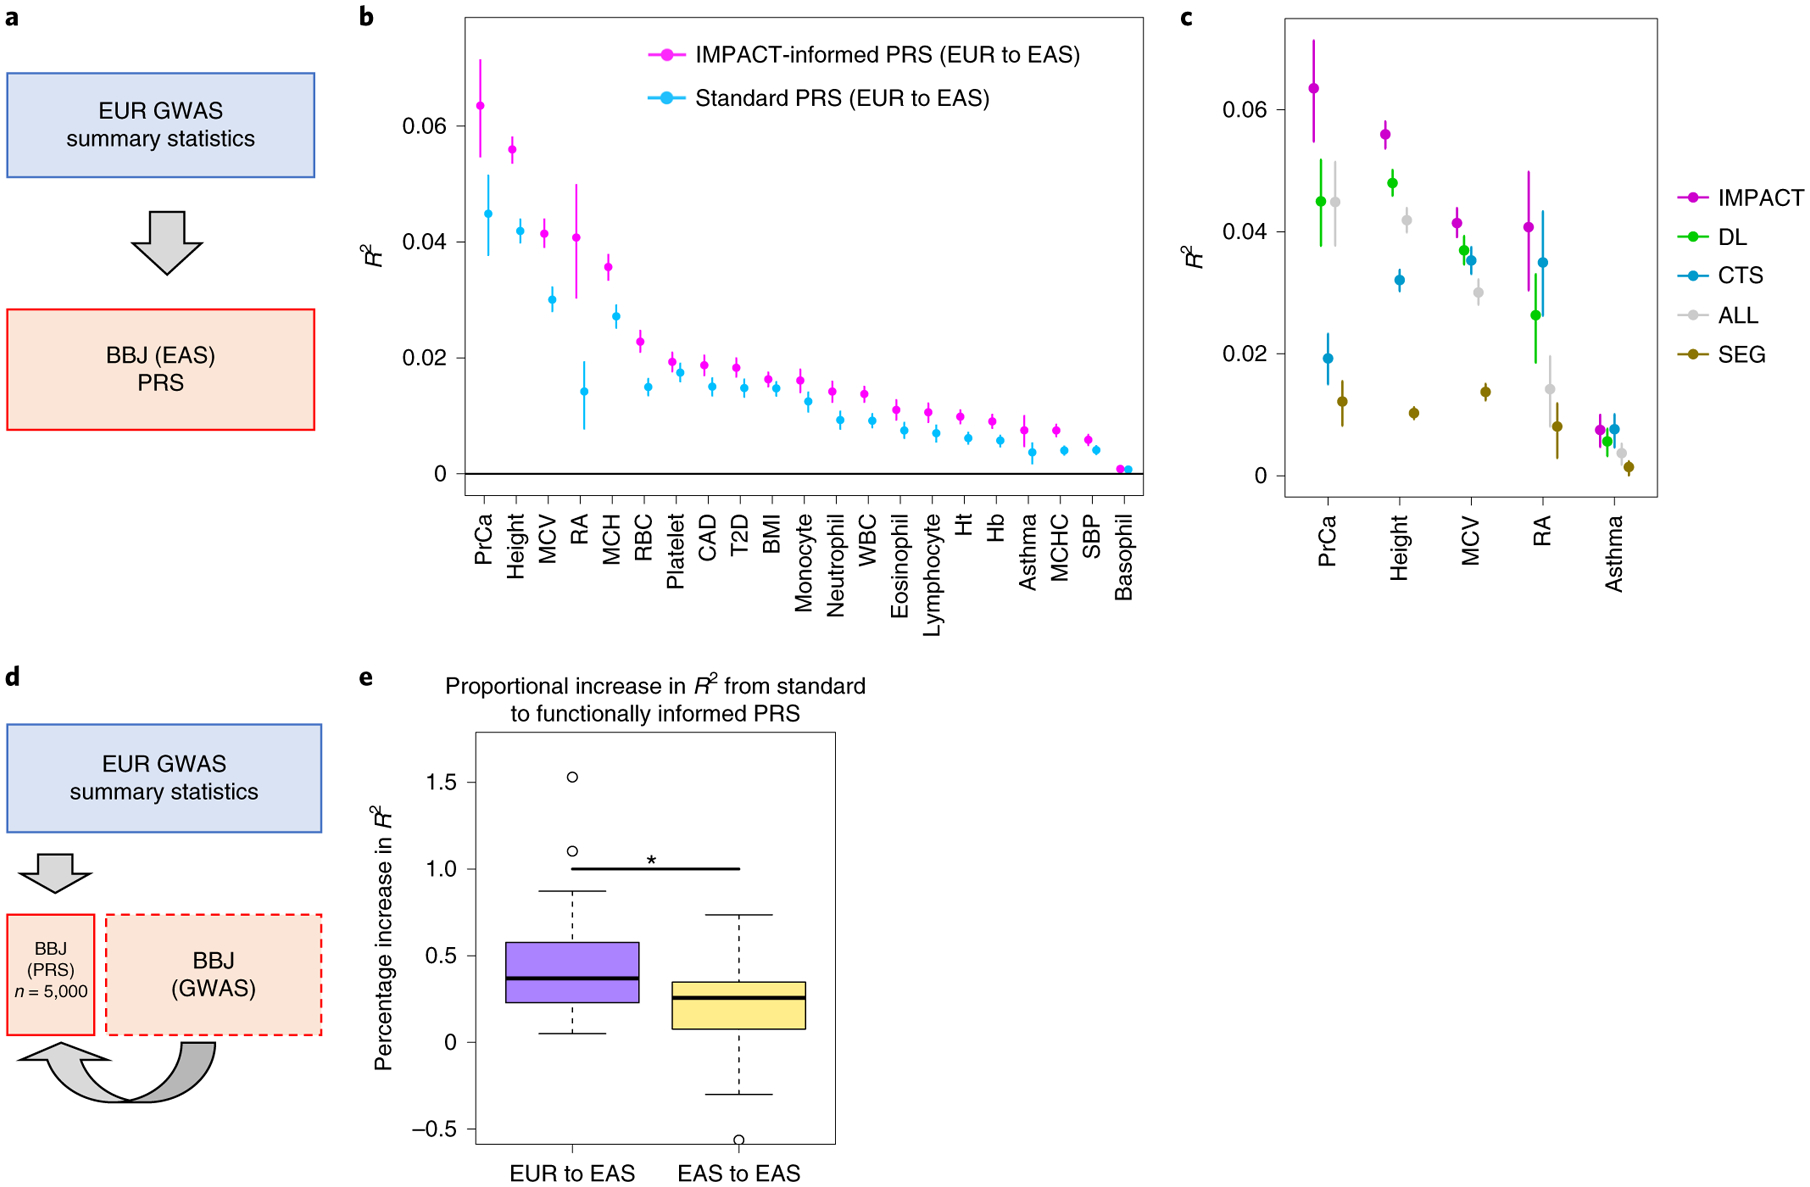
a, Study design applying EUR summary statistics-based PRS models to all individuals in the BBJ cohort. b, Phenotypic variance (R2) of BBJ individuals explained by EUR PRS using two methods: functionally informed PRS with IMPACT (pink) and standard PRS (blue). Error bars indicate 95% CI calculated via 1,000 bootstraps. c, Phenotypic variance (R2) of BBJ individuals across five exemplary traits explained by EUR IMPACT annotations relative to lead deep learning annotations (DL), cell-type-specific histone modification annotations (CTS) and lead cell-type-specifically expressed gene sets (SEG). Error bars indicate 95% CI calculated via 1,000 bootstraps. d, Study design to compare trans-ancestry (EUR to EAS) to within-population (EAS to EAS) improvement afforded by functionally informed PRS models. For each trait, 5,000 randomly selected individuals from BBJ were designated as PRS samples. The remaining BBJ individuals were used for GWAS to derive EAS summary statistics–based PRS; no shared individuals between GWAS samples and PRS samples. e, Improvement from standard PRS to functionally informed PRS compared between trans-ancestry (EUR to EAS) and within-population models (EAS to EAS) using the study design in d. In the boxplots, the center line indicates the median value; box limits indicate the upper (third) and lower (first) quartiles; the lengths of the whiskers indicate values up to 1.5 times the IQR in either direction.
For each of 21 tested traits, we observed that functionally informed PRS using IMPACT captured more phenotypic variance than standard PRS (49.9% mean relative increase in R2; Fig. 5b, Extended Data Fig. 8 and Supplementary Tables 16–18). The mean phenotypic variance explained across traits by functionally informed PRS (R2=2.1%, s.e.m. = 0.4%) was greater than by standard PRS (R2 = 1.5%, s.e.m. = 0.3%, one-tailed paired Wilcoxon P < 4.8 × 10⁻⁷). For 19 of 21 traits, IMPACT-informed PRS significantly outperformed standard PRS (19 one-tailed difference of means P < 0.05); for platelet count P = 0.052 and for basophil count P = 0.40. Using 10,000 bootstraps of the PRS sample cohort, we found that the IMPACT-informed PRS R2 estimate was consistently greater than the standard PRS estimate for all traits except basophil count (all bootstrap P < .004; Methods and Supplementary Table 18). We observed the largest improvement for RA from R2 = 1.4% (s.d. = 0.33%) in the standard PRS to R2 = 4.1% (s.d. = 0.53%, one-tailed difference of means P < 9.8 × 10⁻⁶) in the functionally informed PRS using the B cell TBP IMPACT annotation. For asthma, R2 = 0.37% (s.d. = 0.10%) in the standard PRS versus R2 = 0.75% (s.d. = 0.14%, P < 0.013) in the functionally informed PRS. For MCV, R2 = 3.0% (s.d. = 0.10%) in the standard PRS versus R2 = 4.1% (s.d. = 0.12%, P < 1.2 × 10⁻¹³) in the functionally informed PRS. For PrCa, R2 = 4.5% (s.d. = 0.36%) in the standard PRS versus R2 = 6.4% (s.d. = 0.45%, P< 6.1 × 10⁻⁴) in the functionally informed PRS. For height, R2 = 4.2% (s.d. = 0.10%) in the standard PRS versus R2 = 5.6% (s.d. = 0.12%, P < 8.7 × 10⁻²⁰) in the functionally informed PRS.
For our five representative traits asthma, RA, MCV, PrCa and height, we further compared functionally informed PRS-EUR using IMPACT to models using 123 DeepSEA and Basenji deep learning annotations54–57, 220 cell-type-specifically expressed genes (SEG)52, and 513 cell-type-specific histone modification tracks (CTS)3 (Fig. 5c, Supplementary Table 20 and Methods). To our knowledge, deep learning annotations have not been applied previously to improving PRS model performance. IMPACT explained greater phenotypic variance on average (mean R2 = 4.2%, s.e.m. = 1.0%) than the top deep learning annotations (3.2%, s.e.m. = 0.8%, one-tailed paired Wilcoxon P = 0.03). This observation was individually consistent for four of five traits (four one-tailed difference of means P < 0.006), while only trending higher for asthma (P=0.13). IMPACT also explained greater phenotypic variance on average than SEG (0.9%, s.e.m. = 0.2%, one-tailed paired Wilcoxon P = 0.03) and this difference was individually detected for each of five traits (all one-tailed difference of means P < 3.4 × 10⁻⁶). This trend was not as strong when comparing IMPACT to CTS (R2 = 2.6%, s.e.m. = 0.5%, one-tailed paired Wilcoxon P = 0.06), although this difference was detected individually for three of five traits (three one-tailed difference of means P < 1.1 × 10⁻⁴). We performed a similar bootstrap analysis as above, yielding similar results; only for RA and asthma did IMPACT-PRS not produce consistently greater R2 estimates than CTS-PRS (Supplementary Table 20).
Functionally informed PRS might, to some extent, compensate for population-specific LD differences between populations. Hence, we hypothesized that IMPACT-informed PRS would improve standard PRS, more so in the trans-ancestry prediction framework, in which EUR PRS models predict EAS phenotypes, than in a within-population framework, in which EAS PRS models predict EAS phenotypes. Here, we define within-population PRS as PRS-EAS and trans-ancestry PRS as PRS-EUR to avoid confusion. To compare PRS model improvements directly between PRS-EAS and PRS-EUR, we evaluated prediction accuracy on the same individuals. Briefly, we partitioned the BBJ cohort to reserve 5,000 individuals for PRS testing, derived GWAS summary statistics from the remaining individuals, and performed P+T PRS modeling and prediction as done above (Fig. 5d, Extended Data Fig. 9, Supplementary Figs. 18 and 19, Supplementary Tables 21 and 22 and Methods). For functionally informed PRS-EAS, we selected lead IMPACT annotations from S-LDSC results using GWAS summary statistics, as done above, on the partition of the BBJ cohort excluding the 5,000 PRS test individuals. We defined improvement as the percent increase in R2 from standard to functionally informed PRS; therefore, differences in PRS performance due to intrinsic factors, such as GWAS power or genotyping platform, cancel out. In both scenarios, we observed substantial positive improvements: averaged across the 21 traits in the trans-ancestry setting (mean percent increase in R2=47.3%, s.e.m. = 8.1%, one-tailed z-test P< 2.7 × 10⁻⁹) and in the within-population setting (mean percentage increase in R2 = 20.9%, s.e.m. = 6.6%, one-tailed z-test P< 7.5 × 10⁻⁴). Indeed, this revealed a significantly greater improvement in the trans-ancestry application than in the within-population application across the 21 traits (one-tailed paired Wilcoxon P < 0.012, Fig. 5e). Moreover, the disease predictive power of our PRS was not driven by a few loci of large effect nor the scale of our effect size estimates (Extended Data Fig. 10 and Supplementary Note). Overall, our results reveal that functional prioritization of SNPs using IMPACT improves both trans-ancestry and within-population PRS models, but is especially advantageous for the trans-ancestry application of PRS.
Discussion
In this study, we created a compendium of 707 cell-type-specific regulatory annotations to analyze 111 complex traits and diseases in EUR and EAS populations. We demonstrated that IMPACT annotations help pinpoint ancestrally portable genetic effects from association data. First, we showed that trait-associated annotations capture indistinguishable proportions of heritability between EUR and EAS populations. Second, we showed that these annotations implicate variants with higher trans-ancestry marginal effect size correlations, while negligibly affecting the distribution of Fst; this might explain the improvement driven by functional prioritization in P+T PRS models that use marginal effect sizes. Third, we showed that leveraging these annotations in PRS models improves accuracy, especially for the trans-ancestry application.
Our work, and that of others, advocates for larger genetic studies in understudied populations6 and the use of orthogonal LD-independent functional data to improve the disease predictive power of genetic models in such populations, as increasing GWAS power cannot mitigate the bias introduced by LD. Our study should not in any way be interpreted as a justification for reducing the emphasis on the need for diversity in human genetic studies. Currently, the study of trans-ancestry portability is a natural consequence of limited diversity. In a future with ancestrally diverse and high-powered genetic studies, the study of portability will serve to investigate population-specific genetic and environmental effects rather than reveal inequities.
We must consider several important limitations of our work, as our results are a consequence of the analyzed GWAS populations, polygenic traits and diseases, and available experimental data to create functional annotations. First, our functional insights are limited by biases in public TF ChIP–seq data: preference to cell lines over primary cells, rare or difficult-to-assay cell types, and preference to TFs with known regulatory roles and specific antibodies. As experimental strategies are developed to map regulatory elements, such as high-throughput CRISPR screens paired with assays for open chromatin, the IMPACT framework may need to be adapted to incorporate different types of training data. Second, the robustness of multi-ancestry comparisons rely on properties surrounding the recruitment of individuals or the exact genotyping platform used in various biobanks, which may result in cohort bias that inflates within-population PRS prediction accuracy. For example, BBJ is a disease ascertainment cohort, in which each individual has any one of 47 common diseases58,59; therefore, BBJ control samples are not comparable to healthy controls of UKBB. Other biases may arise from clinical differences in phenotyping. Third, we considered only a single non-EUR population in this study, although the disparity in trans-ancestry portability, and hence resulting benefit from functional annotations, may be greater in other non-EUR populations. Therefore, the results presented here may be used only to interpret the improved portability of genetic data between EUR and EAS populations. Further work is required to assess potential improvements in portability between EUR and other populations.
In conclusion, we demonstrated that IMPACT annotations improve the comparison of genetic data between populations and trans-ancestry portability of PRS models using ancestrally unmatched data. While a long-term goal of the field must be to diversify GWAS and other genetic studies in non-European populations, it is imperative that genetic models be developed that work in multiple populations. Such initiatives will necessitate the use of population-independent functional annotations, such as IMPACT, to capture shared biological mechanisms regulated by complex genetic variation.
Online content
Any methods, additional references, Nature Research reporting summaries, source data, extended data, supplementary information, acknowledgements, peer review information; details of author contributions and competing interests; and statements of data and code availability are available at https://doi.org/10.1038/s41588-020-00740-8.
Methods
Data.
TF ChIP–seq data.
On 15 October 2015, we downloaded all available TF chromatin immunoprecipitation followed by sequencing (ChIP–seq) data derived from human primary cells or cell lines deposited on National Center for Biotechnology Information Gene Expression Omnibus (NCBI GEO) (n = 13,732 datasets). We retained accessions for which input ChIP–seq (control data) were also generated and made public (n = 3,181 of 13,732). We downloaded raw sequencing data in SRA format from NCBI GEO, then converted the data to FASTQ format using the SRA Toolkit function fastq-dump, used FastQC for quality assessment of sequencing reads and finally mapped reads to the human genome (hg19/GRCh37) with Bowtie2 (v.2.2.5) using default parameters. All ChIP–seq datasets were matched to corresponding control data from which peaks were called with macs (v.2.1) with q value <0.01 under a bimodal model, producing 3,181 bed file-formatted files32,39. For compatibility with the IMPACT method, we selected TFs with a known sequence motif, as recorded in the MEME database. Of the 442 TFs represented by the 3,181 TF ChIP–seq datasets, only 142 matched a known sequence motif, narrowing down the total number of datasets considered to 1,542. There was no dataset removal based on cell-type classification. Of the 1,542 datasets (each characterized by a TF-cell-type pair), there were 728 unique TF-cell-type pairs, meaning many pairs have been assayed more than once. We took the union of peaks among different experiments of the same TF-cell-type pair. Therefore, the number of consolidated TF ChIP–seq datasets (n = 728 is <1,542). Then, for each of 728 datasets, we scanned TF ChIP–seq peaks for corresponding TF motifs, using HOMER (v.4.8.3)60, to identify matches exceeding the empirically determined motif detection threshold. Similarly, we identified motif sites not bound by a TF by using HOMER to scan the entire genome for sequence matches. We removed consolidated datasets with fewer than 7 peaks with TF motifs, the lower bound at which the logistic regression could converge, resulting in 707 consolidated datasets. Regarding the corresponding GEO accessions, this removal reduced the 1,542 utilized GEO accessions to 1,511. The 1,511 datasets account for 707 unique TF-cell-type pairs, 142 unique TFs and 245 unique cell types or cell lines. These 1,511 datasets selected for use with our IMPACT model framework are described in Supplementary Table 1, including accession codes and experimental details.
Genome-wide annotation data.
We augmented our set of 515 publicly available epigenomic and sequence feature annotations from our previous study31 with 116 personally curated datasets from NCBI, 2,593 ENCODE histone ChIP–seq datasets and 2,121 ENCODE open chromatin DNase-seq datasets33, all publicly available at the accessions provided in Supplementary Table 2. All files were collected in six-column standard bed file format. This augmentation brought the total number of features to 5,345.
Genome-wide association data.
We collected publicly available summary statistics data for 111 GWAS across separate cohorts of East Asian and European individuals3,24,35. East Asian GWAS data were collected from BBJ while European GWAS data were collected from either UKBB or the GWAS catalog, referred to as publicly available summary statistics (PASS) (Supplementary Table 3). Since our analysis utilized S-LDSC which is based on the polygenic inheritance model, it is crucial to include summary statistics of GWAS conducted in large-scale samples3. First, we included summary statistics of EUR GWAS in which biologically plausible polygenic signals were confirmed in previous studies (Supplementary Table 3), beginning with the set of summary statistics (n = 42) we had previously downloaded from the Price Lab and used in our previous work31. Next, we included additional diseases/traits for which both EAS (specifically BBJ) and EUR GWAS summary statistics are available. We chose to focus this study on EUR and EAS populations, as there is a very limited number of large GWAS in populations other than EUR and EAS1,40,41. As blood quantitative trait GWAS and disease GWAS were available from BBJ, we sought to collect matching EUR GWAS datasets to maximize phenotype overlap between populations. We included studies where cases were diagnosed by a physician and excluded studies which utilized self-reported cases, aiming to prepare comparable phenotypes between EAS and EUR GWAS. We downloaded such data from RIKEN, the Neale Lab and the GWAS Catalog. In summary, we collected summary statistics of 42 EAS and 69 EUR GWAS. All summary statistics used had an observed scale heritability z-score >1.96 as estimated by S-LDSC. All GWAS summary statistics were reformatted to be compatible with S-LDSC (see below) and thus contained the following information for each SNP (per row): rsID, A1 (reference allele), A2 (alternative allele), GWAS sample size (effective sample size per SNP, may vary with genotyping), chi-square statistic, z-score. For trans-ancestry genetic correlation and polygenic risk score prediction, all GWAS summary statistics were reformatted to contain the SNP ID (chr_position_A1_A2), chromosome, base pair, A1, A2, effect size estimate, effect size estimate standard error and P value.
SEG and CTS annotations.
We downloaded 513 public binary SEG annotations for EUR SNPs from phase 3 of 1000 Genomes53, indicating SNP membership to a 100-kb window around the gene body from the corresponding gene set52. We downloaded 220 public binary CTS annotations of peak data and then annotated EUR SNPs from phase 3 of 1000 Genomes to indicate binary membership to a histone mark peak3. We also acquired the corresponding SEG and CTS SNP-level annotations for EAS SNPs from phase 3 of 1000 Genomes from a previous study24. We then computed LD scores with S-LDSC and partitioned heritability using a customized version of the baseline-LD.
BBJ data.
For PRS analysis, we utilized phenotype and genotype data of the BBJ Project58,59. All of the calculations related to PRS were conducted on the RIKEN computing server. BBJ is a biobank that collaboratively collects DNA and serum samples from 12 medical institutions in Japan. This project recruited approximately 200,000 patients with the diagnosis of at least one of 47 diseases. Informed consent was obtained from all participants by following the protocols approved by their institutional ethical committees. We obtained approval from the ethics committees of the RIKEN Center for Integrative Medical Sciences and the Institute of Medical Sciences at the University of Tokyo.
Statistical methods.
IMPACT model.
We implemented our previously defined model to predict TF binding on a motif site. This model regresses the log odds of the probability (p) of a binding event on the epigenomic profile of the motif site, in a logistic regression framework over j epigenomic features as follows:
We use a weighted average of ridge and lasso regularization terms in the objective function to restrict the magnitude of fit coefficients and enforce sparsity to reduce overfitting, respectively, as follows:
We trained each of the 707 IMPACT models using up to 1,000 TF-bound sequence motifs (evidenced by ChIP–seq) and exactly 10,000 unbound sequence motifs.
Partitioning heritability with S-LDSC.
We applied S-LDSC (v.1.0.0)3 to partition the common (MAF > 5%) SNP heritability of 111 polygenic traits and diseases. We partitioned heritability using a customized version of the baseline-LD model, accounting for 69 cell-type-nonspecific baseline-LD annotations, and added one or more IMPACT annotations to the model to test for cell-type-specific enrichment. Here, heritability refers to the genetic variation causally explained by common SNPs as defined previously3, as opposed to genotyping array-based SNP heritability61,62. We use three metrics to evaluate how well our IMPACT annotations capture polygenic heritability: enrichment3, the proportion of heritability explained by the top 5% of SNPs3 and per-annotation standardized effect size, τ* (ref.35). Briefly, enrichment is defined as the proportion of common SNP heritability divided by the genome-wide proportion of SNPs in the annotation, for continuous annotations this is the average annotation value across SNPs. τ* represents the average per-SNP heritability of a category of SNPs, where a single SNP may claim membership to one or more categories. τ* has units of heritability and is comparable between traits, annotation and populations, because it is normalized for the total heritability (indicative of the power of the GWAS), the dispersion of the annotation values (annotation size) and the number of common SNPs (population specific) considered in the model, respectively. τ, the precursor of τ*, is the coefficient estimated in the S-LDSC regression. τ and τ* are conditionally dependent on the provided baseline-LD annotations. Therefore, the τ* estimate for an IMPACT annotation is considered a measure of cell-type-specific or annotation-specific SNP heritability, as the remaining annotations in the baseline-LD model are not cell-type-specific. Significance of τ* is computed using a z-test of how different the τ* estimate is from 0; the significance of strictly positive τ* estimates are reported in our study. A negative τ* would indicate a depletion of heritability, suggesting that lower values of the annotation are more enriched for trait-associated genetic variation.
Measuring heritability in top X% of SNPs of a continuous annotation.
To partition the heritability captured by top echelons of SNPs of a continuous annotation, we used the same strategy as in a previous study35. By this strategy, the proportion of heritability explained by a set of SNPs is the sum over all SNPs of the product of the τ* of each category in the S-LDSC model, for example, baseline-LD plus IMPACT annotation, and the SNP membership to that category (1 or 0 in the case of binary annotations, continuous values in the case of continuous annotations) divided by the same metric for all SNPs genome wide.
Deming regression of EUR τ* on EAS τ*.
We used an iterative pruning approach to identify independent IMPACT annotations. For each trait, we ranked all 707 IMPACT annotations by their τ* significance values. Then, we selected the lead annotation, removed all annotations correlated with Pearson r > 0.5 and selected the next lead annotation, and so on. For each trait, we regressed the EUR τ* on the EAS τ* using Deming regression, to account for standard errors, with the R function deming from the package deming. We tested the null hypothesis that the slope is equal to 1.
Trans-ancestry marginal effect size correlation, heterozygosity correlation and Fst
We acquired GWAS summary statistics for each of 21 shared traits between EUR and EAS for which there was at least one significant IMPACT association in each population. Then, we restricted to SNPs shared between EUR and EAS GWAS summary statistics. Next, we performed stringent iterative LD clumping with PLINK (v.1.90b3)63 using EUR summary statistics (selecting the most significant SNP, then removing all SNPs in LD with r2 > 0.1 within 1 Mb, then selecting the next most significant SNP and so on). We selected our initial set of SNPs under three scenarios: (1) using no functional inference, (2) using the top 5% of SNPs according to the trait’s lead EUR IMPACT annotation and (3) using the bottom 95% of SNPs according to the trait’s lead EUR IMPACT annotation (mutually exclusive with scenario 2). With our set of independent SNPs for each trait and under each of three scenarios, we compute a Pearson correlation between the estimated effect sizes, while further stratifying loci on 17 EUR P values (1, 0.3, 0.1, 0.03, 0.01, 3 × 10⁻³, 1 × 10⁻³, 3 × 10⁻⁴, 1 × 10⁻⁴, 3 × 10⁻⁵, 1 × 10⁻⁵, 3 × 10⁻⁶, 1 × 10⁻⁶, 3 × 10⁻⁷, 1 × 10⁻⁷, 3 × 10⁻⁸, 1 × 10⁻⁸). For example, stratum with P = 0.1 includes all SNPs with EUR GWAS P < 0.1. Similarly, we computed the Pearson correlation of the EUR and EAS heterozygosity, defined as 2pq, where p is the reference allele frequency and q is the alternative allele frequency, using the same sets of variants as described above. Furthermore, we computed Fst, where large values indicate a reduction in heterozygosity, at each variant and average Fst for each set of variants at each P value threshold for each of 21 considered traits. To this end, we collected the alternative allele frequencies from 1000G for EUR (EURAF) and EAS (EASAF) populations and defined Fst as follows:
where is the average between EURAF and EASAF.
Deep learning annotations from DeepSEA and Basenji.
We downloaded 32 publicly available deep learning annotations for European SNPs from phase 3 of 1000 Genomes and used S-LDSC to compute LD scores. The 32 annotations were comprised of Basenji56 and DeepSEA54 deep learning predictions corresponding to DHSes, H3K27ac, H3K4me1 and H3K4me3 meta-analyzed separately for blood and brain cell types and computed for both allelic effect and variant level models57. Additionally, we analyzed 78 new tissue-specific variant level and allelic effect annotations from DeepSEA and Basenji models (Supplementary Note).These 78 annotations corresponded to cell types that we identified as drivers of any of the five representative traits (asthma, height, MCV, RA and PrCa). These 78 annotations extend beyond histone marks and DHS features used previously57, accounting also for TF binding (DeepSEA) and CAGE features (Basenji). All 78 annotations are reported in Supplementary Table 11.
We also trained new allelic effect DeepSEA models on the TF ChIP–seq used to train what we identified as lead IMPACT annotations (13 unique) for the 21 traits investigated in the PRS analysis. We employed DeepSEA as described previously using default parameters, 1 Quadro GV100 (NVIDIA) GPU, Selene (v.0.4.7) and PyTorch (v.1.3.1)54,55. For training the DeepSEA model, we used the genomic sequences corresponding to each of the 13 TF ChIP–seq peak sets as well as any regions where ENCODE or the Roadmap Epigenomics DeepSEA dataset contained at least one TF binding event. As done in the original DeepSEA study, we randomly sampled 1-kb sequences (hg19) from regions included ENCODE, Roadmap or our TF ChIP–seq data. Considering each training TF ChIP–seq dataset separately, we determine positive samples as done in the original DeepSEA study: if more than 100 bp of the center 200 bp of the 1-kb sequence falls in our provided TF ChIP–seq peaks, this sequence is labeled with a 1, otherwise it is 0. DeepSEA accurately predicted TF binding, average area under the receiver operating characteristic curve = 0.93, s.e.m. = 0.007; training was performed on chromosomes 1–5 and 10–22, testing was performed on chromosomes 8–9 and validation was performed on chromosomes 6–7.
Polygenic risk score calculation.
In this study, we use the P+T PRS framework. We constructed PRS from either EUR summary statistics or EAS summary statistics and evaluated their predictive performance on individual EAS phenotypes. For PRS-EUR, we utilized genome-wide summary statistics from EUR as reported in their publicly available version. For PRS-EAS, we held out 5,000 individuals for PRS analysis and conducted GWAS using the remaining individuals to avoid overfitting. For each trait separately, we restricted our analysis to variants that exist in both GWAS summary statistics and post-imputation genotype data of EAS individuals used for PRS analysis (imputation quality of r2 > 0.3 in minimac3). A detailed description related to the genotyping platform and imputation strategy is provided in a previous report38. We excluded the MHC region in this analysis.
We designed PRS models using two strategies: standard PRS and functionally informed PRS. For standard PRS-EUR, we performed conventional LD clumping to acquire sets of independent SNPs using EUR LD reference panels from phase 3 of 1000 Genomes. Similarly for PRS-EAS, we utilized EAS LD reference panels from phase 3 of 1000 Genomes. We used PLINK (v.1.90b3)63 to remove variants in LD with r2 > 0.2 with a significance threshold for index SNPs of P = 0.5. For functionally informed PRS, we restricted the analysis to variants with high IMPACT score according to the lead IMPACT annotation before conducting LD clumping. As before, we define the lead annotation as the one with the largest τ* estimate that was significantly greater than 0. When we designed PRS-EUR, we utilized the lead IMPACT annotation in EUR GWAS summary statistics (EAS summary statistics were not taken into account to avoid overfitting). Similarly, when we design PRS-EAS, we utilized the lead IMPACT annotation in EAS GWAS summary statistics for which 5,000 EAS individuals for PRS analysis were removed to avoid overfitting. We performed LD clumping using variants within a predefined top percentage of IMPACT scores.
We evaluated PRS performance using EAS individuals. First, we used all individuals in the BBJ cohort for PRS-EUR testing. Second, we compared the improvement afforded by IMPACT in PRS-EUR relative to PRS-EAS models using 5,000 randomly selected individuals in BBJ; specifically for case–control GWAS, we randomly selected 1,000 cases and 4,000 controls.
For all models, we built a PRS for each individual j in our test set (in all cases, there is no overlap between GWAS samples and PRS samples) using variant effect size estimates from GWAS as follows:
| (1) |
where M is the total number of SNPs shared between GWAS summary statistics and post-imputation genotype data of EAS individuals, i is the ith SNP in the model, Aj,i is the allelic dosage of the trait-increasing allele i in individual j and βi is the estimated effect size of allele i from GWAS. We calculated PRS using PLINK2.
For quality control of quantitative phenotypes, we excluded (1) related samples (PI_HaT>0.187 estimated by PLINK), (2) samples with age <18 and age >85, and (3) samples with measured values outside three interquartile ranges (IQR) of the upper or lower quartiles. The effect of sex, age, age2, the top 10 genotyping principal components (PCs) and affection status of 47 diseases were removed by linear regression, and the residuals were further normalized by the rank-based inverse normal transformation (see equation (3) below). For quality control of case–control phenotypes, we excluded (1) related samples (PI_HAT>0.187 estimated by PLINK) and (2) samples with age <18 and age >85.
We then regressed our phenotype of interest (Y), a measured quantitative trait or a diagnosed disease among the PRS samples, on the per-individual PRS as follows.
For diseases,
| (2) |
For quantitative traits,
| (3) |
We then report the variance explained; for quantitative traits, this is the variance explained by a linear model and for diseases, the variance explained is from a logistic model (Nagelkerke R2)2,3,64, which we convert to liability scale pseudo R2 such that R2 values are comparable among both quantitative and case–control phenotypes. We used various GWAS P value thresholds (0.1, 0.03, 0.01, 0.003, 0.001, 3 × 10⁻⁴, 1 × 10⁻⁴, 3 × 10⁻⁵, 1 × 10⁻⁵) to assess the predictive performance of our PRS.
To estimate confidence intervals of PRS performance (R2, as explained above), we conducted 1,000 bootstraps using the R package boot. We also conducted 10,000 bootstraps to evaluate whether the R2 difference between two PRS models (functionally informed – standard) is significantly greater than 0; we calculated the R2 difference between two PRS models in each round of bootstrapping (delta R2), and assessed its distribution in 10,000 bootstraps. If we let N be the frequency of delta R2 < 0, we define one-tailed P values for delta R2 > 0 as (N + 1)/10,000.
GWAS in BBJ.
As described in the previous section, we held out 5,000 randomly selected individuals for the PRS analysis and performed GWAS on the remaining individuals (sample sizes in Supplementary Tables 16 and 17). GWAS was conducted with PLINK2 using the same imputed dosages as used in the PRS analysis. For quantitative traits, normalized residuals were analyzed by linear regression. For diseases, affection status was analyzed by logistic regression using age, sex and the top 10 genotype PCs as covariates.
Reporting Summary.
Further information on research design is available in the Nature Research Reporting Summary linked to this article.
Data availability
Data are available at: IMPACT Github repository: https://github.com/immunogenomics/IMPACT; IMPACT 707 annotations: https://github.com/immunogenomics/IMPACT/tree/master/IMPACT707. Data were obtained from the following resources: HOMER: http://homer.ucsd.edu/homer/motif/; S-LDSC: https://github.com/bulik/ldsc; 1000 Genomes: http://www.internationalgenome.org/; cell-type-specifically expressed gene set annotations and LD scores: https://data.broadinstitute.org/alkesgroup/LDSCORE/LDSC_SEG_ldscores/; cell-type-specific histone modification ChIP–seq datasets: https://data.broadinstitute.org/alkesgroup/LDSCORE/; Plink: https://www.cog-genomics.org/plink2; Riken website: http://jenger.riken.jp/en/; Price Lab GWAS summary statistics: https://data.broadinstitute.org/alkesgroup/sumstats_formatted/; Neale Lab GWAS summary statistics: http://www.nealelab.is/uk-biobank; GWAS catalog: https://www.ebi.ac.uk/gwas/; Deep Learning: https://data.broadinstitute.org/alkesgroup/LDSCORE/DeepLearning/.
Code availability
We have provided code to recreate our analyses at https://github.com/immunogenomics/IMPACT/tree/master/IMPACT707/AnalysisCode.
Extended Data
Extended Data Fig. 1 |. Data collection.
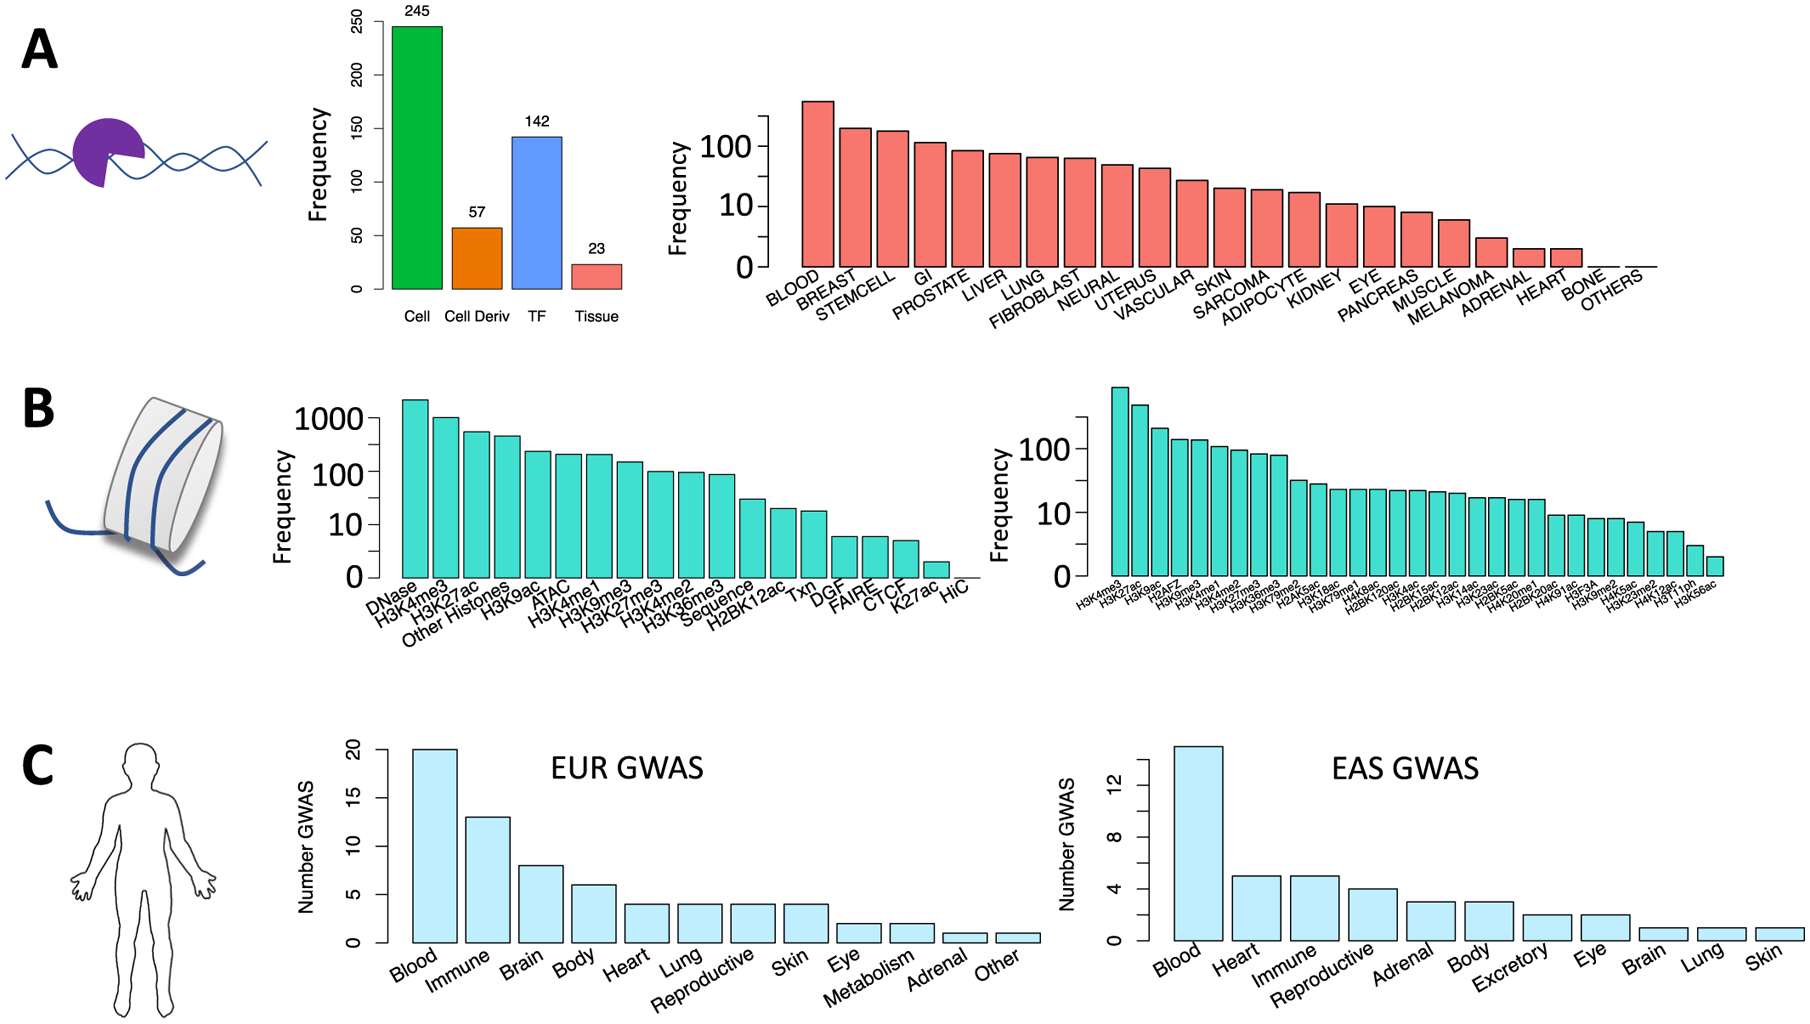
a) TF ChIP-seq collection from NCBI: (left) cell type and TF diversity where ‘Cell Deriv’ indicates number of unique parental cell types, for example GM12878 and GM10847 are both B cell lines, (right) diversity of tissue types. b) (left) Epigenomic and sequence features to be used in IMPACT models, (right) diversity of histone modification ChIP-seq in features. c) Diversity of European (EUR) and East Asian (EAS) GWAS summary statistics across phenotypic categories.
Extended Data Fig. 2 |. IMPACT annotation-trait associations.
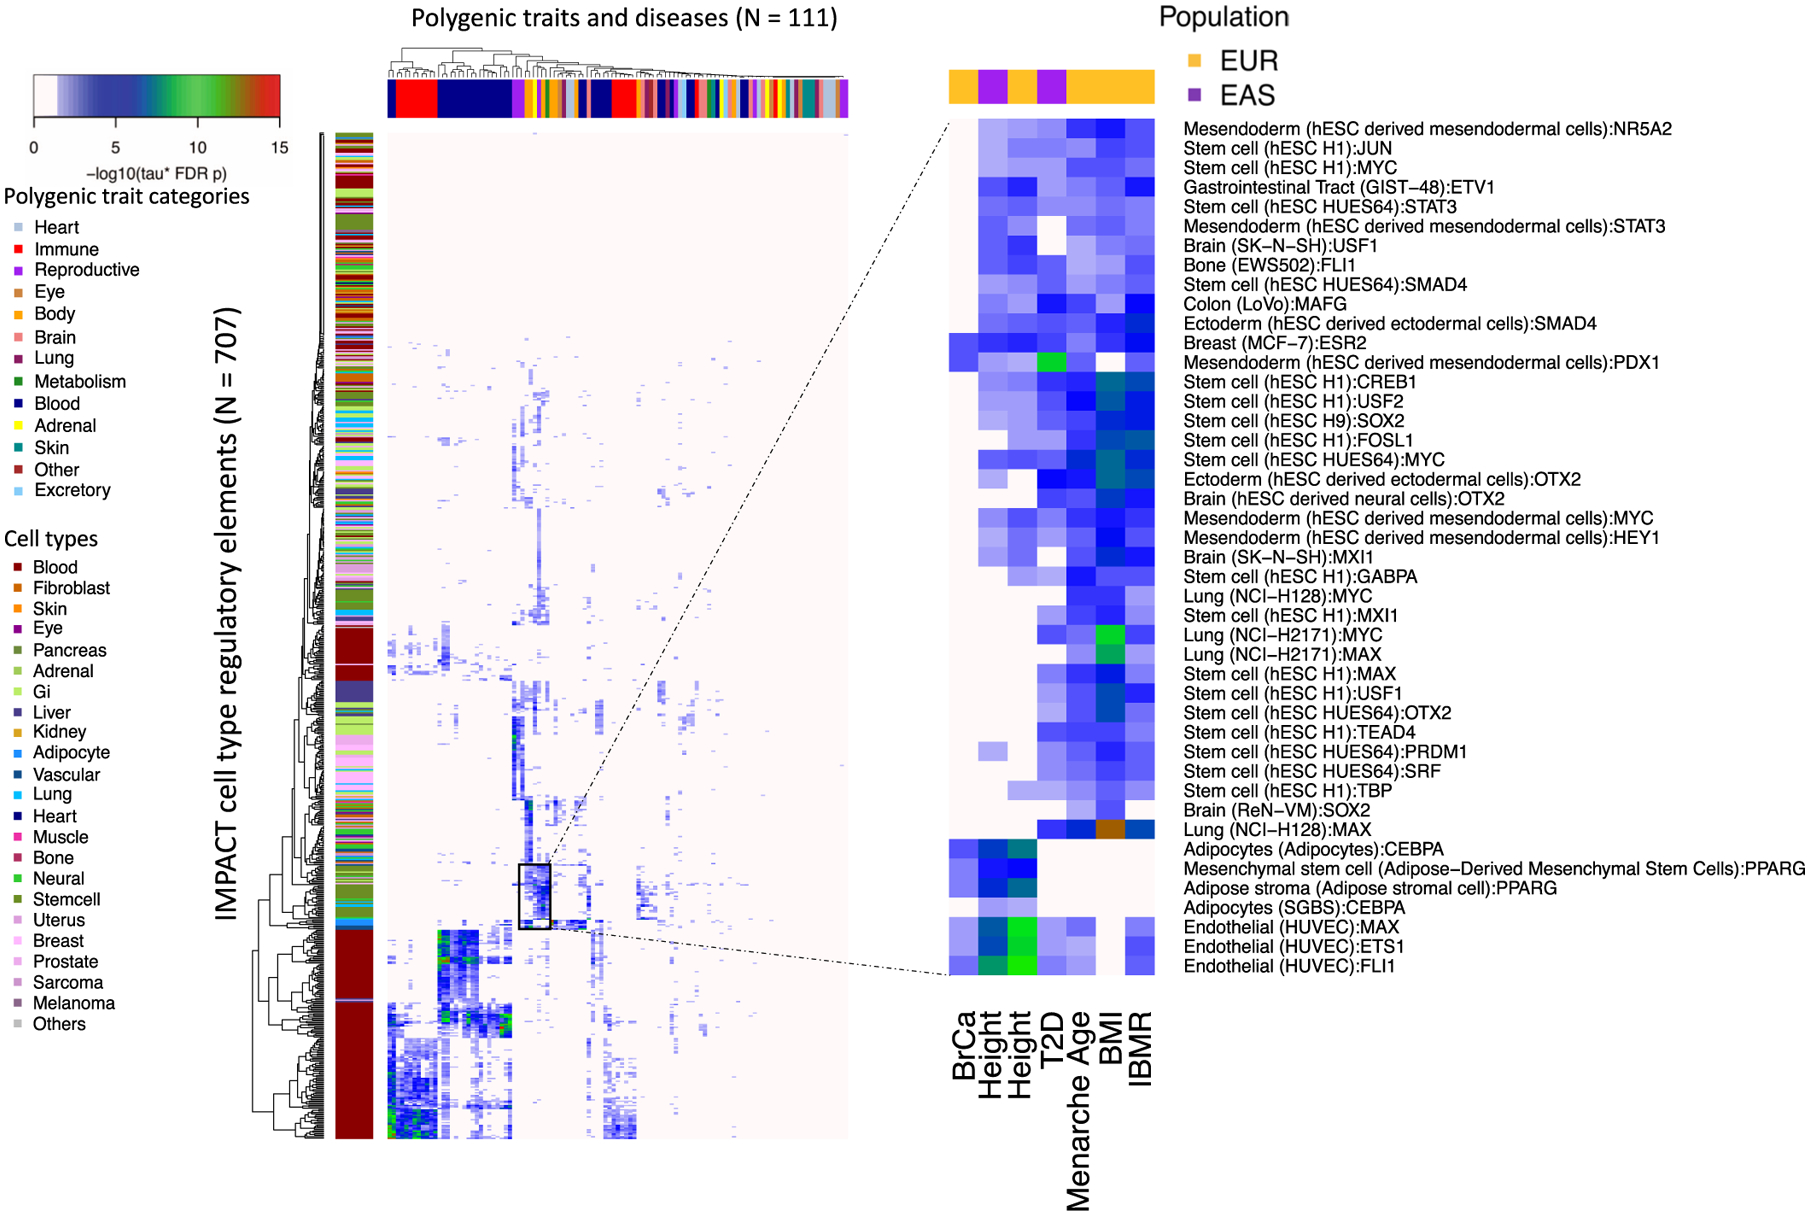
Significant cell type-phenotype associations across 707 IMPACT regulatory annotations and 111 complex traits and diseases at τ* 5% FDR, color indicates −log10 FDR 5% adjusted P value of τ*. Zooms shows particular cell type categories enriched for polygenic trait associations.
Extended Data Fig. 3 |. Proportion of heritability in the top 5% of SNPs.
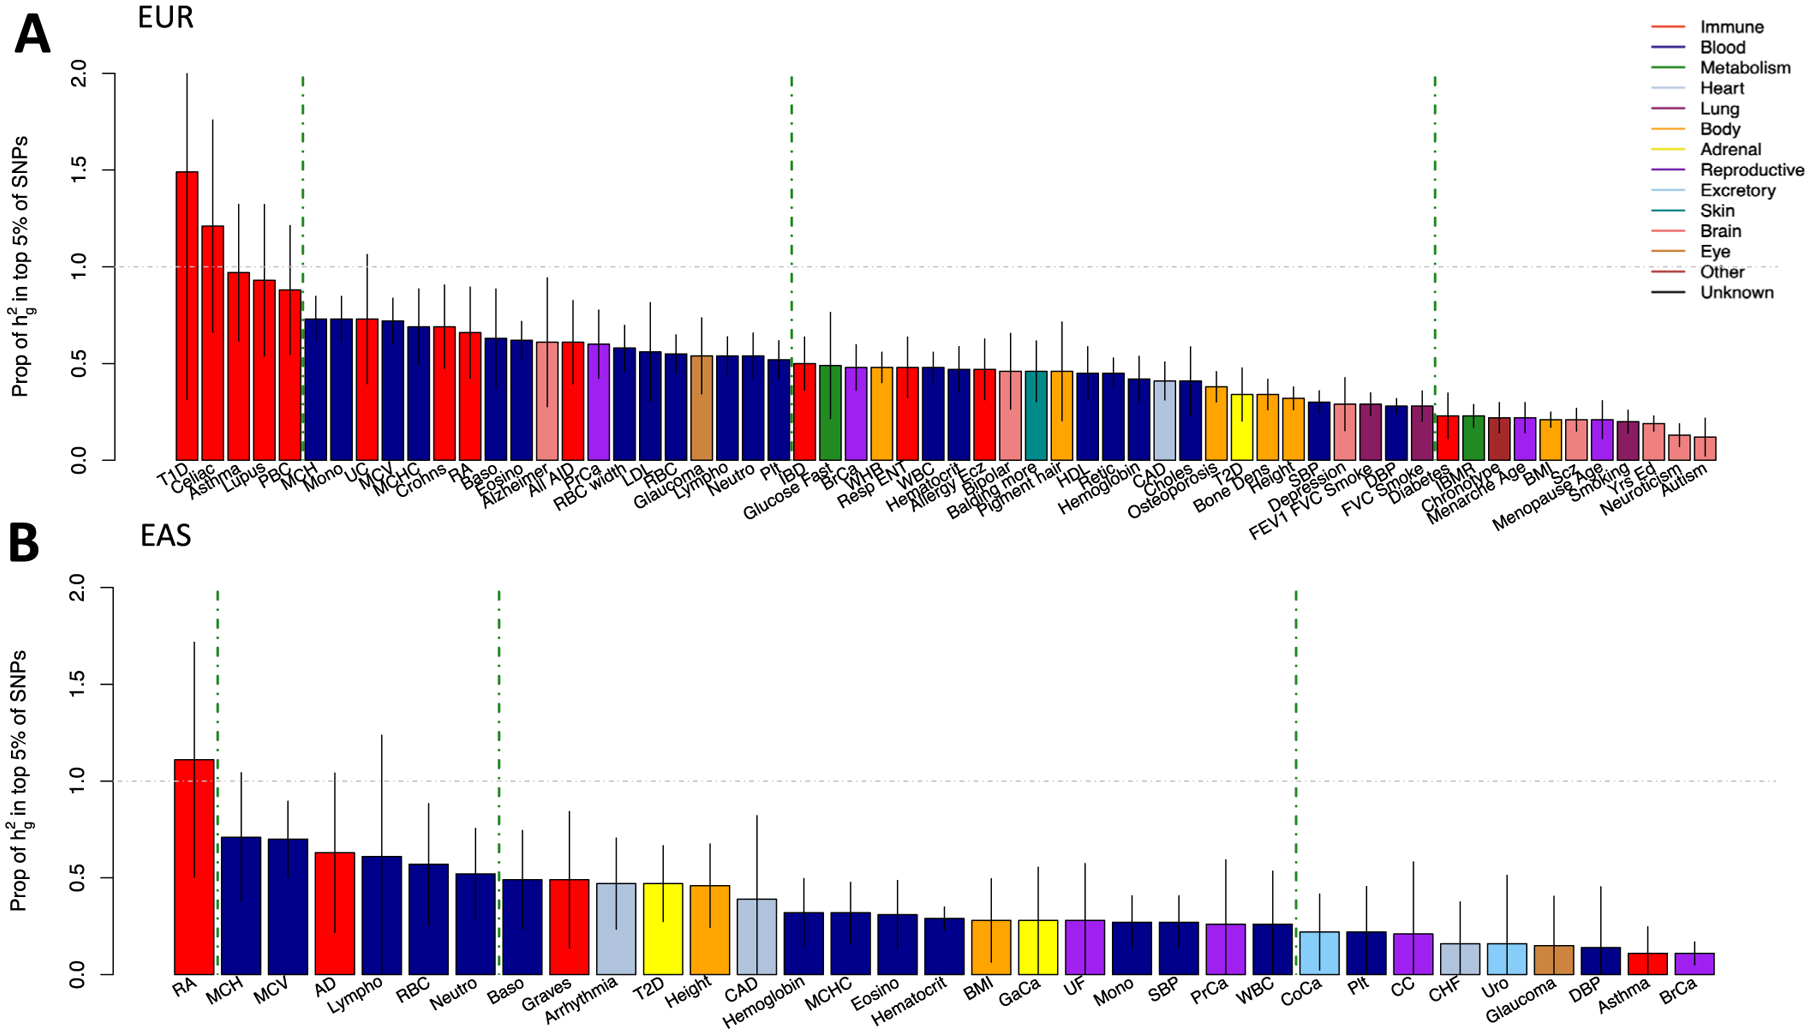
a) Common SNP heritability captured by the top 5% of SNPs according to the lead cell type association for each EUR GWAS. Lead association determined by largest τ* estimate that is significantly positive. b) Similar for each EAS GWAS. Gray bars indicate the standard error of the heritability estimate. Color represents the category of the complex trait or disease.
Extended Data Fig. 4 |. τ* comparison of IMPACT annotations versus cell-type-specific histone marks.
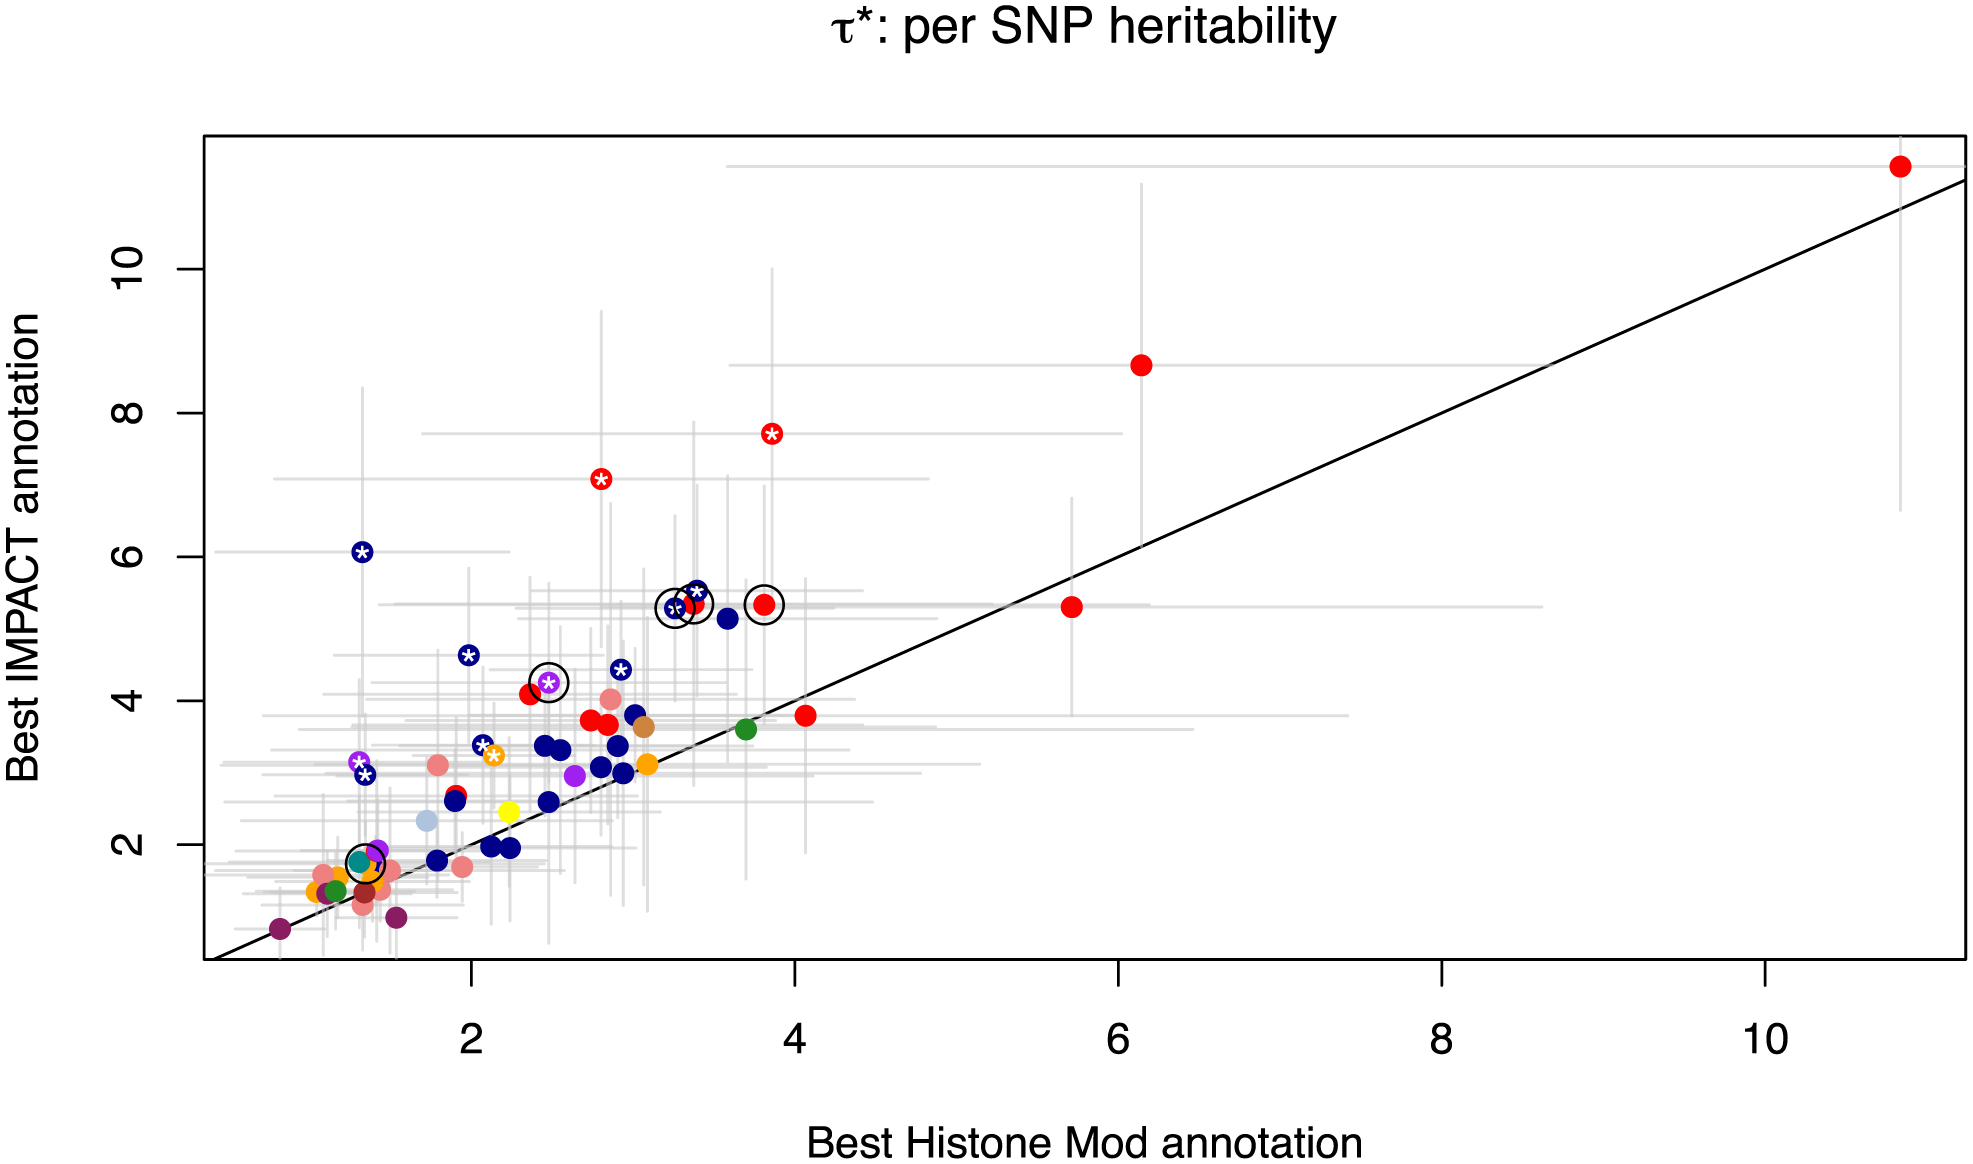
Comparison of two different functional annotations, IMPACT and cell-type-specific histone marks, to capture polygenic heritability assessed by quantifying τ* per-SNP heritability value. Circled are five representative traits used throughout the study: asthma, RA, PrCa, MCV, and height.
Extended Data Fig. 5 |. Common per-SNP heritability (τ*) estimate for sets of independent IMPACT cell type annotations across 29 traits.
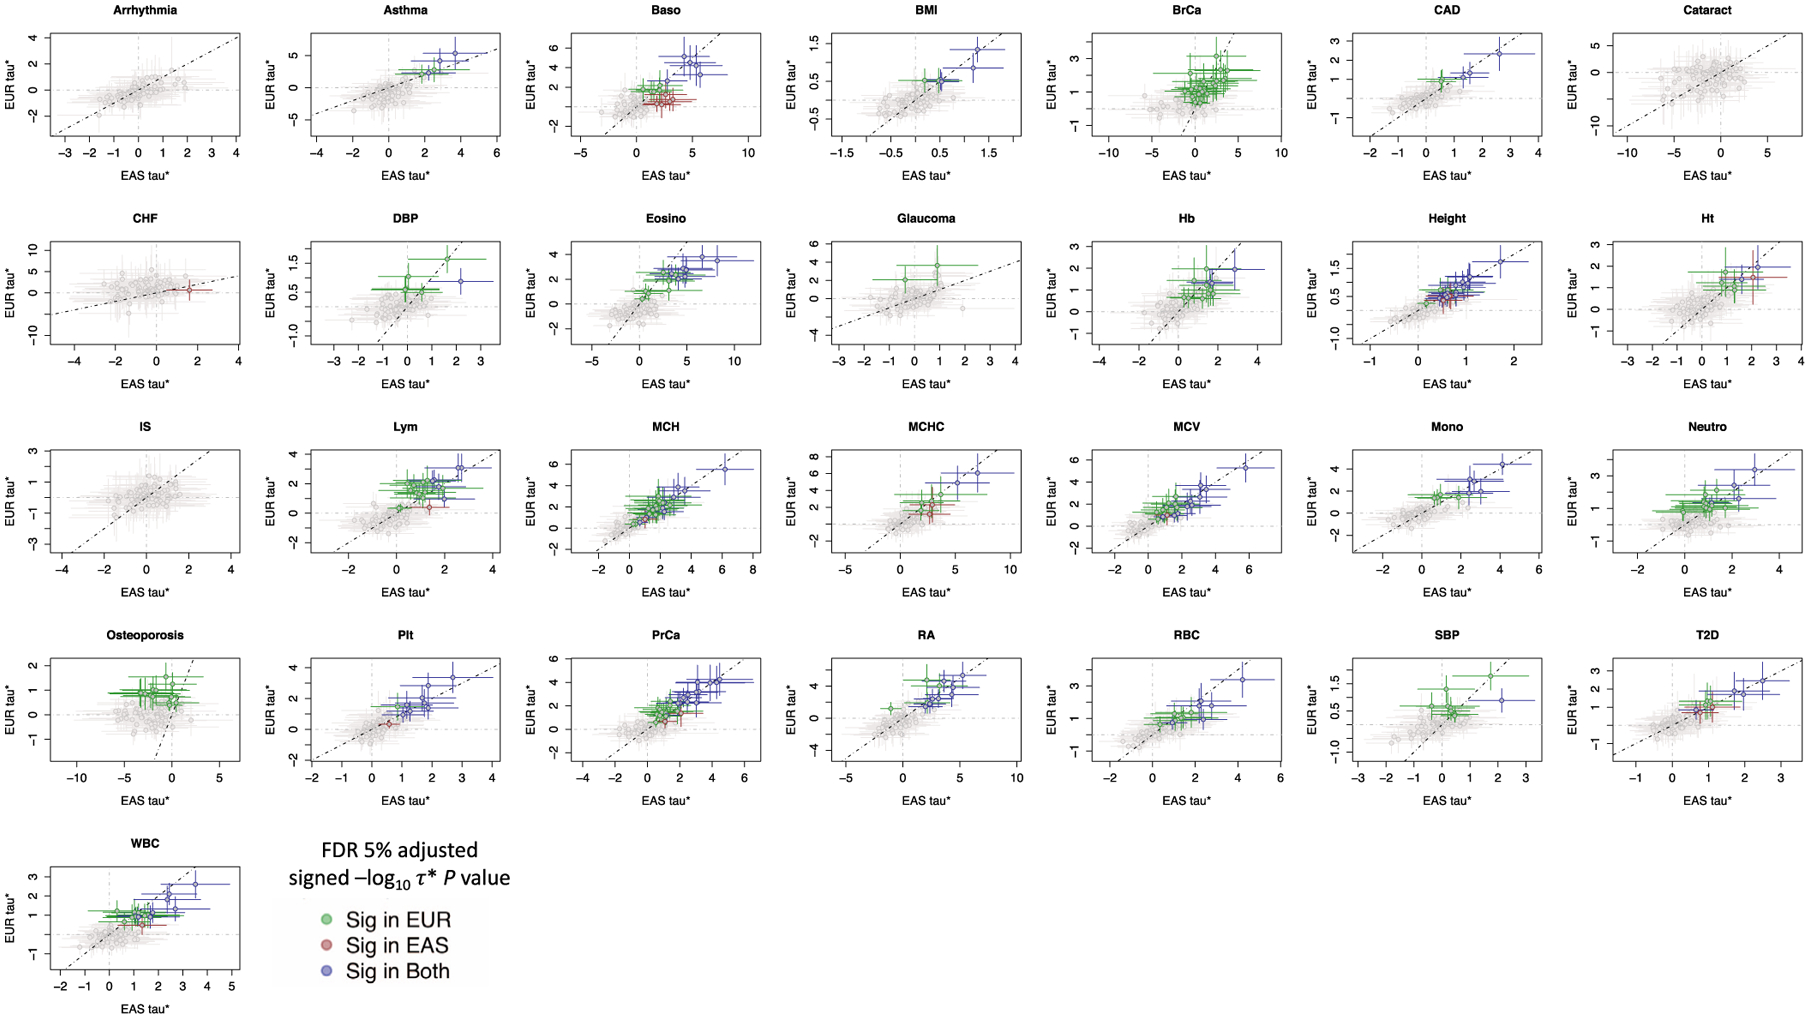
Dotted line is the identity line, y=x. τ* values with their standard errors are colored green if significantly positive in EUR and not EAS, red if significantly positive in EAS but not in EUR, green if significantly positive in both EUR and EAS, and gray if not significantly positive in either population.
Extended Data Fig. 6 |. Population concordance of heterozygosity (2pq) among variants prioritized by IMPACT compared to standard P+T.
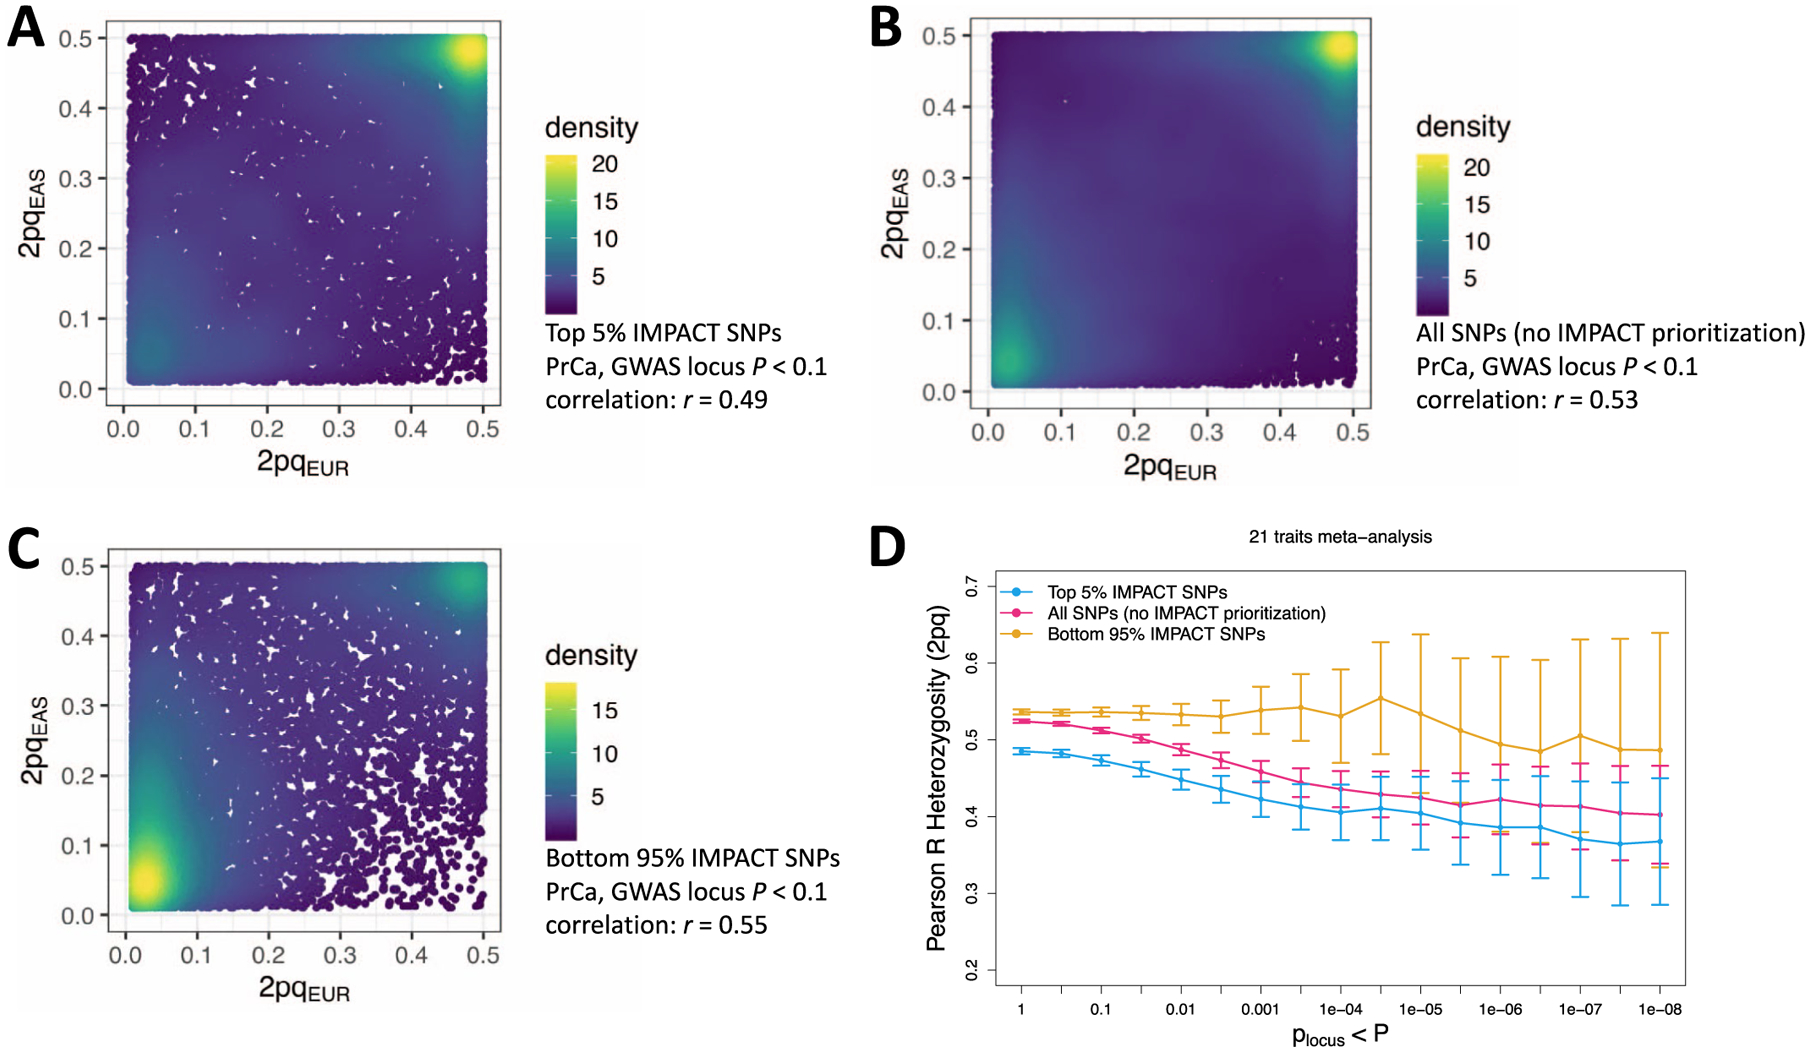
a) Heterozygosity of variants from genome-wide EUR and EAS PrCa summary statistics in the top 5% of the lead IMPACT annotation for EUR PrCa. b) Heterozygosity of variants from genome-wide EUR and EAS PrCa summary statistics using standard P+T. c) Heterozygosity of variants from genome-wide EUR and EAS PrCa summary statistics in the bottom 95% of the lead IMPACT annotation for PrCa; mutually exclusive with SNPs in A). d) Meta-analysis of heterozygosity correlations between populations across 21 traits shared between EUR and EAS cohorts over 17 GWAS P value thresholds (with reference to the EUR GWAS).
Extended Data Fig. 7 |. Population divergence, measured by Fst, among variants prioritized by IMPACT compared to standard P+T.
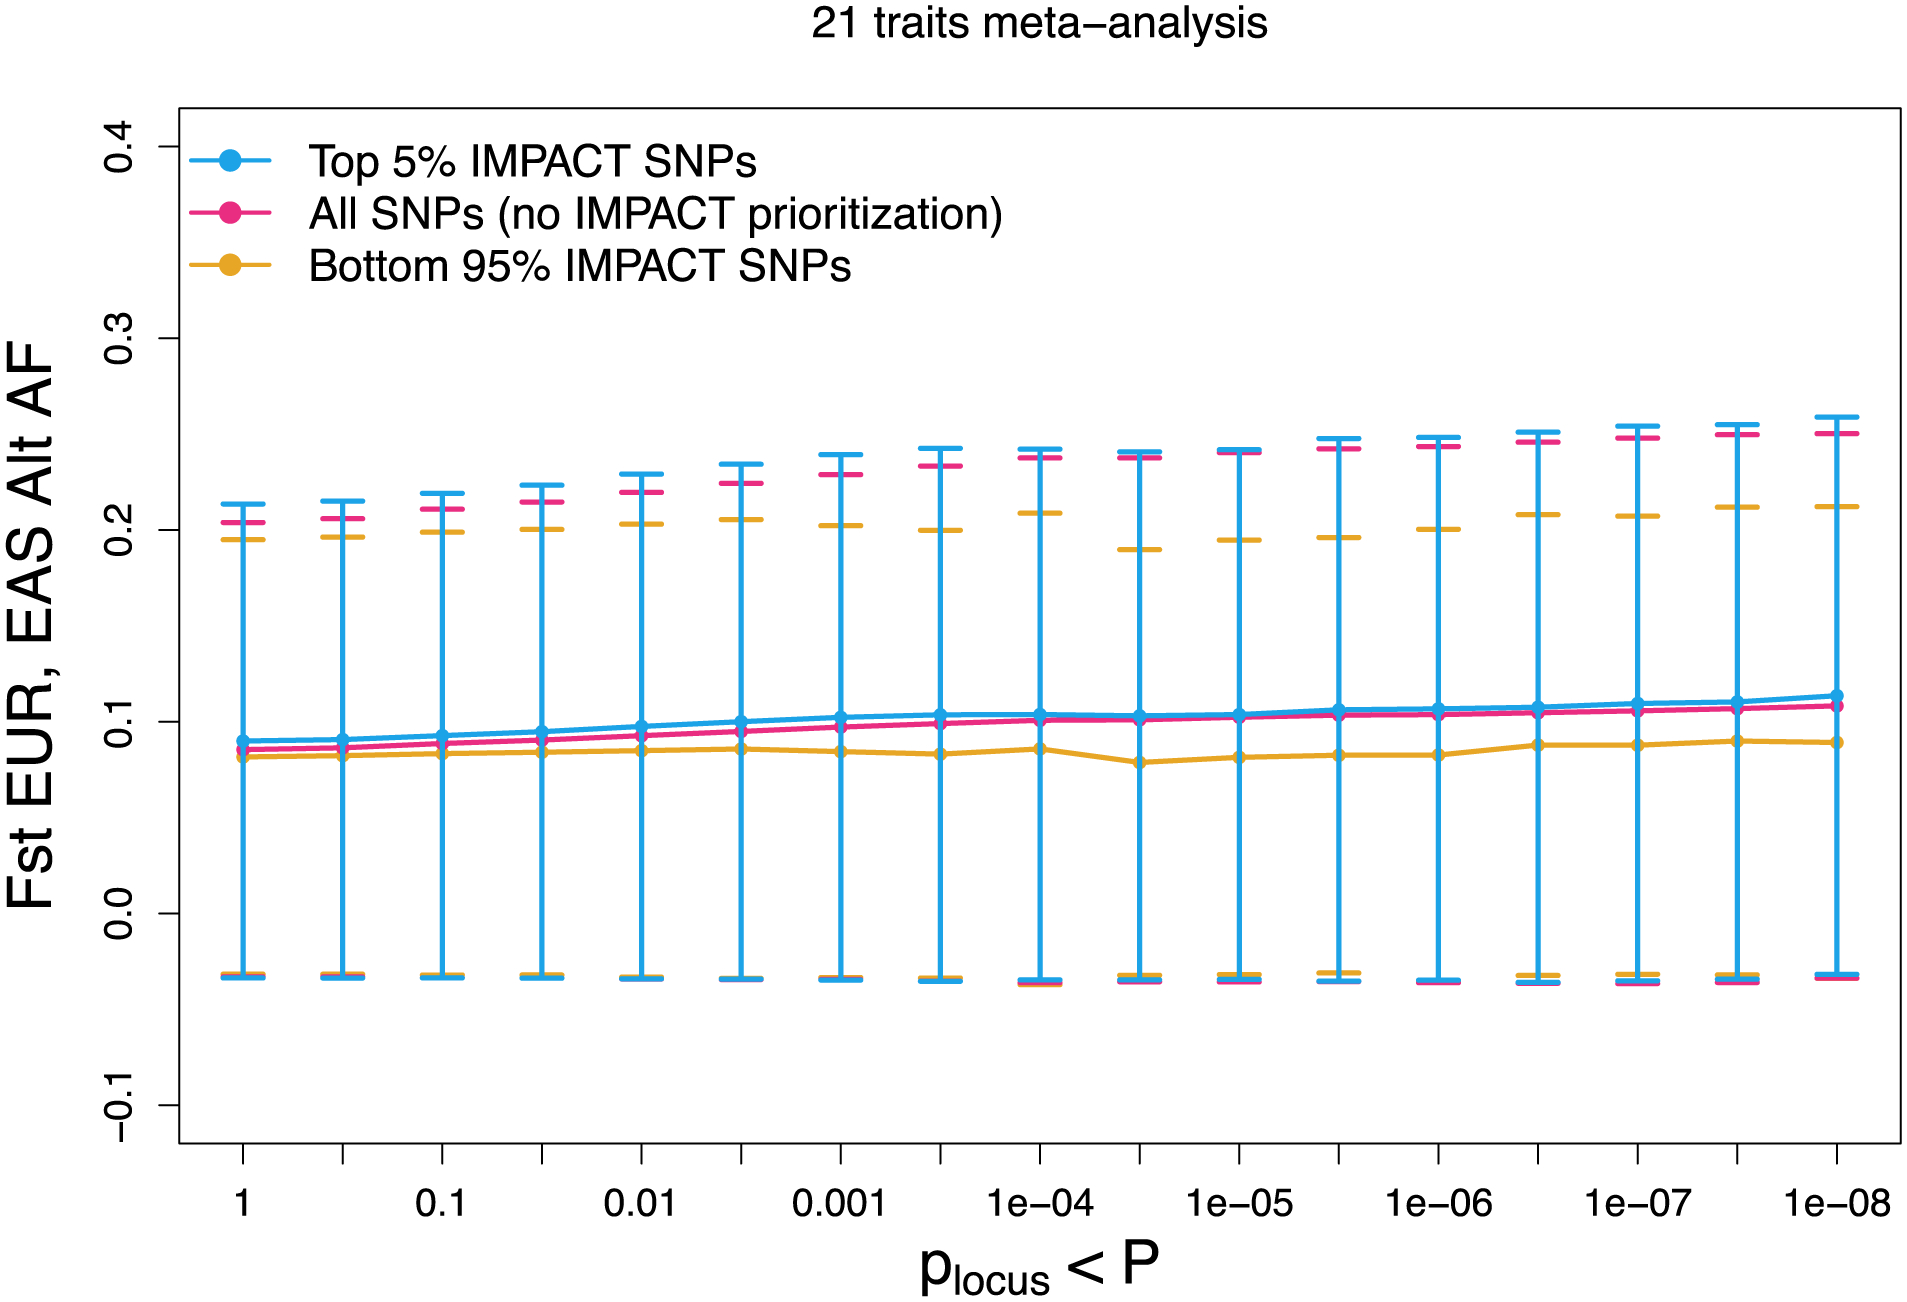
Larger values indicate a reduction in heterozygosity. Meta-analysis of Fst between EUR and EAS populations across 21 traits shared between EUR and EAS cohorts over 17 GWAS P value thresholds (with reference to the EUR GWAS).
Extended Data Fig. 8 |. EuR PRS model evaluated on EAS individuals from BBJ.
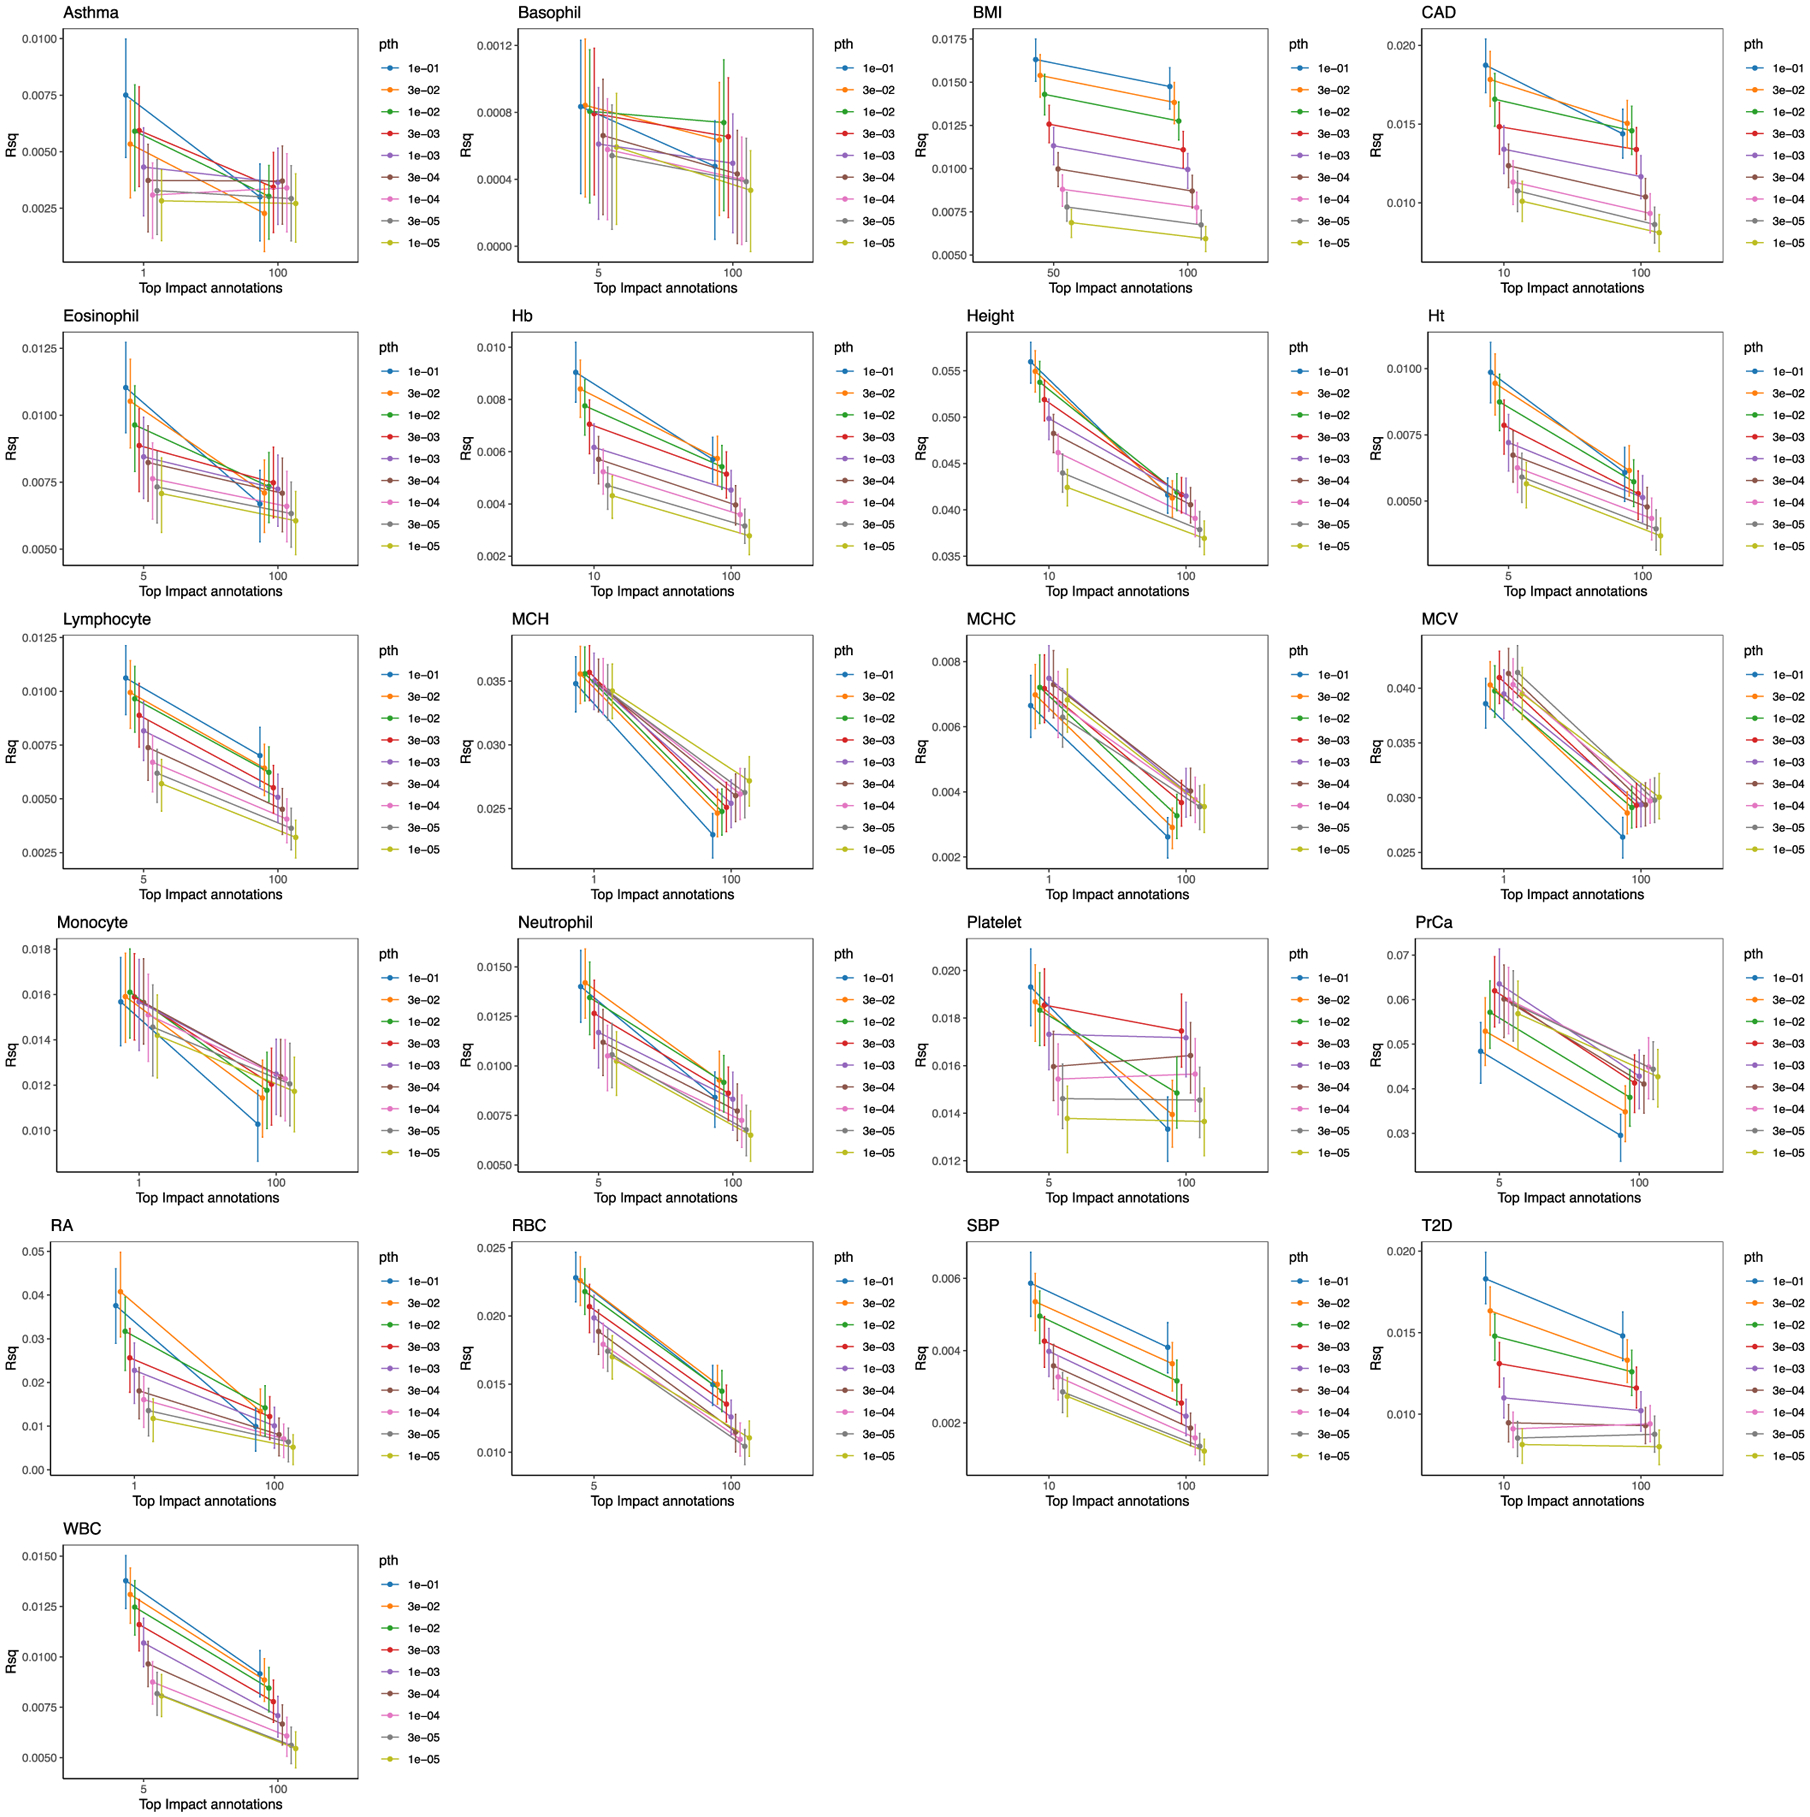
For each trait, we evaluate the predictive value of standard PRS models (top 100% of IMPACT SNPs) and functionally informed PRS models (using a subset of SNPs prioritized by IMPACT). The top 100% of SNPs according to IMPACT represents the PRS model with no functional annotation information. Intervals represent the 95% CI around the R2 estimate. For quantitative traits, R2 represents the proportion of variance captured by the linear PRS model. For case–control traits, R2 represents the liability scale R2 from the logistic regression PRS model.
Extended Data Fig. 9 |. Trans-ethnic and within-population PRS models evaluated on the same 5,000 BBJ individuals.

a) Phenotypic variance (R2) in 5,000 BBJ individuals explained by IMPACT-informed PRS-EUR (light pink) and standard PRS-EUR (light blue). b) Phenotypic variance (R2) in 5,000 BBJ individuals explained by IMPACT-informed PRS-EAS (light pink) and standard PRS-EAS (light blue). Error bars indicate 95% CI calculated via 1,000 bootstraps.
Extended Data Fig. 10 |. PRS accuracy is robust to loci of large effect.
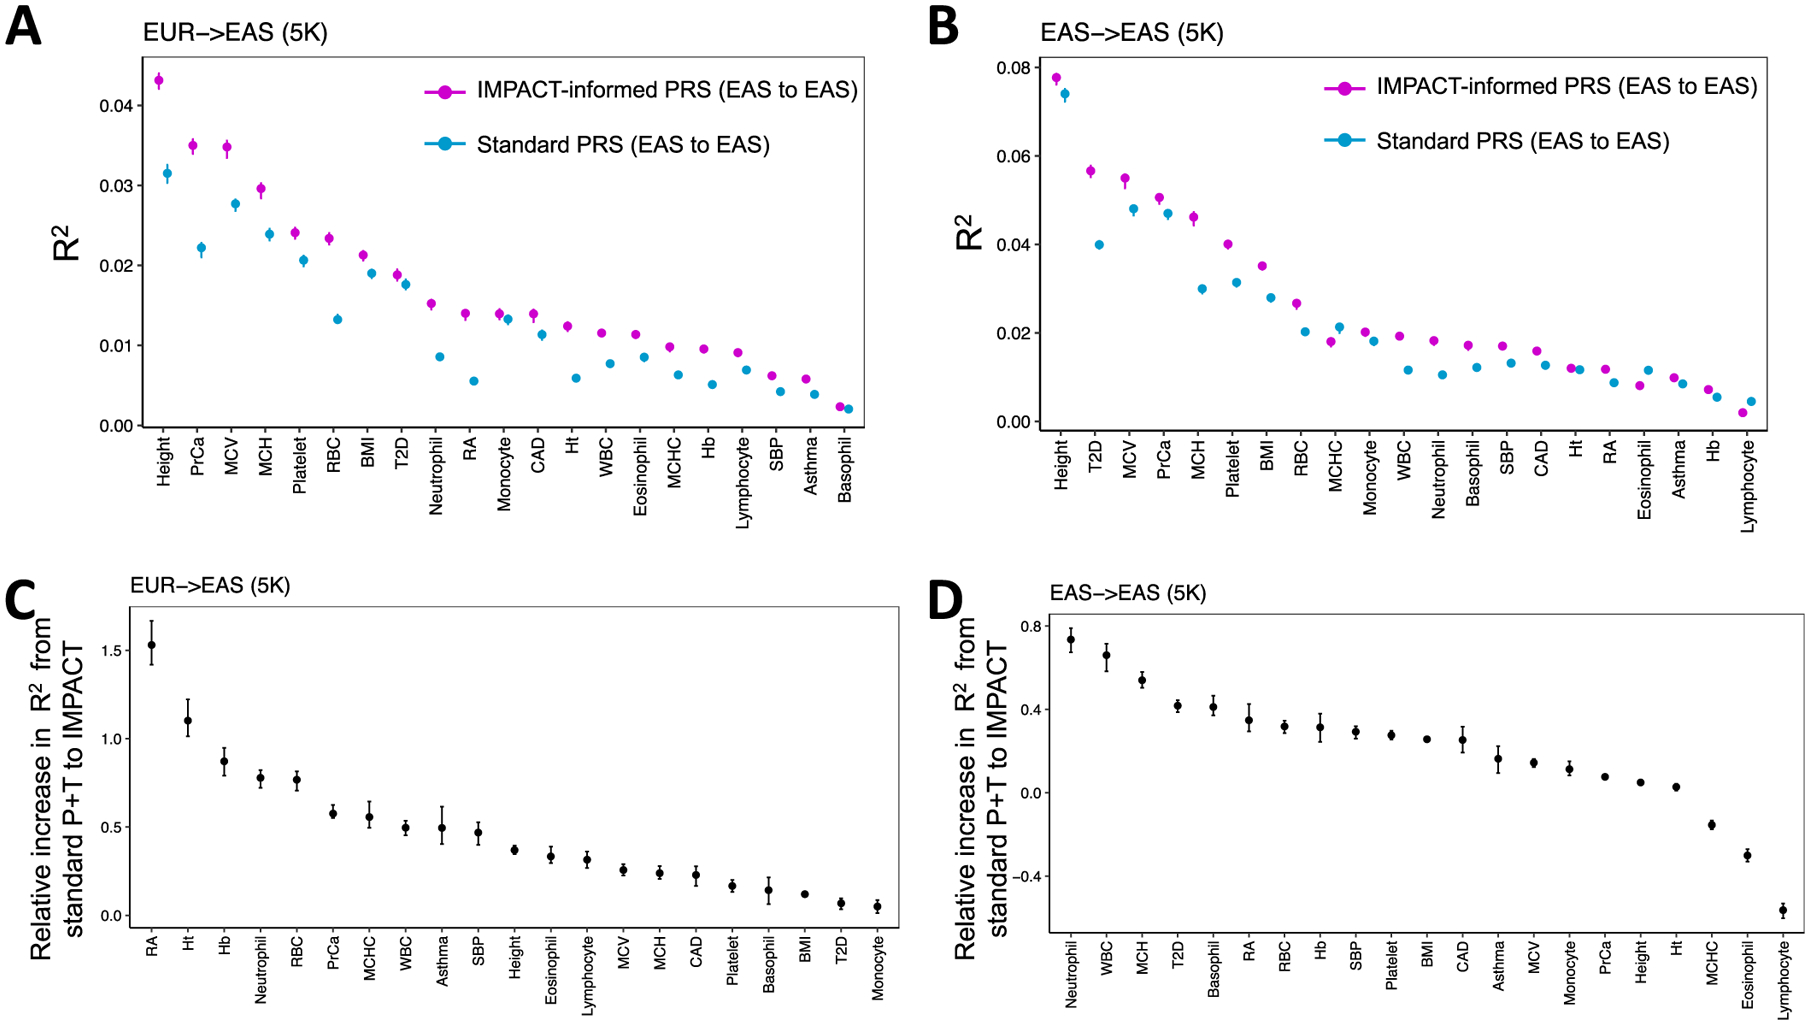
We recomputed confidence intervals around the R2 estimates (panels A and B) and around the relative improvements in R2 estimates of IMPACT PRS over standard P+T PRS (panels C and D) via block jackknife across the genome, using 200 adjacent equally-sized bins and iteratively removing variants within each bin and computing the R2. a) Trans-ethnic analysis of EUR PRS to BBJ individuals. b) Within-population analysis of EAS PRS to BBJ individuals. Error bars indicate 95% confidence interval (CI) around the R2 estimates. c) Trans-ethnic analysis of EUR PRS to BBJ individuals, relative improvement in R2 estimates defined as (IMPACT R2 - standard P+T R2)/standard P+T R2. d) Within-population analysis of EAS PRS to BBJ individuals, relative improvement in R2 estimates defined as (IMPACT R2 - standard P+T R2)/standard P+T R2.
Supplementary Material
Acknowledgements
This work is supported in part by funding from the National Institutes of Health (grant nos. NHGRI T32 HG002295, UH2AR067677, 1U01HG009088, U01 HG009379 and 1R01AR063759).
Footnotes
Competing interests
The authors declare no competing interests.
Additional information
Extended data is available for this paper at https://doi.org/10.1038/s41588-020-00740-8. Supplementary information is available for this paper at https://doi.org/10.1038/s41588-020-00740-8.
References
- 1.Sirugo G, Williams SM & Tishkoff SA The missing diversity in human genetic studies. Cell 177, 26–31 (2019). [DOI] [PMC free article] [PubMed] [Google Scholar]
- 2.Vilhjálmsson BJ et al. Modeling linkage disequilibrium increases accuracy of polygenic risk scores. Am. J. Hum. Genet 97, 576–592 (2015). [DOI] [PMC free article] [PubMed] [Google Scholar]
- 3.Finucane HK et al. Partitioning heritability by functional annotation using genome-wide association summary statistics. Nat. Genet 47, 1228–1235 (2015). [DOI] [PMC free article] [PubMed] [Google Scholar]
- 4.Bulik-Sullivan BK et al. LD Score regression distinguishes confounding from polygenicity in genome-wide association studies. Nat. Genet 47, 291–295 (2015). [DOI] [PMC free article] [PubMed] [Google Scholar]
- 5.Kichaev G & Pasaniuc, B. Leveraging functional-annotation data in trans-ethnic fine-mapping studies. Am. J. Hum. Genet 97, 260–271 (2015). [DOI] [PMC free article] [PubMed] [Google Scholar]
- 6.Martin AR et al. Clinical use of current polygenic risk scores may exacerbate health disparities. Nat. Genet 51, 584–591 (2019). [DOI] [PMC free article] [PubMed] [Google Scholar]
- 7.Lam M et al. Comparative genetic architectures of schizophrenia in East Asian and European populations. Nat. Genet 51, 1670–1678 (2019). [DOI] [PMC free article] [PubMed] [Google Scholar]
- 8.International Schizophrenia Consortium. Common polygenic variation contributes to risk of schizophrenia and bipolar disorder. Nature 460, 748–752 (2009). [DOI] [PMC free article] [PubMed] [Google Scholar]
- 9.Chatterjee N, Shi J & García-Closas M Developing and evaluating polygenic risk prediction models for stratified disease prevention. Nat. Rev. Genet 17, 392–406 (2016). [DOI] [PMC free article] [PubMed] [Google Scholar]
- 10.Stahl EA et al. Bayesian inference analyses of the polygenic architecture of rheumatoid arthritis. Nat. Genet 44, 483–489 (2012). [DOI] [PMC free article] [PubMed] [Google Scholar]
- 11.Chatterjee N et al. Projecting the performance of risk prediction based on polygenic analyses of genome-wide association studies. Nat. Genet 45, 405e1–405e3 (2013). [DOI] [PMC free article] [PubMed] [Google Scholar]
- 12.Khera AV et al. Genome-wide polygenic scores for common diseases identify individuals with risk equivalent to monogenic mutations. Nat. Genet 50, 1219–1224 (2018). [DOI] [PMC free article] [PubMed] [Google Scholar]
- 13.Schumacher FR et al. Association analyses of more than 140,000 men identify 63 new prostate cancer susceptibility loci. Nat. Genet 50, 928–936 (2018). [DOI] [PMC free article] [PubMed] [Google Scholar]
- 14.Sharp SA et al. Development and standardization of an improved type 1 diabetes genetic risk score for use in newborn screening and incident diagnosis. Diabetes Care 42, 200–207 (2019). [DOI] [PMC free article] [PubMed] [Google Scholar]
- 15.Kullo IJ et al. Incorporating a genetic risk score into coronary heart disease risk estimates: effect on low-density lipoprotein cholesterol levels (the MI-GENES Clinical Trial). Circulation 133, 1181–1188 (2016). [DOI] [PMC free article] [PubMed] [Google Scholar]
- 16.Natarajan P et al. Polygenic risk score identifies subgroup with higher burden of atherosclerosis and greater relative benefit from statin therapy in the primary prevention setting. Circulation 135, 2091–2101 (2017). [DOI] [PMC free article] [PubMed] [Google Scholar]
- 17.Márquez-Luna C, Loh P-R, South Asian type 2 Diabetes (SAT2D) Consortium, SIGMA Type 2 Diabetes Consortium & Price, A. L. Multiethnic polygenic risk scores improve risk prediction in diverse populations. Genet. Epidemiol 41, 811–823 (2017). [DOI] [PMC free article] [PubMed] [Google Scholar]
- 18.Duncan L et al. Analysis of polygenic risk score usage and performance in diverse human populations. Nat. Commun 10, 3328 (2019). [DOI] [PMC free article] [PubMed] [Google Scholar]
- 19.Curtis D Polygenic risk score for schizophrenia is more strongly associated with ancestry than with schizophrenia. Psychiatr. Genet 28, 85–89 (2018). [DOI] [PubMed] [Google Scholar]
- 20.Martin AR et al. Human demographic history impacts genetic risk prediction across diverse populations. Am. J. Hum. Genet 100, 635–649 (2017). [DOI] [PMC free article] [PubMed] [Google Scholar]
- 21.Hu Y et al. Leveraging functional annotations in genetic risk prediction for human complex diseases. PLoS Comput. Biol 13, e1005589 (2017). [DOI] [PMC free article] [PubMed] [Google Scholar]
- 22.Márquez-Luna C et al. Modeling functional enrichment improves polygenic prediction accuracy in UK Biobank and 23andMe data sets. Preprint at bioRxiv 10.1101/375337 (2018). [DOI] [PMC free article] [PubMed] [Google Scholar]
- 23.Okada Y et al. Genetics of rheumatoid arthritis contributes to biology and drug discovery. Nature 506, 376–381 (2014). [DOI] [PMC free article] [PubMed] [Google Scholar]
- 24.Kanai M et al. Genetic analysis of quantitative traits in the Japanese population links cell types to complex human diseases. Nat. Genet 50, 390–400 (2018). [DOI] [PubMed] [Google Scholar]
- 25.Yengo L et al. Meta-analysis of genome-wide association studies for height and body mass index in ~700000 individuals of European ancestry. Hum. Mol. Genet 27, 3641–3649 (2018). [DOI] [PMC free article] [PubMed] [Google Scholar]
- 26.Schaub MA, Boyle AP, Kundaje A, Batzoglou S & Snyder M Linking disease associations with regulatory information in the human genome. Genome Res. 22, 1748–1759 (2012). [DOI] [PMC free article] [PubMed] [Google Scholar]
- 27.Maurano MT et al. Systematic localization of common disease-associated variation in regulatory DNA. Science 337, 1190–1195 (2012). [DOI] [PMC free article] [PubMed] [Google Scholar]
- 28.Reshef YA et al. Detecting genome-wide directional effects of transcription factor binding on polygenic disease risk. Nat. Genet 50, 1483–1493 (2018). [DOI] [PMC free article] [PubMed] [Google Scholar]
- 29.Liu X, Li YI & Pritchard JK Trans effects on gene expression can drive omnigenic inheritance. Cell 177, 1022–1034.e6 (2019). [DOI] [PMC free article] [PubMed] [Google Scholar]
- 30.Lloyd-Jones LR et al. Improved polygenic prediction by Bayesian multiple regression on summary statistics. Nat. Commun 10, 5086 (2019). [DOI] [PMC free article] [PubMed] [Google Scholar]
- 31.Amariuta T et al. IMPACT: genomic annotation of cell-state-specific regulatory elements inferred from the epigenome of bound transcription factors. Am. J. Hum. Genet 104, 879–895 (2019). [DOI] [PMC free article] [PubMed] [Google Scholar]
- 32.Kawakami E, Nakaoka S, Ohta T & Kitano H Weighted enrichment method for prediction of transcription regulators from transcriptome and global chromatin immunoprecipitation data. Nucleic Acids Res. 44, 5010–5021 (2016). [DOI] [PMC free article] [PubMed] [Google Scholar]
- 33.ENCODE Project Consortium. An integrated encyclopedia of DNA elements in the human genome. Nature 489, 57–74 (2012). [DOI] [PMC free article] [PubMed] [Google Scholar]
- 34.Roadmap EpigenomicsConsortium. Integrative analysis of 111 reference human epigenomes. Nature 518, 317–330 (2015). [DOI] [PMC free article] [PubMed] [Google Scholar]
- 35.Gazal S et al. Linkage disequilibrium-dependent architecture of human complex traits shows action of negative selection. Nat. Genet 49, 1421–1427 (2017). [DOI] [PMC free article] [PubMed] [Google Scholar]
- 36.Buniello A et al. The NHGRI-EBI GWAS Catalog of published genome-wide association studies, targeted arrays and summary statistics 2019. Nucleic Acids Res. 47, D1005–D1012 (2019). [DOI] [PMC free article] [PubMed] [Google Scholar]
- 37.Akiyama M et al. Characterizing rare and low-frequency height-associated variants in the Japanese population. Nat. Commun 10, 4393 (2019). [DOI] [PMC free article] [PubMed] [Google Scholar]
- 38.Akiyama M et al. Genome-wide association study identifies 112 new loci for body mass index in the Japanese population. Nat. Genet 49, 1458–1467 (2017). [DOI] [PubMed] [Google Scholar]
- 39.Ishigaki K et al. Large-scale genome-wide association study in a Japanese population identifies novel susceptibility loci across different diseases. Nat. Genet 52, 669–679 (2020). [DOI] [PMC free article] [PubMed] [Google Scholar]
- 40.Peterson RE et al. Genome-wide association studies in ancestrally diverse populations: opportunities, methods, pitfalls, and recommendations. Cell 179, 589–603 (2019). [DOI] [PMC free article] [PubMed] [Google Scholar]
- 41.Gurdasani D, Barroso I, Zeggini E & Sandhu MS Genomics of disease risk in globally diverse populations. Nat. Rev. Genet 20, 520–535 (2019). [DOI] [PubMed] [Google Scholar]
- 42.Drake LY et al. B cells play key roles in th2-type airway immune responses in mice exposed to natural airborne allergens. PLoS One 10, e0121660 (2015). [DOI] [PMC free article] [PubMed] [Google Scholar]
- 43.Amariuta T, Luo Y, Knevel R, Okada Y & Raychaudhuri S Advances in genetics toward identifying pathogenic cell states of rheumatoid arthritis. Immunol. Rev 294, 188–204 (2019). [DOI] [PMC free article] [PubMed] [Google Scholar]
- 44.Buttari B, Profumo E & Rigano R Crosstalk between red blood cells and the immune system and its impact on atherosclerosis. Biomed. Res. Int 2015, 616834 (2015). [DOI] [PMC free article] [PubMed] [Google Scholar]
- 45.Anderson HL, Brodsky IE & Mangalmurti NS The evolving erythrocyte: red blood cells as modulators of innate immunity. J. Immunol 201, 1343–1351 (2018). [DOI] [PMC free article] [PubMed] [Google Scholar]
- 46.Lui JC & Baron J Mechanisms limiting body growth in mammals. Endocr. Rev 32, 422–440 (2011). [DOI] [PMC free article] [PubMed] [Google Scholar]
- 47.Maier AB, van Heemst D & Westendorp RGJ Relation between body height and replicative capacity of human fibroblasts in nonagenarians. J. Gerontol. A Biol. Sci. Med. Sci 63, 43–45 (2008). [DOI] [PubMed] [Google Scholar]
- 48.Murphy RA et al. Adipose tissue, muscle, and function: potential mediators of associations between body weight and mortality in older adults with type 2 diabetes. Diabetes Care 37, 3213–3219 (2014). [DOI] [PMC free article] [PubMed] [Google Scholar]
- 49.Heymsfield SB, Gallagher D, Mayer L, Beetsch J & Pietrobelli A Scaling of human body composition to stature: new insights into body mass index. Am. J. Clin. Nutr 86, 82–91 (2007). [DOI] [PMC free article] [PubMed] [Google Scholar]
- 50.Kichaev G et al. Leveraging polygenic functional enrichment to improve GWAS power. Am. J. Hum. Genet 104, 65–75 (2019). [DOI] [PMC free article] [PubMed] [Google Scholar]
- 51.Gusev A et al. Atlas of prostate cancer heritability in European and African-American men pinpoints tissue-specific regulation. Nat. Commun 7, 10979 (2016). [DOI] [PMC free article] [PubMed] [Google Scholar]
- 52.Finucane HK et al. Heritability enrichment of specifically expressed genes identifies disease-relevant tissues and cell types. Nat. Genet 50, 621–629 (2018). [DOI] [PMC free article] [PubMed] [Google Scholar]
- 53.Gibbs RA et al. A global reference for human genetic variation. Nature 526, 68–74 (2015). [DOI] [PMC free article] [PubMed] [Google Scholar]
- 54.Zhou J & Troyanskaya OG Predicting effects of noncoding variants with deep learning-based sequence model. Nat. Methods 12, 931–934 (2015). [DOI] [PMC free article] [PubMed] [Google Scholar]
- 55.Chen KM, Cofer EM, Zhou J & Troyanskaya OG Selene: a PyTorch-based deep learning library for sequence data. Nat. Methods 16, 315–318 (2019). [DOI] [PMC free article] [PubMed] [Google Scholar]
- 56.Kelley DR et al. Sequential regulatory activity prediction across chromosomes with convolutional neural networks. Genome Res. 28, 739–750 (2018). [DOI] [PMC free article] [PubMed] [Google Scholar]
- 57.Dey KK et al. Evaluating the informativeness of deep learning annotations for human complex diseases. Nat. Commun 11, 4703 (2020). [DOI] [PMC free article] [PubMed] [Google Scholar]
- 58.Nagai A et al. Overview of the BioBank Japan Project: study design and profile. J. Epidemiol 27, S2–S8 (2017). [DOI] [PMC free article] [PubMed] [Google Scholar]
- 59.Hirata M et al. Cross-sectional analysis of BioBank Japan clinical data: a large cohort of 200,000 patients with 47 common diseases. J. Epidemiol 27, S9–S21 (2017). [DOI] [PMC free article] [PubMed] [Google Scholar]
- 60.Heinz S et al. Simple combinations of lineage-determining transcription factors prime cis-regulatory elements required for macrophage and B cell identities. Mol. Cell 38, 576–589 (2010). [DOI] [PMC free article] [PubMed] [Google Scholar]
- 61.Yang J et al. Common SNPs explain a large proportion of the heritability for human height. Nat. Genet 42, 565–569 (2010). [DOI] [PMC free article] [PubMed] [Google Scholar]
- 62.Yang J, Zeng J, Goddard ME, Wray NR & Visscher PM Concepts, estimation and interpretation of SNP-based heritability. Nat. Genet 49, 1304–1310 (2017). [DOI] [PubMed] [Google Scholar]
- 63.Purcell S et al. PLINK: a tool set for whole-genome association and population-based linkage analyses. Am. J. Hum. Genet 81, 559–575 (2007). [DOI] [PMC free article] [PubMed] [Google Scholar]
- 64.Lee SH, Goddard ME, Wray NR & Visscher PM A better coefficient of determination for genetic profile analysis. Genet. Epidemiol 36, 214–224 (2012). [DOI] [PubMed] [Google Scholar]
Associated Data
This section collects any data citations, data availability statements, or supplementary materials included in this article.
Supplementary Materials
Data Availability Statement
Data are available at: IMPACT Github repository: https://github.com/immunogenomics/IMPACT; IMPACT 707 annotations: https://github.com/immunogenomics/IMPACT/tree/master/IMPACT707. Data were obtained from the following resources: HOMER: http://homer.ucsd.edu/homer/motif/; S-LDSC: https://github.com/bulik/ldsc; 1000 Genomes: http://www.internationalgenome.org/; cell-type-specifically expressed gene set annotations and LD scores: https://data.broadinstitute.org/alkesgroup/LDSCORE/LDSC_SEG_ldscores/; cell-type-specific histone modification ChIP–seq datasets: https://data.broadinstitute.org/alkesgroup/LDSCORE/; Plink: https://www.cog-genomics.org/plink2; Riken website: http://jenger.riken.jp/en/; Price Lab GWAS summary statistics: https://data.broadinstitute.org/alkesgroup/sumstats_formatted/; Neale Lab GWAS summary statistics: http://www.nealelab.is/uk-biobank; GWAS catalog: https://www.ebi.ac.uk/gwas/; Deep Learning: https://data.broadinstitute.org/alkesgroup/LDSCORE/DeepLearning/.


