Abstract
We describe frequency-domain measurements of the anisotropy decay of 1,6-diphenylhexatriene resulting from one- and two-photon excitation. For two-photon excitation, the phase shifts (Δ) between the horizontally and vertically polarized components of the decay exceed the absolute maximum of 30° possible for one-photon excitation, and values of Δ as large as 37° were observed for 1,6-diphenylhexatriene in triacetin. These results are explained by the increased orientation of the photoselected population for two- as compared to one-photon excitation.
1. Introduction
Time-resolved measurements of fluorescence anisotropy decays are widely used to characterize the dynamics and hydrodynamics of fluorophores and biological macromolecules [1,2]. In recent years frequency-domain instrumentation has become available [3–5] and been used to recover complex anisotropy decays of anisotropically rotating fluorophores [6–8], of tryptophan residues in proteins [9,10] and of probes in lipid bilayers [11,12]. To date, essentially all anisotropy decays have been observed following single-photon excitation.
In the present report we describe the increase in orientation of the photoselected population, and hence of the fundamental anisotropy r0, which results from two-photon excitation. Upon excitation with linearly polarized light, the photoselected population is oriented along the electric vector due to the cos2θ dependence of absorption, where θ is the angle between the electric vector of the incident light and the transition dipole of the fluorophore. Such an increase in r0 is experimentally useful because it is known that the resolution of anisotropy decays is increased for higher values of r0 [13]. We examined 1,6-diphenylhexatriene (DPH) in the viscous solvent triacetin at various temperatures. While the rotational motions of DPH are surely anisotropic, rotation about the long axis does not displace the absorption and emission dipoles which are oriented along the long axis of the molecule. Consequently, DPH behaves as an isotropic rotator as observed by its fluorescence anisotropy.
The possibility of two-photon excitation led us to predict anomalous differential polarized phase angles (Δ). The theory of differential polarized phase fluorometry has been elegantly described by Weber [14,15]. The values of Δ are known to depend on r0, the rotational rate (R), the fluorescence decay time (τ) and on the circular modulation frequency (ω). Mantulin and Weber [16] showed that single correlation time anisotropy decays (i.e. symmetric rotators) resulted in the largest differential phase angles between the polarized components of the emission. Asymmetric rotations and/or multi-exponential anisotropy decays result in smaller differential phase shifts. Based on Weber’s theory we calculated that the maximum phase shift between the polarized components of the emission is 30°, and that this value is a consequence of the maximum anisotropy of 0.4 for single-photon excitation of a fluorophore with co-linear absorption and emission dipoles. To avoid confusion we note that our prediction of 30° is a value independent of τ, R, or ω, and this value occurs for high values of the product ωτ. In contrast, Weber’s value of tan Δmax refers to the value expected for specific values of ω and τ, assuming all values of R are sampled, usually by variation of temperature. We predicted that two-photon excitation could yield r0 values as high as 4/7=0.57, which in turn can result in Δ values as large as 41.8°. The measurements of differential phase angles resulting from two-photon excitation of DPH confirmed the prediction of anomalous phase angles with observed values being as large as 37°.
2. Theory
2.1. Anisotropy values for one- and two-photon excitation
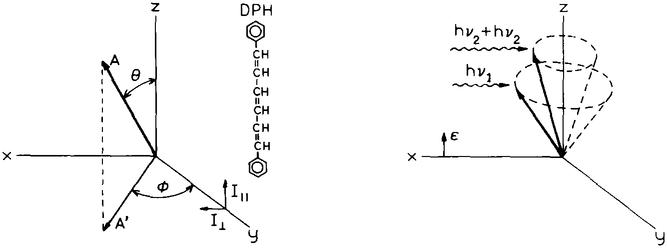
In order to calculate the anisotropy expected for one- and two-photon excitation consider a single fluorophore with its emitting dipole oriented at an angle θ from the z axis and an angle ϕ from the γ axis (scheme 1). According to the formalism used by Weber [17], the intensity along each polarization axis is proportional to the square of the projection of the dipole onto the observation axis. Hence
| (1) |
| (2) |
where I0 is a constant proportional to the total intensity of the emission. Because of symmetry about the z axis we can eliminate the dependence of ϕ by integration over ϕ, yielding
| (3) |
| (4) |
The observed value of I∥ and I⊥ is given by the average found in the sample
| (5) |
| (6) |
where f(θ) dθ is the probability that a fluorophore is oriented between θ and θ + dθ. For randomly oriented fluorophores excited by vertically polarized light in the single-photon regime this probability is given by
| (7) |
where the cos2θ term is due to photoselection of the excited state population according to the dipole projection along the z axis and the term sin θ dθ accounts for the relative number of molecules from a random distribution with an angle θ from the z axis between θ and θ + dθ.
Scheme 1.
Left: Emission dipole in our coordinate system. Right: Schematic for one- and two-photon photoselection. The excitation light is polarized along the z axis.
Recalling that sin2θ = 1 − cos2θ, a calculation of is adequate to compute the anisotropy
| (8) |
The anisotropy is defined by
| (9) |
hence,
| (10) |
In this derivation we have assumed that the absorption and emission dipoles are co-linear. If they are displaced by an angle β, then the fundamental anisotropy is decreased by an additional factor
| (11) |
Hence one sees that the single-photon maximum anisotropy value of 0.4 is a consequence of the cos2θ dependence of photoselection by single-photon absorbance.
It seems reasonable to suggest that two-photon excitation depends on cos4θ, to account for the two-photon fluorophore photoselection event. Hence, the probability distribution of fluorophores excited by two photons is given by
| (12) |
The value of the detected anisotropy is still obtained from which describes the projection of the emission dipoles along the ∥ and ⊥ axes. Hence,
| (13) |
Consequently, a higher value of r0 can be obtained from two-photon excitation, and this value is given by
| (14) |
as is illustrated intuitively in scheme 1.
2.2. Maximum observable differential polarized phase angles for one- and two-photon excitation
Assume that the sample is excited with linearly polarized light (scheme 1), and that this light is intensity modulated at a frequency ω. The phase shift (Δ) between the vertically and horizontally polarized components of the emission is given by [14]
| (15) |
The maximum phase shift for any given values of r0, ω and τ, independent of R, is given by [14, 18]
| (16) |
where m0 = (1 + 2r0) (1 − r0). Examination of the theoretical curves for various values of ωτ [14] suggest that a finite limiting value of Δ will be observed for ωτ≫ 1. The high frequency limit of eq. (16) is easily obtained by calculating
| (17) |
| (18) |
In this expression the subscript 0 refers to a limiting value, analogous to the definition of r0, and the superscript 1 or 2 refers to single-photon or two-photon excitation, respectively.
For single-photon excitation and co-linear absorption and emission dipoles, r0 = 0.4 and the maximal value of Δ is . For two-photon excitation r0 can be as high as 0.57, resulting in a maximal value of . Additional values are listed in table 1 for β values of 45, 54.7 and 90°. Observation of Δ values larger than 30° or less than −19.5° can be regarded as a unique consequence of two-photon excitation.
Table 1.
Maximum differential polarized phase angles of an isotropic rotator and one- or two-photon excitation
| r0 | β (deg)a) | Δ0 (deg)b) |
|---|---|---|
| one-photon excitation | ||
| 0.4 | 0 | 30 |
| 0.1 | 45 | 8.21 |
| 0.0 | 54.74 | 0 |
| −0.2 | 90 | −19.5 |
| two-photon excitation | ||
| 0.57 | 0 | 41.8 |
| 0.143 | 45 | 11.54 |
| 0.0 | 54.74 | 0 |
| −0.286 | 90 | −30 |
Angle between the absorption and emission transition moments.
Phase shift in degrees between the horizontally and vertically polarized components of the emission, according to eq. (18).
In addition to Δ, the anisotropy decay can also be characterized by measurement of the modulated anisotropy
| (19) |
where Λ is the ratio of the modulated and polarized components of the emission (Λ=m∥/m⊥). At low modulation frequencies rω approaches the steady state anisotropy, and at high modulation frequencies rω approaches r0, irrespective of whether the excitation regime is one- or two-photon. Hence, one can expect maximum values of rω of 0.4 and 0.54 for one-and two-photon excitation, respectively.
3. Experimental methods
Frequency-domain intensities and anisotropy decays were obtained on the 10 GHz instrument described previously [4,5]. Single-photon excitation was accomplished using the frequency-doubled output of a cavity-dumped pyridine 1 dye laser at 358 nm. Two-photon excitation used the fundamental output of 716 nm, which was focused in the sample using a 5 cm focal length lens. Identical single-photon results were obtained with or without the lens. For both one- and two-photon excitation the pulse width was about 5 ps at a repetition rate of 3.795 MHz, and the emission was isolated with a Corning 4–96 filter. Signal from the solvent alone was less than 0.2% for both one- and two-photon excitation.
The frequency-domain data were analyzed as described previously for the intensity [19] and anisotropy decays [20,21] using the method of nonlinear least-squares.
4. Results
We recognized that observations of Δ values in excess of 30° would require, in addition to two-photon excitation, an isotropic rotator, a high value of r0, a rotational rate yielding the maximum differential phase angle for a given lifetime, and measurements at high frequencies to maximize the value of ωτ. Hence we selected DPH for its high limiting anisotropy of 0.39 [12,18], and the solvent triacetin (glycerol triacetate) for its aprotic character and high temperature-dependent viscosity.
Because of the limited spectral data on two-photon fluorescence, it is important to confirm that the observed signal is in fact due to DPH. The emission spectra of DPH from one- and two-photon excitation were essentially identical (not shown), as were the single exponential intensity decay times (table 2). Additionally, the emission intensity was proportional to the square of the excitation power at 716 nm, and linearly proportional to the excitation power at 358 nm, as expected for two- and one-photon excitation, respectively (not shown).
Table 2.
Anisotropy decay parameters of DPH in triacetin
| T(°C) | One-photon excitation | Two-photon excitation | ||||||
|---|---|---|---|---|---|---|---|---|
| τ (ns)a) | r0 | τc (ns)a) | τ (ns) | r0 | τc (ns) | |||
| 10 | 8.04 | 0.375 (0.002)b) | 3.88 (0.04) | 0.61 | 8.29 | 0.521 (0.002) | 3.90 (0.03) | 0.82 |
| 20 | 7.92 | 0.373 (0.002) | 1.98 (0.03) | 1.82 | 7.99 | 0.519 (0.002) | 1.89 (0.02) | 0.78 |
| 30 | 7.54 | 0.364 (0.009) | 1.09 (0.02) | 0.79 | 7.60 | 0.522 (0.002) | 1.07 (0.02) | 0.55 |
| 40 | 7.27 | 0.371 (0.004) | 0.67 (0.01) | 0.33 | 7.21 | 0.528 (0.004) | 0.61 (0.01) | 0.80 |
τ is the fluorescence decay time, and τc is the rotational correlation time.
Asymptotic standard errors obtained from least-squares analysis [19–21]. The values were calculated using the uncertainties in Δ and Λ observed from the actual data. The experimental uncertainty in Δ varied from 0.1° at low frequencies to 1.5° at high frequencies, and the experimental uncertainty in Λ varied from 0.003 at low frequencies to 0.015 at higher frequencies.
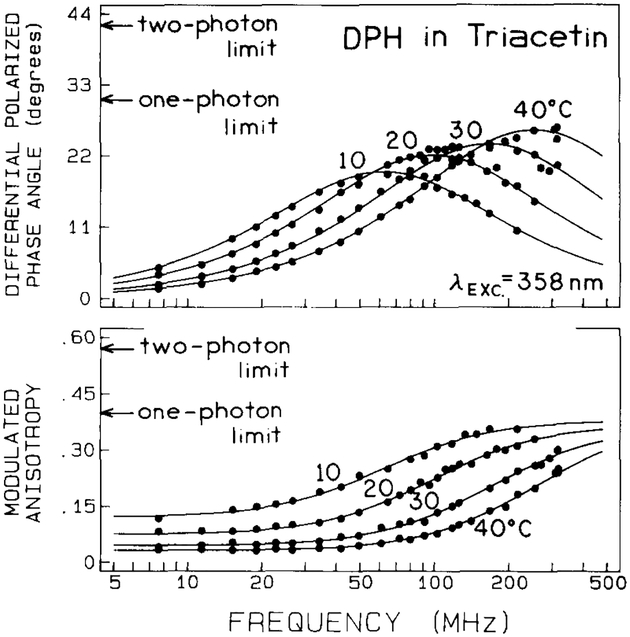
The frequency-domain anisotropy data for one-photon excitation of DPH are shown in fig. 1. As the temperature is increased from 10 to 40°C the maximum differential phase angles increase, resulting in a maximum value of 28° at 40°C and 300 MHz. We do not know if a higher value of Δ would be observed at higher temperatures. The present measurements were limited to 300 MHz because of the low modulation of the emission (0.07) resulting from the 7.27 ns decay times of DPH, and higher temperatures will shift the frequency of the tan Δmax above 300 MHz.
Fig. 1.
Frequency-domain fluorescence anisotropy data obtained with one-photon excitation (λexc = 358 nm) for DPH in triacetin at various temperatures. The absolute limits of differential phases are 30° for one-photon (●) and 41.8° for two-photon (○) excitation. The absolute limits of modulated anisotropies are 2/5 for one-photon and 4/7 for two-photon excitation.
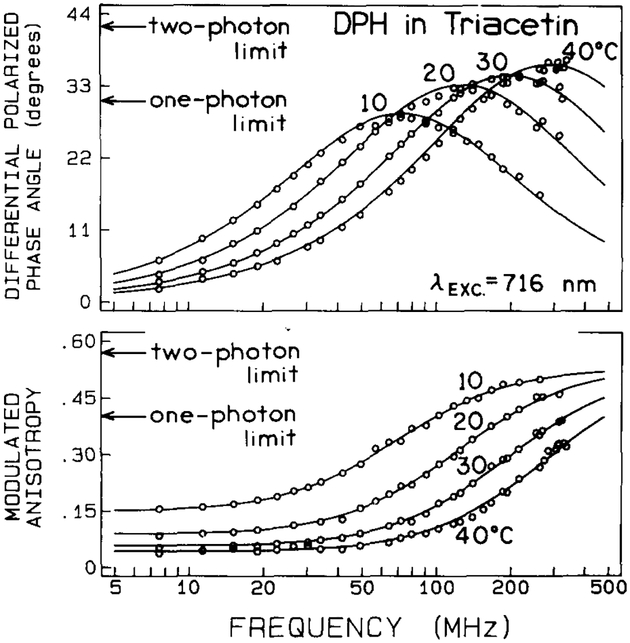
The anisotropy data resulting from 716 nm two-photon excitation are shown in fig. 2. These results clearly demonstrate Δ values well in excess of 30°, with a maximum observed value of about 37°. Additionally, the modulated anisotropies exceed the single-photon limit of 0.4. Such data must have their origin in two-photon excitation, and confirm our prediction that two-photon excitation should result in a more strongly oriented photoselected population, or equivalently, values of r0 in excess of 0.4.
Fig. 2.
Frequency-domain fluorescence anisotropy data obtained with two-photon excitation (λexc = 716 nm) for DPH in triacetin at various temperatures.
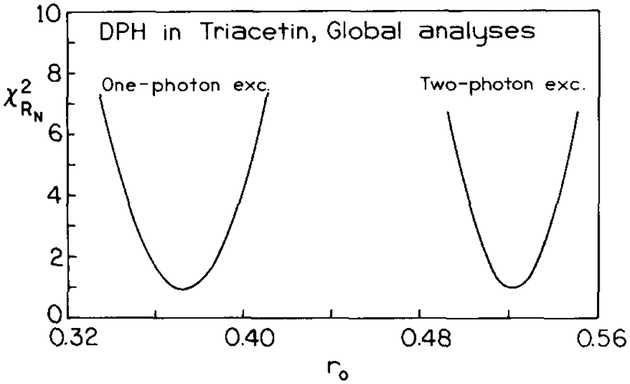
The elevated values of r0 are also evident from least-squares analysis of the frequency-domain anisotropy data (table 2). The average values of r0 recovered from the frequency-domain anisotropy data were 0.373 and 0.523 for one- and two-photon excitation, respectively. To determine the ranges of r0 values consistent with the data, we examined the surface for r0 (fig. 3). These surfaces are the result of a global analysis of the one- or two-photon data for all temperatures. The fundamental anisotropy (r0) was a global parameter, and the correlation times were non-global, i.e. different for each temperature. These surfaces demonstrate that the r0 value for two-photon excitation is clearly in excess of 0.4, and is near 0.52.
Fig. 3.
surfaces for r0 from simultaneous analyses (four temperatures, r0 global) of DPH in triacetin using one- or two-photon excitation.
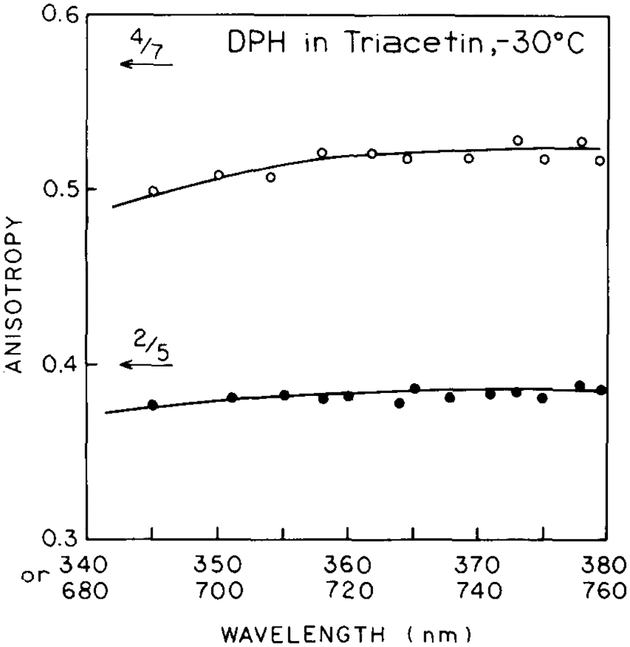
Finally, we examined the steady state anisotropy of DPH at −30°C (fig. 4), where significant rotational diffusion does not occur during the excited state lifetime. The value of r0 is only weakly dependent on excitation wavelength and this dependence is similar for one- and two-photon excitation. The r0 values for 716/355 nm excitation are in excellent agreement with the values recovered from the frequency-domain data for two- and one-photon excitation.
Fig. 4.
Steady-state anisotropies of DPH in triacetin at −30°C measured with one- or two-photon excitation.
5. Discussion
What are the advantages of two-photon fluorescence in chemical physics and biophysical chemistry? Obvious advantages are the opportunity to excite fluorescence in media which are optically dense at the single-photon wavelength [22] and the possibility of decreased background and/or photodamage for longer wavelengths [23]. In studies of macromolecular dynamics of anisotropic decays are generally complex. The higher values of r0 for two-photon excitation should be advantageous in the resolution of multi- or non-exponential anisotropy decays.
We note that the anisotropy need not increase for two-photon excitation. In molecules like indole and tryptophan, the absorption is due to two states (1La and 1Lb) at all wavelengths below 295 nm [24,25]. It is also known that the two-photon cross sections are variable for different chromophores [26]. Hence, it is easily possible that different fractions of the total absorbance at a given wavelength could be due to each state for one- and two-photon excitation. Stated alternatively, different apparent values of the angle between the absorption and emission oscillators (β) may be observed for one- and two-photon excitation. Therefore, two-photon excitation may result in superior and/or different photoselection between overlapping states. At this time, the experimental opportunities from the application of two-photon excitation to time-resolved fluorescence spectroscopy are not completely known.
Acknowledgement
The authors acknowledge support from the National Science Foundation (DIR-8710401 and DMB-8804921, Center for Fluorescence Spectroscopy and Institutional grants), the National Institutes of Health (RR-04800) and the Medical Biotechnology Center and Graduate School at the University of Maryland. ED was on sabbatical leave from the Royal Veterinary and Agricultural University, Copenhagen and also a recipient of a NATO Science Fellowship.
Footnotes
Dedicated to Professor Gregorio Weber on the occasion of his 75th birthday.
References
- [1].Jameson DM and Reinhart GD, eds., Fluorescent biomolecules (Plenum Press, New York, 1989). [Google Scholar]
- [2].Lakowicz JR, ed., Time-resolved laser spectroscopy in biochemistry, SPIE Proc. 909 (1988); 1204 (1990). [Google Scholar]
- [3].Gratton E and Limkemann M, Biophys. J 44 (1983) 315. [DOI] [PMC free article] [PubMed] [Google Scholar]
- [4].Lakowicz JR, Laczko G and Gryczynski I, Rev. Sci. Instr 57 (1986) 2499. [Google Scholar]
- [5].Laczko G, Gryczynski I, Gryczynski Z, Wiczk W, Malak H and Lakowicz JR, Rev. Sci. Instr 61 (1990) 2331. [Google Scholar]
- [6].Gryczynski I, Cherek H and Laczko G and Lakowicz JR, Chem. Phys. Letters 135 (1987) 193. [Google Scholar]
- [7].Gryczynski I, Cherek H and Lakowicz Biophys JR. Chem. 30 (1988) 271. [DOI] [PubMed] [Google Scholar]
- [8].Piston J and Gratton E, Biophys. J 56 (1989) 1083. [DOI] [PMC free article] [PubMed] [Google Scholar]
- [9].Lakowicz JR, Cherek H, Gryczynski I, Joshi N and Johnson ML, Biophys. J 51 (1987) 755. [DOI] [PMC free article] [PubMed] [Google Scholar]
- [10].Lakowicz JR, Gryczynski I, Szmacinski H, Cherek H and Joshi N, Eur. Biophys. J 19 (1991) 125. [DOI] [PMC free article] [PubMed] [Google Scholar]
- [11].Lakowicz JR, in: New comprehensive biochemistry, Vol. 11, Part B. Modern physical methods, eds. Neuberger A and van Deenen L (Elsevier, Amsterdam, 1988) pp. 1–26. [Google Scholar]
- [12].Lakowicz JR, Cherek H, Maliwal B and Gratton E, Biochemistry 24 (1985) 376. [DOI] [PMC free article] [PubMed] [Google Scholar]
- [13].Lakowicz JR, Gryczynski I, Cherek H and Laczko G, Biophys. Chem 39 (1991) 241. [DOI] [PubMed] [Google Scholar]
- [14].Weber G, J. Chem. Phys 66 (1977) 4081. [Google Scholar]
- [15].Weber G, Acta. Phys. Pol. A 54 (1978) 859. [Google Scholar]
- [16].Mantulin WW and Weber G, J. Chem. Phys 66 (1977) 4092. [Google Scholar]
- [17].Weber G, in: Fluorescence and phosphorescence analysis, ed. Hercules DM (Wiley, New York, 1966) Ch. 8, p. 217. [Google Scholar]
- [18].Lakowicz JR, Principles of fluorescence spectroscopy (Plenum Press, New York, 1983). [Google Scholar]
- [19].Lakowicz JR, Gratton E, Laczko G, Cherek H and Limkemann M, Biophys. J 46 (1984) 463. [DOI] [PMC free article] [PubMed] [Google Scholar]
- [20].Lakowicz JR, Gratton E, Cherek H, Maliwal BP and Laczko G, J. Biol. Chem 259 (1984) 10967. [PubMed] [Google Scholar]
- [21].Maliwal BP and Lakowicz JR, Biochim. Biophys. Acta 873 (1986) 161. [DOI] [PubMed] [Google Scholar]
- [22].Wirth MJ and Lytle FE, Anal. Chem 49 (1977) 2954. [Google Scholar]
- [23].Denk W, Strickler JH and Webb WW, Science 248 (1990) 3. [DOI] [PubMed] [Google Scholar]
- [24].Valeur B and Weber G, Photochem. Photobiol 25 (1977) 441. [DOI] [PubMed] [Google Scholar]
- [25].Rehms AA and Callis PR, Chem. Phys. Letters 140 (1987) 83. [Google Scholar]
- [26].Eftink MR, Selvidge LA, Callis PR and Rehms AA, J. Phys. Chem 94 (1990) 3469. [Google Scholar]


