Abstract
Time-resolved fluorescence spectroscopy is presently regarded as a research tool in biochemistry, biophysics and chemical physics. However, time-resolved methods can also be used for chemical sensing. Lifetime-based sensing has several advantages over intensity-based methods. Since the lifetime is independent of the total probe intensity, its measurement can provide quantitative sensing of many analytes without the requirement for wavelength-ratiometric probes. Analytes like oxygen and halides can be determined by the collisional quenching mechanism. To date, lifetime probes for analyte recognition (binding) have been identified for Ca 2+, Mg 2 +, K + and pH. Importantly, the lifetime method provides a possibility to expand the sensitive analyte concentration range using probes with spectral shifts. The fluorescence lifetime method allows the sensing of analytes for which there are no direct probes, like glucose, antigens, or any affinity or immunoassays based on fluorescence energy transfer as the transduction mechanism. Advances in instrumentation, laser technology, fiber-optics and especially long-wavelength probes can result in the rapid migration of time-resolved fluorescence to clinical chemistry, environmental sensing and industrial applications. We shall describe phase-modulation instrumentation that can use simple light sources for which the light can be modulated externally by acoustooptic modulators or internally by driving current. Finally, we shall describe fluorescence lifetime imaging microscopy (FLIM), in which image contrast is created from the lifetime at each point of the image. Time-resolved imaging is now a reality in fluorescence microscopy, and promises to provide chemical imaging of a variety of intracellular analyte and/or cellular phenomena.
Keywords: Lifetime-based sensing, Time-resolved fluorescence spectroscopy
1. Introduction
At present, there is considerable interest and research activity in the field of chemical sensing [1–6]. Rapid and continuous monitoring of many analytes (pH, pCO2, O2, metal ions, etc.) is required in many areas of science, including analytical chemistry, biochemistry, environmental sensing, clinical chemistry and industrial applications. Fluorescence-based sensing is one of the promising techniques because of the increasing number of sensitive and specific fluorescent probes for a variety of analytes [7], their fabrication with fiber optics [2] and image-processing techniques such as fluorescence lifetime imaging microscopy (FLIM). There is a significant interest in creating two-dimensional fluorescence-lifetime images, and several techniques have recently been described [8–13]. Good sensitivity and specificity are obtained from either the properties of the fluorophore or its fabrication within the sensing element. Fiber optics can be readily adapted for chemical sensing and can be fabricated with fluorescence probes suitable for remote sensing and safe operation in chemical environments [2]. It has been shown that nanosecond resolution can be maintained for transmission distances up to 1 km in a typical multimode optical fiber [14].
Currently, most types of fluorescence sensing and imaging are based on the standard intensity-based methods, in which the intensity of the probe molecule changes in response to the analyte of interest. While intensity measurements are simple and accurate in the laboratory, they are often inadequate in real-world situations. This is because the sample may be turbid, the optical surfaces may be imprecise and become dirty and optical alignment may vary from sample to sample. In the case of fluorescence microscopy, it is often impossible to know the probe concentration at each point in the image and additionally intensity changes may be due to photobleaching, phototransformation and/or diffusive processes. Generally, intensity-based quantitative sensing and imaging require wavelength-ratiometric probes.
Recent advances in electronics, electrooptics, acoustooptics and laser technology have now made possible a new type of fluorescence sensing and imaging. Instead of fluorescence intensities or intensity ratios, it is possible to measure the fluorescence lifetime, particularly by the phase-modulation method with simple light sources [15–18]. Since the fluorescence lifetime is an intrinsic property of the probe molecule, it is insensitive to the total intensity and can provide quantitative measurements without the requirement for wavelength-ratiometric probes. A wide variety of quenchers and/or molecular interactions result in changes in the lifetime of fluorophores without any spectral shifts [19]. Additionally, the fluorescence resonance energy transfer (FRET) mechanism can be exploited to create probes for various analytes, especially those for which there are no direct probes, such as glucose sensing and in immunoassay [20–24]. There are also a number of known probes for analyte recognition that change the lifetime upon analyte binding or protonation [25–31]. In this paper we shall focus mostly on aspects of lifetime-based sensing using probes for analyte recognition.
FLIM allows images to be created where the contrast is based on a two-dimensional fluorescence lifetime distribution. The images of a living cell based on fluorescence lifetime have recently been reported [32,33]. Fluorescence images with present computer processing and video systems may provide a large amount of information, such as two-dimensional images of the concentrate of intracellular metal ions (Ca2+, Mg2+, Na+, K+, Cl−) or pH. The samples can be investigated in vivo or in vitro under natural biological conditions because the fluorescence measurements are non-destructive and almost non-invasive.
2. Molecular mechanisms for fluorescence lifetime-based sensing
The fluorescence lifetime of a sample is the mean duration of time the fluorophore remains in the excited state. Following pulsed excitation, the intensity decays of many fluorophores are single exponential [34,35]:
| (1) |
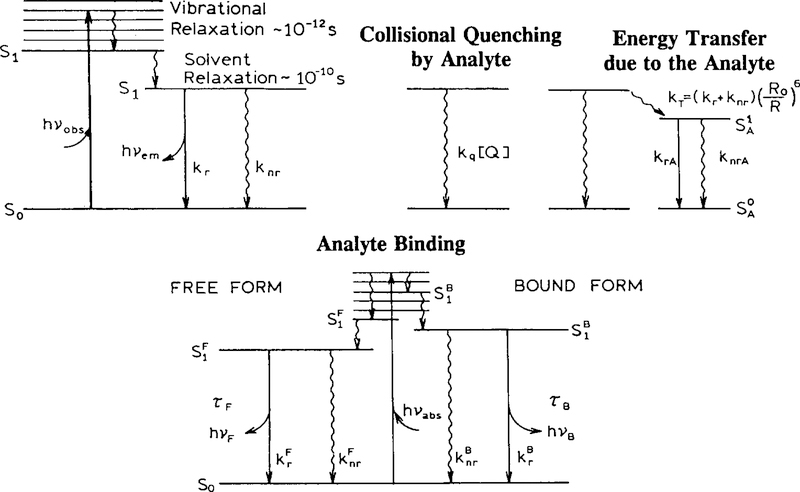
where I0 is the intensity at t = 0 and τ is the lifetime. A variety of molecular interactions can influence the decay time, as can be seen from the Jablonski diagram (Fig. 1). The excited fluorophore can return to the ground state by the radiative (emission) pathway with a rate kr. The inverse of this rate constant is usually called the intrinsic or radiative lifetime. The radiative decay rate kr is generally of intramolecular origin, with only a modest dependence on the local environment.
Fig. 1.
Mechanisms of fluorescence lifetime-based sensing.
There are many molecular interactions that influence the fluorescence decay times. The measured fluorescence lifetime τ is usually shorter than the radiative lifetime τr because of the presence of other decay rates that can be dependent on intramolecular processes and intermolecular interactions (Fig. 1). The measured fluorescence lifetime (τ) is given by the inverse of the total rate of dynamic processes that cause deactivation from the excited (mostly singlet S1) state:
| (2) |
Non-radiative processes (knr) can occur with a wide range of rate constants. Molecules with high knr values display low quantum yields due to rapid depopulation of the excited state by this route. The measured lifetime in the absence of collisional or energy-transfer quenching is usually referred to as τ0, and is given by .
One easily understood mechanism for changes in lifetime is collisional quenching. A variety of substances act as quenchers, including oxygen, nitrous oxide, heavy atoms, Cl− and amines, to name a few. The dynamic quenching rate constant, kq, for a diffusion-limited reaction can be described by the Smoluchowski equation:
| (3) |
where DP and DQ are the diffusion coefficients of probe and quencher, respectively. N′ is the number of molecules per millimole and p is a factor that depends on the quenching mechanism and is related to the probability of each collision causing quenching and to the radius of interaction of probe and quencher [36], Collisional quenching by oxygen has been used for intensity-based and lifetime-based sensing of oxygen using the long-lifetime transition metal complexes resulting with the large amount of quenching by oxygen [15,37–39].
Another mechanism that decreases the fluorescence intensity and decay time is FRET [40]. An energy-transfer-based sensor consists of two kinds of molecules, donor (fluorescent) and acceptor (fluorescent or non-fluorescent). FRET requires partial overlap of the emission spectrum of the donor with the absorption spectrum of the acceptor. The rate of transfer of excitation energy by the dipole–dipole interaction is given by Förster [40] as
| (4) |
where R0 is the Forster critical distance, defined as the distance between donor and acceptor at which 50% of the donor molecules decay by energy transfer and 50% by the usual radiative and non-radiative decay rates. A large number of possible donor–acceptor pairs with specified values of R0 are given in Ref. [41]. Chemical sensing is achieved by the changes of energy-transfer efficiency from donor to acceptor due to analyte-induced changes in the acceptor absorption, which change the effective value of R0. Another approach is analyte-induced changes in the average distance (r) between the donor and acceptor.
Lifetime-based sensing can also be based on the probes for analyte recognition. In such probes there are chelating groups which are incorporated within the fluorophore or conjugated to the fluorophore. Because of the specific chelators, the probe binds the analyte and changes its photophysical properties [31,42–45]. The lifetime-based sensing relies on the existence of two forms of the probe with different lifetimes, the fraction of which depends on the analyte concentration. This case is presented in Fig. 1, where it is assumed that the absorption spectra overlap and both forms can be excited at the same wavelength. The sample displays two lifetimes (τF and τB), which are characteristic of the analyte-free (F) and analyte-bound (B) forms of the probes. The change in lifetime (from τF to τB) due to binding of the analyte may be the result of changes of the radiative and/or non-radiative decay rates. Binding may also result in spectral shifts. In Fig. 1 we have assumed that the complexed form has a blue-shifted spectrum (higher energy) relative to that of the free form. This type of behavior is known to occur for several Ca2+, Mg2−, K+ and pH probes, such as Fura-2, Mag-quin-2, PBFI and the SNAFL’s probes [7], respectively. However there are probes that do not display spectral shifts upon complexation, like the Calcium Color series, but which display significant changes in quantum yield and lifetimes due to different decay rates for free and bound forms [26,46].
It is important to notice that a change in fluorescence quantum yield does not necessarily result in a change in fluorescence lifetime. This is because the quantum yield is related to relative decay rates and the lifetime to the absolute decay rates . A simultaneous decrease of the non-radiative (knr) and increase of the radiative (kr) rate will result in an increased quantum yield but may have no effect on the lifetime. The increase of kr may be compensated by the decrease of knr.
3. Measurement of fluorescence lifetimes
There are two widely used methods for measuring fluorescence lifetimes: the time-domain and frequency-domain or phase-modulation methods. The basic principles of time-domain fluorometry are described in Refs. [47,48] and of those of the frequency-domain method in Refs. [49,50], Good accounts of time-resolved measurements using these methods are also given elsewhere [49,51], It is common to represent intensity decays of varying complexity in terms of the multi-exponential model,
| (5) |
where the αi, are the pre-exponential factors and the τi, are the decay times. The fractional intensity of each form to the steady-state intensity is proportional to the pre-exponential factor and decay time,
| (6) |
This fact can be understood by recognizing that the αiτi, product represents the area under the decay curve due to the component with the lifetime τi.
We note that a variety of factors can be responsible for complex multi-exponential or non-exponential decays. Depending upon the molecular origin of the complex decay kinetics, the values of αi and τi, may have direct or indirect molecular significance. For instance, for a mixture of two fluorophores (complexed and free forms or protonated and unprotonated forms), each of which displays a single decay time, the τi, are the two individual decay times, and the fi are the fractional contributions of each fluorophore to the total emission. If a single fluorophore is in two different environments, such as protein bound and free, then the αi, values often represent the fraction of the molecules in each environment. However, in many circumstances there is no obvious linkage between the αi and τi, values and the molecular heterogeneity of the samples. There are a number of cases in which non-exponential decay is encountered, such as resonance energy transfer, collisional quenching and solvent relaxation. While it is of interest to interpret such complex decays in terms of molecular interactions within the sample, it is not necessary to have a complete understanding of the decay processes before a probe can be used for lifetime-based sensing. In lifetime-based sensing, measurement of a mean lifetime is usually adequate to quantify the analyte. The mean lifetime is related to the multi-exponential parameters by
| (7) |
The mean lifetime can be used to determine the analyte concentration with a suitable calibration curve.
4. Instrumentation for phase-modulation lifetime measurement
The rapid time scale of fluorescence emission results in a significant technological challenge to measure the time-dependent decays. Instrumentation for lifetime measurements, using time-domain or frequency-domain methods, is complex and expensive. Present state-of-the-art instruments use picosecond laser sources and very fast photodetectors to provide resolution of multi-exponential and non-exponential intensity decays. Consequently, time-resolved fluorescence spectroscopy has thus been primarily a research tool in biochemistry, biophysics and chemical physics [19,52,53]. The instrumentation for chemical sensing may be significantly simplified if the phase-modulation method is used.
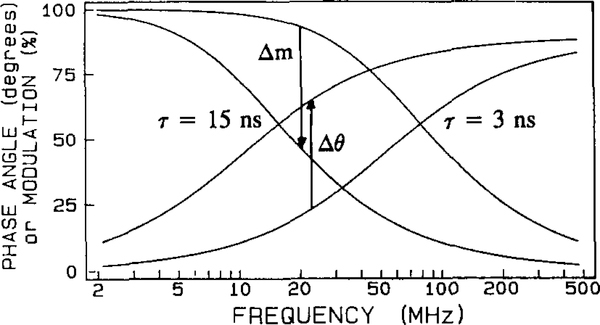
In phase-modulation fluorometry, the pulsed light source typical of time-domain measurements is replaced by an intensity-modulated source. Because of the time lag between absorption and emission, the emission is delayed in time relative to the modulated excitation. At each modulation frequency this delay is described as the phase shift (θω), which increases from 0 to 90° with increasing modulation frequency. The finite time response of the sample also results in demodulation to the emission by a factor mω, which decreases from 1.0 to 0.0 with increasing modulation frequency. The fluorescence intensity decay is represented by the frequency responses in phase angle and modulation (Fig. 2). The phase angle (θω) and the modulation (mω) are separate measurements, each of which is related to the intensity decay parameters, αi and τi, and modulation frequency ω by [54]
| (8) |
where
| (9) |
Fig. 2.
Frequency-domain (phase-modulation) method.
Research instrumentation for phase-modulation fluorometry operates over a wide range of light modulation frequencies and excitation wavelengths. A wide range of modulation frequencies is necessary to resolve complex intensity decays. Consequently, instruments are somewhat expensive and complex [55]. If the probe characteristics are known, the phase-modulation instrument can be designed with a single-wavelength light source and to operate at just one light modulation frequency appropriate for the chosen probe. Fig. 2 shows frequency responses for decay times of 3 and 15 ns. The frequency responses of the longer lifetime are shifted towards lower modulation frequencies. The change in lifetime due to the analyte can be monitored by changes in the phase angle (Δ0) and/or modulation (Δm) at the optimal modulation frequency (F). The phase angle and modulation can be measured with high accuracy (usually 0.2° and 0.5%). This specialization can result in decreased complexity and cost, since simple light source can be used, such as a green HeNe laser and an acoustooptic modulator [28], modulated LED (light-emitting diode) [15,56], modulated ELL (electro-luminescent light) [18] or just a laser diode [16,17]. The electronics for phase-modulation sensing can be based on relatively low-cost components, and phase and modulation at a single frequency are easily measured in a second or less of data acquisition [18,56], Also, laser diode sources can allow even simpler instrumentation because they can be modulated by the driving current; such sources have already been used for frequency-domain measurements up to 2 GHz [16,17]. However, the use of laser diode sources for lifetime-based sensing requires the development of red and/or NIR lifetime probes.
5. Sensing based on probe–analyte recognition
The photophysical properties (extinction coefficient, shifts in absorption and emission spectra, quantum yield and lifetime) for a variety of probes are modified by pH changes, complexation by metal ions or redox reactions. The resulting changes in photophysical parameters can be used to determine the concentration of H+ and metal cations with suitably designed fluorophores. Most of these resulting sensors involve an equilibrium between the analyte and the free probe (unprotonated or non-complexed by metal ion). If the stoichiometry of this reaction is 1:1, the reaction may be represented by
| (10) |
The equilibrium is governed by the dissociation constant, KD, defined as
| (11) |
which is a characteristic value for a specific probe under specific conditions (temperature, viscosity, ionic strength, pH). The value of the dissociation constant KD determines the analyte concentration range over which the probe can be used. The useful range of analyte concentrations is typically restricted to with spectroscopic signals varying from 10 to 90%. This limitation has the effect of requiring that the value of KD for a fluorescent probe be near to the actual concentration of the analyte of interest. However, by using wavelength-ratiometric probes and lifetime measurements the measurable analyte concentration range can be greatly expanded from about two (intensity measurements) to about four concentration decades [28]. This can be achieved by simply choosing different excitation (excitation-ratiometric probes) or emission (emission-ratiometric probes) wavelengths.
Many probes are now known which display changes in fluorescence lifetime upon complexation of the analyte [25–31]. To illustrate the use of time-resolved data for sensing, assume that each form (free and complexed) has a unique decay time (τF and τB). The intensity decay of a mixture is a double exponential:
| (12) |
The pre-exponential factors αF and αB are related to the concentration of each form, [PF] and [PB], respectively. The relative intensity observed in the usual steady-state measurement due to each component (Eq. (6)) is given by
| (13) |
Fractional intensities are related to the concentrations of each species by
| (14) |
where ϕ is the quantum yield, IE the excitation intensity, ε the extinction coefficient at the excitation wavelength, [P] the concentration, d the optical path length for exciting light, k the geometrical constant and i refers to each form of the probe. The combination of Eqs. (13) and (14) yields
| (15) |
The equilibrium between the analyte-bound and the free forms of the probe ([PF] = [PB]) does not necessarily mean that the pre-exponential factors are also equal. Their relative value depends on the relative concentration of free and bound forms as well as on steady-state (εi, and ϕi) and intensity decay (τi) parameters. Depending on the value created by εi, ϕi and τi, in Eq. (15), the pre-exponential factors will reflect values different from the true fractions of the free and bound forms of the probe. A graphical representation of pre-exponential factors versus fractional concentration similar to Eq. (15) for the calcium probes Quin-2 and Calcium Green has been presented in a recent report [29].
In the phase-modulation method lifetime-based sensing is expected to rely on measurements of the phase angle and/or modulation at a single modulation frequency. Changes in relative pre-exponential factors due to the analyte can be monitored by measuring the phase angle and/or modulation. The values of the phase angle and modulation will vary according to Eqs. (8) and (9). The optimal modulation frequency (maximum changes in phase angle and modulation) depends on the lifetimes τi. If the intensity decays (τF and τB) are single exponential, the optimal modulation frequency can be calculated as
| (16) |
Most fluorescent probes display multi-exponential intensity decays and the optimal modulation frequency can be found from the experimental frequency responses. However, there is always a rather wide range of frequencies with high dynamic range in phase angle and modulation that can be used for sensing (see Fig. 2).
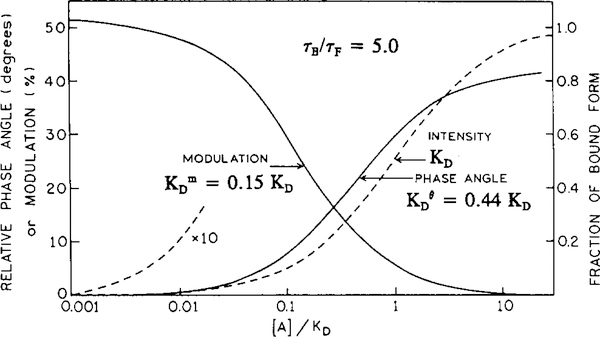
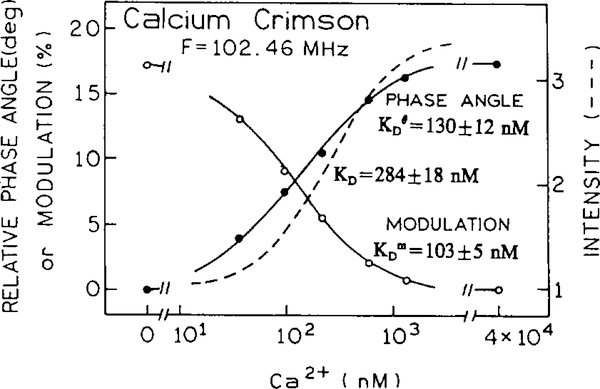
Simulated data show that even where pre-exponential factors reflect the concentration of free and bound forms, there are always shifts in phase angle and modulation response functions. The apparent dissociation constants for phase angle and modulation strongly depend on the value of τB/τF. If τB > τF the apparent phase angle and modulation dissociation constants display significantly lower values than the true KD. For example, if τB/τF = 2, 5 (see Fig. 3) and 10, the apparent dissociation constants are 0.71, 0.44, 0.31KD for phase angle and 0.33, 0.15, 0.07 KD for modulation, respectively. It should be noted that the apparent dissociation constants for the modulation are significantly lower than for phase angle. This is because the modulation is more sensitive to the longer decay component than the phase angle (see Eqs. (8) and (9)). The apparent dissociation constants were calculated using plots of versus log[A] (Hill plots). For sensing, the apparent dissociation constant determines the measurable analyte concentration range that can be determined by the particular measured parameter (e.g., phase angle or modulation). The difference in apparent dissociation constants for phase and modulation allows the analyte sensitive concentration range to be extended if both parameters are measured. Fig. 4 shows calibration curves for the calcium probe Calcium Crimson. Calcium Crimson is a non-ratiometric probe with visible excitation and emission wavelengths [7,26]. The change in lifetime upon calcium binding is moderate, from 2.51 to 4.11 ns. The calcium-free form of Calcium Crimson displays a double-exponential and the Ca2+-bound found a single-exponential form. This moderate change in lifetime (τB/τF = 1.61) generates significant changes in phase angle (17.4°) and in modulation (17.6%) at a modulation frequency of 102.46 MHz (Fig. 4). The longer lifetime of the Ca2+ - bound form of the Calcium Crimson results in lower values of the apparent dissociation constants from phase angle and modulation compared to that from intensity. Other calcium probes from this series, like Calcium Orange and Calcium Green, display a higher sensitivity to calcium [26].
Fig. 3.
Shifts of the apparent phase-angle and modulation dissociation constants for a probe that displays a five-fold change in lifetime on analyte binding.
Fig. 4.
Ca2+-dependent phase angle, modulation and intensity for the non-ratiometric probe Calcium Crimson.
If the probe displays a shift in absorption and/or emission spectra, the apparent dissociation constant will depend not only on the measured parameter but also on the excitation and emission wavelengths. For probes that display a shift in the absorption spectrum upon analyte binding, the value of εF/εB depends on the excitation wavelength. For probes that display a shift in emission spectrum the value of ϕF/ϕB may depend on the observation wavelength. The emission filter (bandpass or long-wave-pass) may not transmit the total emission spectrum of each form, the sensitivity of the detection system may not be the same over the wide range of wavelengths, or observation is through a narrow-bandpass filter (e.g., an interference filter). In such cases the contribution to the emission signal of each form of the probe will depend on the observation method and not only on the respective absolute quantum yields (ϕ). The free or bound form can be preferentially excited or/and observed, which will result in various values of the amplitudes (αF and αB) (see Eq. (15)) and shifts in the apparent dissociation constants as desired by phase angle and/or modulation measurements.
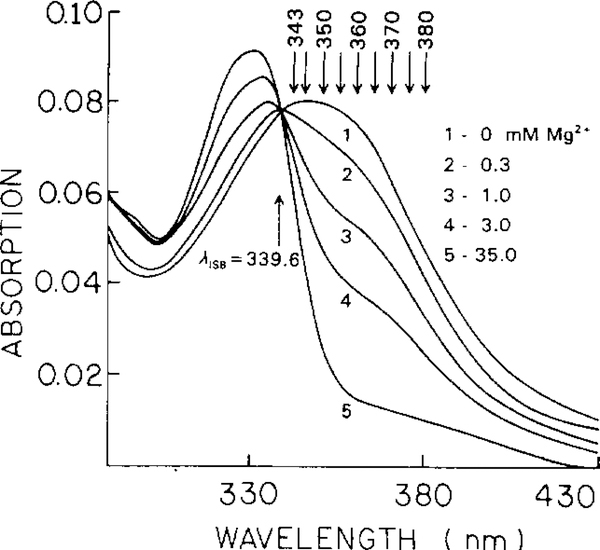
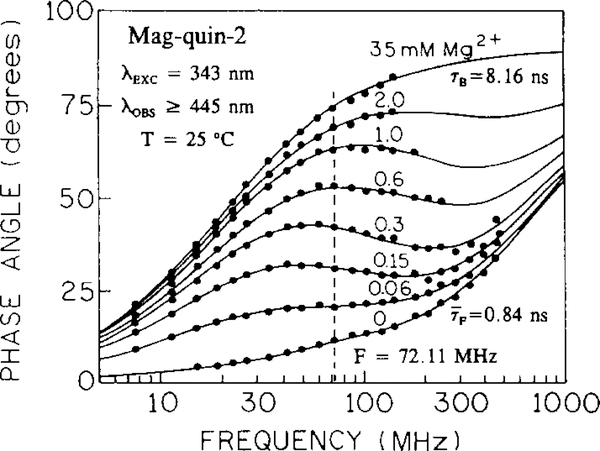
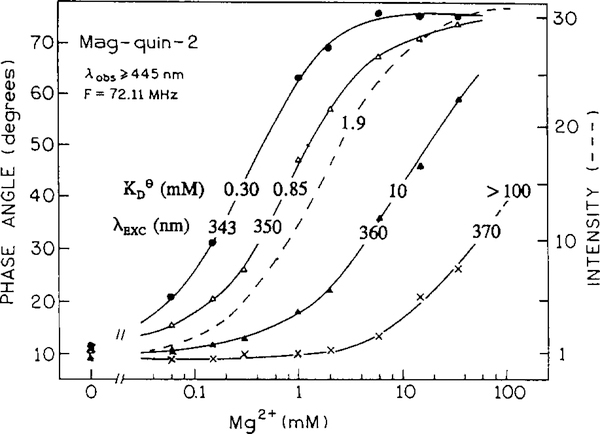
Fig. 5 presents absorption spectra of the magnesium probe Mag-quin-2. The emission spectrum shifts only 6 nm from 487 to 493 nm in its maximum (not shown). The lifetime increases from 0.84 ns (triple-exponential decay) to 8.16 ns (single-exponential decay). Such a large difference in the lifetimes (9.7-fold) results in complex frequency responses (Fig. 6). Regardless of the intensity decay heterogeneity of the Mag-quin-2, a single modulation frequency can be chosen for magnesium sensing. Using phase angles measured at a modulation frequency of 72.11 MHz from Fig. 6, one can plot calibration curves such as in Fig. 7 with an apparent . Using longer excitation wavelengths, the sensitive magnesium concentration range can be substantially shifted towards higher magnesium concentrations. This possibility of expanding the analyte-sensitive concentration range by simply shifting the excitation wavelength is a great advantage of the lifetime-based method. A single wavelength-ratiometric probe may be sensitive over a wide range of analyte concentrations using the lifetime method, which is not possible using the intensity-based method. In the present example (Mag-quin-2) intensity-based sensing allows Mg2+ measurement from 0.19 to 19 mM, and phase-angle sensing from 0.03 to 1000 mM of magnesium (assuming a range from 10 to 90% of the signal response).
Fig. 5.
Mg2+-dependent absorption spectra of Mag-quin-2.
Fig. 6.
Mg2+-dependent phase angle-frequency responses for Mag-quin-2.
Fig. 7.
Mg2+ - and excitation-dependent phase angle for Mag-quin-2.
Calcium probes like Quin-2 and Fura-2, which also display shifts in absorption spectra and changes in lifetimes when bound to Ca2+, allow expansion of the calcium-concentration sensitive range.
There are a number of pH probes like SNAFLs and SNARFs which are dual-ratiometric probes with different lifetimes for protonated and unprotonated forms. Expanding the pH-sensitive range using these probes is even easier because different observation wavelengths can be used [28]. This does not require different excitation sources, which is inconvenient with lasers. By simply changing emission filters, various pH-sensitive ranges can be chosen with the same sensitivity. For SNAFL and SNARF probes expanded pH sensing is also possible with various excitation wavelengths.
Phase angle and modulation currently seem to be the most convenient parameters in lifetime-based sensing, because a single frequency is sufficient for direct mapping of their values (θ or m) to the analyte concentration. Also, one does not require measurements over a wide range of frequencies, which are only needed to recover the pre-exponential factors and associated decay times.
6. Summary and prospects
Lifetime-based sensing is advantageous because the measurements can be independent of fluorescence intensity. This insensitivity offers opportunities in fluorescence microscopy where the local probe concentration generally cannot be controlled, in remote sensing using fiber optics where there are losses of excitation and emission intensity, and in flow cytometry where there are variations in cell volume and extent of probe uptake. Phase-angle and/or modulation measurement at a single modulation frequency offers fast temporal resolution and significantly simplified instrumentation. Amplitude modulation of the excitation can be easily accomplished using commercially available acoustooptic modulators and c.w. lasers, such as HeCd (354 or 442 nm) or HeNe (543 and 633 nm). Diode lasers can be modulated intrinsically. Lifetime-based sensing (phase modulation) does not require complete resolution of a multi-exponential decay, and probes with complex intensity decays are suitable for sensing. Phase angle and modulation are very sensitive to intensity decay parameters and a 1.5-fold change in lifetime results in a sufficient change in phase angle (about 12°) and modulation (about 14%) for accurate analyte measurements. This allows the use of probes that are less sensitive to analyte. Lifetime-based sensing also allows the use of the mechanisms of collisional quenching and resonance energy transfer, where there are no spectral shifts for ratiometric sensing. Additionally, syntheses of probes for visible excitation have resulted in probes like the Calcium Color series, which do not display spectral shifts [7,26,46]. However, such probes are suitable for lifetime-based sensing.
Many difficulties encountered with intensity measurements can be circumvented by the use of lifetime-based sensing. It is now possible to measure the phase angles on a cell-by-cell basis as they pass through the laser beam using a phase flow cytometer [57], Fluorescence lifetime imaging (FLIM) allows image contrast to be created based on the lifetime of the probe at each point in the image. If the probe lifetime is sensitive to analyte, one now has the ability to create chemical and biochemical images of cells [32,33] and tissues.
Finally, we note that future instruments for lifetime-based sensing and imaging can be based on laser diode light sources. At present it is desirable to develop specific probes that can be excited from 630 to 780 nm, the usual range of laser diodes. The use of such probes will allow us to avoid the use of complex laser sources, which should result in the expanded use of fluorescence detection in chemical and biomedical sensors.
Acknowledgements
This work was supported by the National Center for Research Resources (RR-08119), with additional support from NIH grants GM-35154 and RR-07510-01.
Biographies
Henryk Szmacinski received a Ph.D. degree in experimental physics from the University of Gdansk, Poland, in 1980. In 1986 he joined the University of Maryland where he is employed as a research assistant professor in the Department of Biological Chemistry. His special interests include applications of time-resolved fluorescence spectroscopy to clinical chemistry, medical diagnostics and fluorescence microscopy. He has published over 50 papers including his most recent papers and book chapters on the topic of fluorescence lifetime-based sensing and imaging.
Joseph R. Lakowicz received a Ph.D. degree from the University of Illinois at Urbana-Champaign in 1973. He is director of the Center of Fluorescence Spectroscopy at the University of Maryland, School of Medicine.
Footnotes
Plenary paper.
References
- [1].Janata J and Bezegh A, Chemical sensors, Anal. Chem, 60 (1988) 62R–74R. [DOI] [PubMed] [Google Scholar]
- [2].Wolfbeis OS (ed.), Fiber Optic Chemical Sensors and Biosensors, Vols. I and II, CRC Press, Boca Raton, FL, 1991. [Google Scholar]
- [3].Baeyens WRG, De Keukelaire D and Korkidis K. (eds.), Luminescence Techniques in Chemical and Biomedical Analysis, Marcel Dekker, New York, 1991. [Google Scholar]
- [4].Wolfbeis OS (ed.), Fluorescence Spectroscopy, New Methods and Applications, Springer, Berlin, 1993. [Google Scholar]
- [5].Czarnik AW (ed.), Fluorescent Chemosensors for Ion and Molecule Recognition, ACS Symp. Series No. 538. ACS, Washington, DC, 1993. [Google Scholar]
- [6].Taylor DL, Waggoner AS, Murphy RF, Lanni F and Birge RR (eds.). Applications of Fluorescence in the Biomedical Sciences, Liss, New York. 1985. [Google Scholar]
- [7].Haugland RP, in Larison KD (ed.), Handbook of Fluorescent Probes and Research Chemicals. Molecular Probes, Eugene, OR, 1992–1994. [Google Scholar]
- [8].Marriot G, Clegg RM, Arndt-Jovin DJ and Jovin TM, Time-resolved imaging microscopy. Phosphorescence and delayed fluorescence imaging, Biophys. J, 60(1991) 1374–1387. [DOI] [PMC free article] [PubMed] [Google Scholar]
- [9].Clegg RM, Feddersen B, Gratton E and Jovin TM, Time-resolved imaging microscopy, SPIE Proc., Vol. 1640, 1992, pp. 448–460. [Google Scholar]
- [10].Lakowicz JR, Szmacinski H, Nowaczyk K, Berndt KW and Johnson ML, Fluorescence lifetime imaging. Anal. Biochem., 202 (1992) 316–330. [DOI] [PMC free article] [PubMed] [Google Scholar]
- [11].Wang XF, Periasamy A and Herman B, Fluorescence lifetime imaging microscopy (FLIM): instrumentation and applications, Crit. Rev. Anal. Chem, 23(5) (1992) 369–395. [Google Scholar]
- [12].Morgan CG, Mitchell AC and Murray JG, Prospects for confocal imaging based on nanosecond fluorescence decay time. J. Microscopy, 165 (1992) 49–60. [Google Scholar]
- [13].Gadella TWJ Jr., Jovin TM and Clegg RM, Fluorescence lifetime imaging microscopy (FLIM): spatial resolution of microstructures on the nanosecond time scale, Biophys. Chem, 48 (1993) 221–239. [Google Scholar]
- [14].Vickers GH, Miller RM and Hieftje GM, Time-resolved fluorescence with an optical-fiber probe. Anal. Chim. Acta, 192 (1987) 145–153. [Google Scholar]
- [15].Lippitsch ME, Pasterhofer J, Leiner MJP and Wolfbeis OS, Fibre-optic oxygen sensor with the fluorescence decay time as the information carrier, Anal. Chim. Acta, 205 (1988) 1–6. [Google Scholar]
- [16].Berndt KW, Gryczynski I and Lakowicz JR, Phase-modulation fiuorometry using a frequency-doubled pulsed laser diode source. Rev. Sci. Instrum, 61(7) (1990) 1816–1820. [DOI] [PMC free article] [PubMed] [Google Scholar]
- [17].Thompson RB, Frisoli JK and Lakowicz JR, Phase fiuorometry using a continuously modulated laser diode. Anal. Chem, 64 (1992) 2075–2078. [DOI] [PMC free article] [PubMed] [Google Scholar]
- [18].Berndt KW and Lakowicz JR, Electroluminescent lamp-based phase fluorometer and oxygen sensor. Anal. Biochem, 201 (1992) 319–325. [DOI] [PubMed] [Google Scholar]
- [19].Lakowicz JR (ed.), Topics in Fluorescence Spectroscopy, Vols. 1–3, Plenum Press, New York, 1991–1992. [Google Scholar]
- [20].Meadows D and Schultz JS Fiber-optic biosensors base on fluorescence energy transfer, Talanta, 35 (1988) 145–150. [DOI] [PubMed] [Google Scholar]
- [21].Lakowicz JR and Maliwal B, Optical sensing of glucose using phase-modulation fluorimetry, Anal. Chim. Acta, 271 (1993) 155–164. [Google Scholar]
- [22].Lakowicz JR, Maliwal B, Ozinskas A and Thompson RB, Fluorescence lifetime energy-transfer immunoassay quantified by phase-modulation fiuorometry, Sensors and Actuators B, 12 (1993) 65–70. [Google Scholar]
- [23].Ozinskas AO, Malak H, Joshi J, Szmacinski H, Britz J, Thompson RB, Koen PA and Lakowicz JR, Homogeneous model immunoassay of thyroxine by phase-modulation fluorescence spectroscopy, Anal. Biochem, 213 (1993) 264–270. [DOI] [PubMed] [Google Scholar]
- [24].Zhang Z, Seitz WR and O’Connel K, Amylase substrate based on fluorescence energy transfer. Anal. Chim. Acta, 236 (1988) 251–256. [Google Scholar]
- [25].Lakowicz JR, Szmacinski H, Nowaczyk K and Johnson ML, Fluorescence lifetime imaging of calcium using Quin-2, Cell Calcium, 13 (1992) 131–147. [DOI] [PMC free article] [PubMed] [Google Scholar]
- [26].Lakowicz JR, Szmacinski H and Johnson ML, Calcium imaging using fluorescence lifetimes and long-wavelength probes, J. Fluorescence, 2 (1992) 47–62. [DOI] [PMC free article] [PubMed] [Google Scholar]
- [27].Szmacinski H and Lakowicz JR, Optical measurements of Mg 2+ using fluorescence lifetimes and phase-modulation fluorometry, Biophys. J, 64 (1993) A108. [DOI] [PMC free article] [PubMed] [Google Scholar]
- [28].Szmacinski H and Lakowicz JR, Optical measurements of pH using fluorescence lifetimes and phase-modulation fluorometry, Anal. Chem, 65(1993) 1668–1674. [DOI] [PMC free article] [PubMed] [Google Scholar]
- [29].Hirshfeld KM, Toptygin D, Packard BS and Brand L, Dynamic fluorescence measurements of two-state systems: applications to calcium-chelating probes, Anal. Biochem, 209 (1993) 209–218. [DOI] [PubMed] [Google Scholar]
- [30].Szmacinski H, Gryczynski I and Lakowicz JR, Calcium-dependent fluorescence lifetimes of indo-1 for one- and two-photon excitation of fluorescence, Photochem. Photobiol, 58 (1993) 341–345. [DOI] [PubMed] [Google Scholar]
- [31].Valeur B, Bourson J and Pouget J, Ion recognition detected by changes in photoinduced charge or energy transfer, in Czarnik AW (ed.), Fluorescent Chemosensors for Ion and Molecule Recognition, ACS Symp. Series No. 538, ACS, Washington, DC, 1993, pp. 25–44. [Google Scholar]
- [32].Oida T, Sako Y and Kusumi A, Fluorescence lifetime imaging microscopy (flimscopy). Methodology development and application to studies of endosome fusion in single cells, Biophys. J, 64 (1993) 676–685. [DOI] [PMC free article] [PubMed] [Google Scholar]
- [33].Lakowicz JR, Szmacinski H, Nowaczyk K, Lederer WJ, Kirby MS and Johnson ML, Fluorescence lifetime imaging of intracellular calcium in COS cells using Quin-2, Cell Calcium, 15 (1994) 7–27. [DOI] [PMC free article] [PubMed] [Google Scholar]
- [34].Lampert RA, Chewter LA, Phillips D, O’Connor DV, Roberts AJ and Meech SR, Standards for nanosecond fluorescence decay time measurements, Anal. Chem, 55 (1983) 68–73. [Google Scholar]
- [35].Lakowicz JR, Gryczynski I, Laczko G and Gloyna D, Picosecond fluorescence lifetime standards for frequency- and time-domain fluorescence, J. Fluorescence, 1 (1991) 87–93. [DOI] [PubMed] [Google Scholar]
- [36].Eftink MR, Fluorescence quenching: theory and application, in Lakowicz JR (ed.), Topics in Fluorescence Spectroscopy, Principles, Vol. 2, Plenum Press, New York, 1991, pp. 53–126. [Google Scholar]
- [37].Bacon JR and Demas JN, Determination of oxygen by luminescence quenching of a polymer immobilized transition metal complex. Anal. Chem, 59 (1987) 2780–2785. [Google Scholar]
- [38].Carraway ER, Demas JN, DeGraff BA and Bacon JR, Photophysics and photochemistry of oxygen sensors based on luminescent transition metal complexed to oxygen, Anal. Chem, 63 (1991) 337–342. [Google Scholar]
- [39].Lee WW-S, Wong K-Y and Li X-M, Luminescent dicyanoplatinum(II) complexes as sensors for the optical measurement of oxygen, Anal. Chem, 65 (1993) 255–258. [Google Scholar]
- [40].Förster Th., Intermolecular energy migration and fluorescence, Ann. Phys. (Leipzig), 2 (1948) 55–75 (translation 1974 by R.S. Knox). [Google Scholar]
- [41].Berlman IB, Energy Transfer Parameters of Aromatic Compounds, Academic Press, New York, 1973. [Google Scholar]
- [42].Tsien RY, New calcium indicators and buffers with high selectivity against magnesium and protons: design, synthesis, and properties of prototype structures, Biochemistry, 19(1980) 2396–2404. [DOI] [PubMed] [Google Scholar]
- [43].Grynkiewicz G, Poenie M and Tsien RY, A new generation of Ca 2+ indicators with greatly improved fluorescence properties, J. Biol. Chem, 260 (1985) 3440–3450. [PubMed] [Google Scholar]
- [44].Minta A and Tsien RY, Fluorescent indicators for cytosolic sodium, J. Biol. Chem, 264 (1989) 19449–19457. [PubMed] [Google Scholar]
- [45].Raju B, Murphy E, Levy LA, Hall RD and London RE, A fluorescent indicator for measuring cytosolic free magnesium, Am. J. Physiol, 256(1988) C540–C548. [DOI] [PubMed] [Google Scholar]
- [46].Kuhn MA, 1,2-Bis(2-aminophenoxy)ethane-.N,N,N′,N′,-tetra-acetic acid conjugates used to measure intracellular Ca 2+ concentration, in Czarnik AW (ed.), Fluorescent Chemosensors for Ion and Molecule Recognition, ACS Symp. Series No. 538. ACS Washington, DC, 1993, pp. 147–161. [Google Scholar]
- [47].O’Connor DV and Phillips D, Time-correlated Single Photon Counting, Academic Press, London, 1984. [Google Scholar]
- [48].Birch DJS and Imhof RE, Time-domain fluorescence spectroscopy using time-correlated single-photon counting, in Lakowicz JR (ed.), Topics in Fluorescence Spectroscopy, Techniques, Vol. 1, Plenum Press, New York. 1991, pp. 1–95. [Google Scholar]
- [49].Lakowicz JR, Principles of Fluorescence Spectroscopy, Plenum Press, New York, 1983. [Google Scholar]
- [50].Lakowicz JR and Gryczynski I, Frequency-domain fluorescence spectroscopy, in Lakowicz JR (ed.), Topics in Fluorescence Spectroscopy, Techniques, Vol. 1, Plenum Press, New York, 1991, pp. 293–355. [Google Scholar]
- [51].Demas JN, Excited State Lifetime Measurements, Academic Press, New York, 1983. [Google Scholar]
- [52].Dewey TG (ed.), Biophysical and Biochemical Aspects of Fluorescence Spectroscopy, Plenum Press, New York, 1991. [Google Scholar]
- [53].Lakowicz JR (ed.), Time-Resolved Laser Spectroscopy in Biochemistry, SPIE Proc., Vol. 1204, 1990. and Vol. 1640, 1992. [Google Scholar]
- [54].Lakowicz JR, Laczko G, Cherek H, Gratton E and Limkeman M, Analysis of fluorescence decay kinetics from variable-frequency phase shift and modulation data, Biophys. J, 46 (1984) 463–477. [DOI] [PMC free article] [PubMed] [Google Scholar]
- [55].Laczko G, Gryczynski I, Gryczynski Z, Wiczk W, Malak H and Lakowicz JR, A 10-GHz frequency-domain fluorometer, Rev. Sci. Instrum, 61 (1990) 2332–2337. [Google Scholar]
- [56].Bambot SB, Holavanahali R, Lakowicz JR, Carter GM and Rao G, Phase fluorometric sterilizable oxygen sensor, Biotechnol. Bioeng, 43 (1994) 1139–1145. [DOI] [PubMed] [Google Scholar]
- [57].Pinsky BG, Ladaskay JJ, Lakowicz JR, Berndt K and Hoffman RA, Phase-resolved fluorescence lifetime measurements for flow cytometry. Cytometry, 14 (1993) 123–135. [DOI] [PubMed] [Google Scholar]


