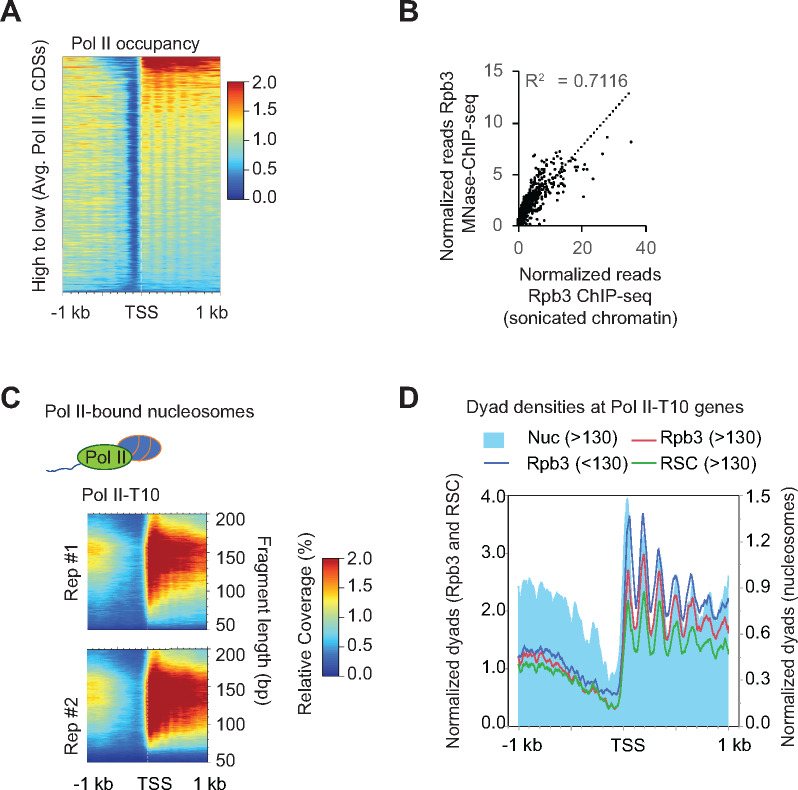
Figure 5.
Pol II interacts with nucleosomes genome-wide.
(A) Heatmap showing Pol II occupancies from Pol-II MNase ChIP-seq data sorted by decreasing Pol II occupancies, which were determined by ChIP-seq using sonicated chromatin.
(B) Scatterplot depicting correlation between Rpb3 ChIP-seq occupancies from MNase and sonicated chromatin.
(C)2D occupancy plots showing MPDF distribution obtained from Rpb3-bound nucleosomes for the top 10% of Pol II-occupied genes.
(D) Plot showing dyad densities for the Rpb3 (MPDFs: <130, blue trace; >130–160; red trace), MPDFs >130 for RSC (green) and nucleosomes (MNase inputs; filled blue).

