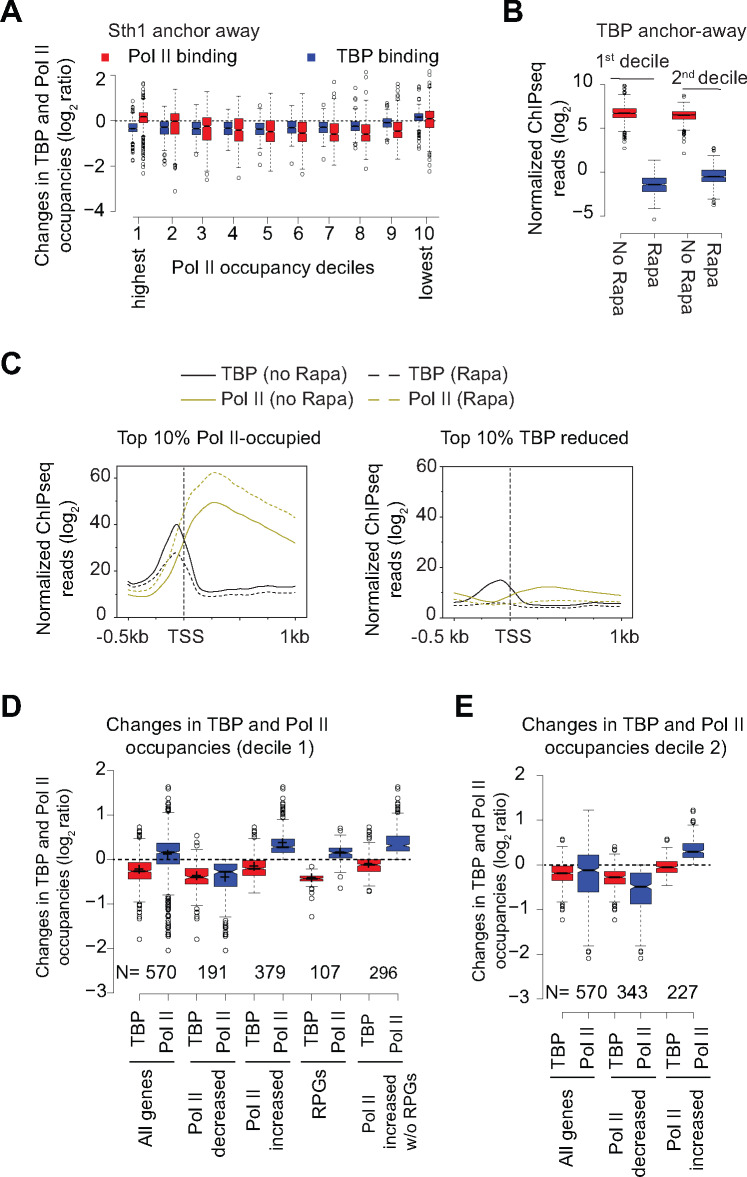
Figure 6.
Nuclear depletion of RSC differentially affects TBP and Pol II occupancies at highly transcribed genes.
The data analyzed in this Figure was obtained from previous studies (Kubik et al.2018) and (Petrenko et al.2019).
(A) Boxplot showing changes in TBP and Pol II binding in Sth1 anchor-away cells (+ Rapa) in deciles based on WT Pol II occupancies (data from Kubik et al.2018). Decile 1 and decile 10 represents the most and the least Pol II-occupied genes, respectively.
(B) Boxplot showing Pol II occupancies for the top 2 deciles of Pol II-occupied genes in untreated and Rapa-treated TBP anchor-away cells.
(C) Metagene plots showing TBP and Pol II occupancies for the top 10% Pol II-occupied genes (left-hand panel) and the top 10% genes showing the most reductions in TBP binding (right-hand panel) in untreated and Rapa-treated Sth1 anchor-away cells.
(D) Boxplots showing TBP and Pol II occupancy for the top decile of Pol II-occupied genes (All genes) and the genes that show reduction in Pol II occupancy (Pol II decreased) upon Sth1 anchor-away. Occupancies are also shown for the genes within the top decile that show increase in Pol II occupancy (Pol II increased) upon Sth1 anchor-away and also for the same gene-set after excluding RPGs. The occupancies for RPGs are also shown.
(E) Boxplots showing TBP and Pol II occupancy for the 2nd decile of Pol II-occupied genes (All genes), the genes that show reduction in Pol II occupancy (Pol II decreased) and those that do not show any decrease (Pol II increased) upon Sth1 anchor-away.)

