

Abstract
Individuals carrying an aberrant number of chromosomes can vary widely in their expression of aneuploidy phenotypes. A major unanswered question is the degree to which an individual’s genetic makeup influences its tolerance of karyotypic imbalance. Here we investigated within-species variation in aneuploidy prevalence and tolerance, using Saccharomyces cerevisiae as a model for eukaryotic biology. We analyzed genotypic and phenotypic variation recently published for over 1,000 S. cerevisiae strains spanning dozens of genetically defined clades and ecological associations. Our results show that the prevalence of chromosome gain and loss varies by clade and can be better explained by differences in genetic background than ecology. The relationships between lineages with high aneuploidy frequencies suggest that increased aneuploidy prevalence emerged multiple times in S. cerevisiae evolution. Separate from aneuploidy prevalence, analyzing growth phenotypes revealed that some genetic backgrounds—such as the European Wine lineage—show fitness costs in aneuploids compared to euploids, whereas other clades with high aneuploidy frequencies show little evidence of major deleterious effects. Our analysis confirms that chromosome gain can produce phenotypic benefits, which could influence evolutionary trajectories. These results have important implications for understanding genetic variation in aneuploidy prevalence in health, disease, and evolution.
Keywords: whole chromosome aneuploidy, chromosome loss, chromosome duplication, evolution, yeast population genetics
Introduction
Chromosomal aneuploidy, in which cells carry too many or too few of individual chromosomes, can arise when chromosomes fail to segregate properly in meiosis or mitosis. An imbalanced karyotype is clearly detrimental during mammalian development, as amplification of all but a few specific chromosomes is inviable (MacLennan et al. 2015). Why aneuploidy is toxic remains an area of active research but is thought to result from imbalanced expression from affected chromosomes relative to the remaining genome (Pavelka and Rancati 2013; Oromendia and Amon 2014; Donnelly and Storchova 2015). Such imbalance could lead to myriad downstream problems, including proteostasis stress that may emerge when mismatched stoichiometries lead to protein misfolding and aggregation (Oromendia et al. 2012; Oromendia and Amon 2014; Donnelly and Storchova 2015). Despite the detrimental effects of aneuploidy during development, aneuploidy is common in other settings, notably cancers. Most solid tumors are aneuploid, yet cancer cells tolerate karyotype imbalance and in some cases thrive because of it (Holland and Cleveland 2012; Targa and Rancati 2018). In fact, chromosome gain that emerges under extreme selective pressure can lead to immediate phenotypic benefits (Pavelka et al. 2010; Chen et al. 2012; Beach et al. 2017). The rapid change in phenotype brought about by karyotype changes can play an important role in selection: aneuploidy is frequently observed in drug-resistant Candida albicans and Cryptococcus neoformans pathogens that emerge from drug treatments, and microbes readily acquire chromosomes under extreme laboratory selective pressure (Hughes et al. 2000; Selmecki et al. 2006; Rancati et al. 2008; Selmecki et al. 2009; Yona et al. 2012; Filteau et al. 2015; Sunshine et al. 2015; Beaupere et al. 2018; Gilchrist and Stelkens 2019; Yang et al. 2019; Todd and Selmecki 2020). Why aneuploidy is toxic in some situations yet common in others is a matter of active debate but may reflect mechanistic differences in how cells handle the stress of aneuploidy depending on developmental stage, cell type, or species.
An understudied consideration is the influence of genetic background on aneuploidy tolerance, even within the same species. Genetic differences in aneuploidy tolerance have been suggested in several systems, but its influence is perhaps most clear in humans and mouse models of Down syndrome (DS). DS, caused by trisomy of human chromosome 21, is associated with a wide range of phenotypes; however, many of these macro and molecular phenotypes vary considerably across individuals (Antonarakis and Epstein 2006). For example, although DS is associated with a 50-fold increase in congenital heart defects, only half of DS patients suffer from heart problems (Li et al. 2016). Transcriptomic and proteomic analysis of patient-derived cell lines showed considerable variation in expression across individuals (Prandini et al. 2007; Liu et al. 2017). Several functionally related mRNA/protein classes display universal responses to trisomy 21, whereas other functional processes vary across lines, revealing the genetic influence on cellular susceptibilities. Some of these differences may be encoded on the amplified chromosome, with profound influences on DS severity. A recent study of DS patient genomes identified a dearth of deleterious alleles on sampled chromosome 21, which was inferred to reflect survivor bias in tolerated variants (Popadin et al. 2018). However, the influence of broader genetic background effects has been less clear, as there has been no systematic study exploring aneuploidy tolerance across genotypes.
We recently showed that genetic differences between laboratory and wild strains of budding yeast Saccharomyces cerevisiae influence the tolerance of chromosome amplification. Laboratory strain W303 is highly sensitive to amplification of most of the 16 yeast chromosomes, showing extreme growth defects, metabolic limitations, transcriptome reorganization, cell-cycle defects, and proteostasis stress including protein aggregation and difficulties degrading misfolded proteins (Torres et al. 2007; Torres et al. 2010; Oromendia et al. 2012; Sheltzer et al. 2012; Thorburn et al. 2013; Dephoure et al. 2014; Dodgson et al. 2016; Brennan et al. 2019). However, natural aneuploid yeast strains studied to date do not show these phenotypes, and instead grow with more mild growth reduction, no evidence of the stress response, and little evidence of metabolic or proteostasis stress (Hose et al. 2015; Gasch et al. 2016). We recently mapped the difference in aneuploidy tolerance between W303 and wild strains to RNA binding protein Ssd1, which is defective in W303 (Hose et al. 2020). Indeed, deletion of SSD1 recapitulates aneuploid-W303 phenotypes in several genetic backgrounds with different chromosome amplifications, revealing a generalizable role for Ssd1 in tolerating chromosome duplication. Since then, work by Larrimore et al. showed that aneuploidy in a different laboratory strain derived from S288c, which expresses full-length Ssd1, produces no observable proteostasis defects reported to be a hallmark in aneuploid W303 (Larrimore et al. 2020).
A remaining question is whether there is natural variation, outside of aberrant laboratory strains, in aneuploidy tolerance. S. cerevisiae is an excellent model to explore this question. Several studies have documented aneuploidy in large-scale sequencing efforts, showing that chromosome imbalance is not uncommon and can be found associated with several ecological settings, especially clinical and industrial niches (Hose et al. 2015; Strope et al. 2015; van den Broek et al. 2015; Gallone et al. 2016; Zhu et al. 2016; Gorter de Vries et al. 2017; Duan et al. 2018; Fay et al. 2019). Peter et al. recently sequenced over 1,000 S. cerevisiae strains collected from diverse environments, including natural environments such as fruit and trees, yeast used in industries spanning beverage, bread, and biofuel production, and human-associated isolates from infections (Peter et al. 2018). Through phylogenetic analysis, they defined 26 genetic clades along with many other “mosaic” strains that show recent genetic admixture. That study also generated growth phenotypes for those strains growing in several different controlled conditions. Although not a focus of the study, a fifth of the sequenced strains harbor atypical aneuploid karyotypes. Here we explore patterns of aneuploidy and its phenotypic effects to understand how genotype and ecology influence aneuploidy prevalence and tolerance. Although intertwined with ecology, our results show that genetic background is a better predictor of differences in aneuploidy frequency and phenotypes. We discuss the evolutionary forces acting on aneuploidy in the species.
Methods
Strain analysis
Genotypes, clade classifications, and phenotypes were taken from Peter et al. (Peter et al. 2018) and recapitulated here in Table S1 for clarity. We confirmed all aneuploidy calls by comparing average read depth (calculated from 1-kb non-overlapping sliding windows) between chromosomes. In total, Peter et al. assigned genotype classifications to 962 strains (which included 150 strains designated as mosaic” admixed strains) and ecological associations for 984 strains. The European Wine clade and mosaic strains analyzed here included all subclades in each group identified by Peter et al. Natural strains in Figure 2 included flower, fruit, insect, nature, soil, and tree ecotypes, and industrial strains included bakery, beer, fermentation, palm wine, industrial, and bioethanol ecological groups.
Figure 2.

Aneuploidy prevalence varies by clade and ecological group. As shown in Figure 1C. Groups significantly enriched (orange) or depleted (sky blue) of aneuploid isolates compared to the frequency across all strains (grey box) are highlighted, and the number of strains in each group is indicated in parentheses. Asterisk indicates FDR < 0.05 for total gains or losses, and plus indicates p < 0.05 and FDR < 0.13. Black square indicates clades enriched for polyploids (FDR < 0.05). All groups with at least 8 strains are shown.
Strains were partitioned based on aneuploidy calls, according to whether they displayed gain of Chromosome I (Chr 1) only, loss of one or more chromosomes bigger than Chr 1 (Chr 2-16) without any gains (“loss only”), gain of one or more chromosomes bigger than Chr 1 without any losses (“gain only”), and strains that had gained and lost different chromosomes bigger than Chr 1 (“mixed gain and loss”). Enrichment for strains with aneuploidy was assessed by comparing to the total set of strains using Fisher’s exact test and Benjamini and Hochberg false discovery rate (FDR) correction, taking FDR < 0.05 as significant and FDRs that just missed the cutoff (as specified in each Figure legend) as marginally enriched. Only groups of at least 8 strains are represented in Figure 2. Results and trends were consistent when Chr 1 was included in the analysis.
Analyses defining lineages, their relationships and predictors of chromosome gain focused on a filtered set of 621 strains, as indicated in those sections. We removed from consideration: i) strains without aneuploidy information or genotype classifications by Peter et al., ii) 150 mosaic admixed strains defined by Peter et al., iii) strains that had been manipulated (i.e. in which the HO locus was deleted), (iv) strains that were monosporic derivatives (Strope et al. 2015) and therefore less likely to be aneuploid (Zhu et al. 2016), (v) strains that were haploid and therefore effectively had missing data for heterozygosity, and finally vi) 2 strains (CBS382 and CBS1593) that an initial maximum-likelihood tree showed were not in the clades assigned by Peter et al. (2018). We focused on strains that were either euploid or showed Chr 2-16 gain without any chromosome loss, and therefore omitted strains with chromosome loss or strains that only gained Chr 1. The 621 strains that remained were euploid (N = 520) or gained Chr 2-16 exclusively (N = 101).
Verification of aneuploidy calls and heterozygosity estimation
Reads were trimmed for all sequences from Peter et al. (2018) using Trimmomatic (version 0.33; Bolger et al. 2014) with default settings and read quality, and the efficacy of the trimming was assessed with FastQC (version 0.11.8; http://www.bioinformatics.babraham.ac.uk/projects/fastqc/). Trimmed reads were mapped to the S. cerevisiae reference genome (SacCer_Apr2011/sacCer3 from UCSC) with Burrows-Wheeler Aligner (bwa mem, version 0.7.17; Li and Durbin 2009). A consensus sequence was generated for each strain using SAMtools mpileup (version 1.6; Li et al. 2009) and BCFtools call -c (version 1.6; Li et al. 2009). Insertions and deletions relative to the reference were removed in the mpileup step (option -I) and a maximum read depth of 100,000 reads was allowed. Levels of heterozygosity were estimated from the resultant variant call format (vcf) files using vcf2allelePlot.pl with default parameters (Bensasson et al. 2019). Consensus genome sequences in fasta format were extracted from the vcf file of each strain using seqtk (available at https://github.com/lh3/seqtk), and for each strain consensus bases with a phred-scaled quality score below 40 were counted as missing data (converted to N). Because insertions and deletions were removed when mapping reads to the reference, all genome sequences are already mapped to the same coordinates as the reference sequence and there was therefore no need for a multiple alignment step. The data file generated is available at https://github.com/bensassonlab/data/tree/master/scopel_etal20/.
Inference of relationships among strains
To recapitulate clade designations of Peter et al. we constructed a maximum-likelihood tree using the filtered set of 621 strains described above. The alignments of all sixteen chromosomes were concatenated into a single 12,071,326 bp genome-wide alignment using alcat.pl (Bensasson et al. 2019), with 1,100,664 variable sites. From this alignment, a maximum-likelihood tree was inferred using IQ-TREE (version 1.6.5; Nguyen et al. 2018) with a general time reversible evolutionary model with unequal rates and unequal base frequencies, a discrete γ-distribution to estimate heterogeneity across sites (GTR+G), and 100 nonparametric bootstrap replicates. All clades and strain associations for these 621 strains defined by Peter et al. were confirmed.
Admixture graphs were estimated using TreeMix (version 1.13, Pickrell and Pritchard 2012) on the 621 strains using the parameters described in Fay et al. (2019). More specifically, SNPs were grouped in blocks of 500 SNPs for jackknife standard errors, and trees were rooted with the Taiwanese lineage. To estimate the number of migration events, we compared the log-likelihood from separate runs using between 0 and 10 migration events (Figure S2A). The best model invoked 8 migration events (P < 2 x 10−308), and 4 of these could be validated with three-population tests (f3) of admixture (Reich et al. 2009). Result files and the R script used are available at https://github.com/bensassonlab/data/tree/master/scopel_etal20/.
Predicting chromosome gain from clade, ecology, ploidy, and heterozygosity
To compare clade, ecological origin, ploidy and heterozygosity levels as predictors of chromosome gain, we considered them together in logistic regression models. In R (version 3.5.1), we used the generalized linear model (glm) function and binomial errors with Chr 2-16 gain (CG, true or false) as the response variable (Crawley 2012a). The initial model included 4 explanatory variables: clades (C, 26 levels), ecological origin (E, 23 levels from Peter et al), ploidy (P, diploid, polyploid) and heterozygosity (H, continuous). We simplified a maximal model (CG ∼ C*E*P*H) to minimal adequate models by applying chi-squared deletion tests, as recommended by (Crawley 2012a; Crawley 2012b), for analysis of data where variables are correlated. We ensured that all conclusions are not affected by the order of factor deletion, and we also compared the Akaike Information Criterion (AIC) estimator for our models using the summary glm function. The fullest models would not converge with all explanatory variables in a single model together with all their possible interactions. Instead, for the maximal model, we considered these 4 variables together with as many of their two-way interactions as possible (CG ∼ C + E + P + H + C:H + E:P + E:H + P:H); all except clade:ecology (C:E) and clade:ploidy (C:P) were included. None of the two-way interaction terms were statistically significant (P > 0.05) and are therefore not discussed in the Results. The R script and data table used for the logistic regression along with files for other analyses presented here are available at https://github.com/bensassonlab/data/tree/master/scopel_etal20/.
The potential non-additive effects of variables that are described by statistical interaction terms can be important for model interpretation. Because maximal models did not converge when three-way interaction terms were included above, we also predicted the gain of Chr 2-16 (CG, true or false) response from two additional models each with 3 explanatory variables: one for clade, heterozygosity and ploidy with all possible interactions (CG ∼ C*H*P) and a second model for ecology, heterozygosity and ploidy along with all possible interactions (CG ∼ E*H*P). We again simplified the models using the standard approach of chi-square tests to compare nested models with the anova function in R (Crawley 2012a). No two-way or three-way interactions were statistically significant (P > 0.05) and both models simplified the same way as in the logistic regression analysis described above.
Estimating the number of lineages with changed aneuploidy frequency
We define aneuploidy frequency (also referred to as propensity) as the fraction of strains in a given group that carry aneuploid karyotypes as defined in each section. To estimate the number of times that aneuploidy frequency has changed during the evolution of S. cerevisiae, we used genetic similarity among the 26 clades (tree topologies in Figure 6A) to decide a priori contrasts. More specifically, we compared each clade to the most genetically similar clade by applying a standard approach for contrasts: nested models and chi-square tests with the anova function (Crawley 2012b). Clades were merged if there was no significant difference between component clades in the frequency of Chr 2-16 gain, using a significance threshold of P = 0.05. Once all sister clades with similar aneuploidy frequency were merged, we tested whether our model was significantly worse when we replaced all clades that appeared to have an ancestral frequency of Chr 2-16 gain (i.e. clades not highlighted in Figure 6A) with a single group. Maximum-likelihood estimates of the mean probability of Chr 2-16 gain for each group were extracted from the minimal adequate model using the predict function in R.
Figure 6.

Ssd1 sequence variation does not contribute appreciably to aneuploidy tolerance. (A) Maximum-likelihood tree for the reduced set of 621 strains used for modeling (see Methods). Clades, Ssd1 allelic class (Class A, magenta edges; Class B, blue edges; A/B heterozygotes, green edges), and Chr 2-16 amplification without chromosome loss (black bars) is indicated. Strain groups with increased rates of chromosome amplification are indicated with grey boxes. Nodes with 100% bootstrap support are annotated with a grey circle. (B) Colony growth scores for aneuploid versus euploid mosaic diploid strains expressing AA, AB, or BB Ssd1 genotypes. Number of strains per group is indicated in parentheses. No group of aneuploids was different from euploids (P > 0.25 in all cases). (C) Average and standard deviations of relative growth rate of YPS1009_Chr12 ssd1Δ cells expressing empty vector (D), the YPS1009 Ssd1 allele (“Y”, Class B), S288c Ssd1 allele (“S”, Class A), or YPS1009 Ssd1 harboring S1990, A1196 substitutions (“YA”), compared to the growth rate of wild-type YPS1009_Chr12 harboring an empty vector (N = 3).
We controlled for the possibility that recent common ancestry of Chr 2-16 gains could inflate aneuploidy rates for some clades, by re-running the logistic regression analysis after excluding close relatives. To do this, we used the dnadist function of PHYLIP to estimate pairwise genetic distances for all 621 strains (version 3.697; Felsenstein 1989). Using a python script (removeSimilarStrains.py; https://github.com/bensassonlab/data/tree/master/scopel_etal20), we randomly chose a single strain from each group of very similar strains (pairwise genetic distance < 0.000007). The maximum-likelihood tree for the 453 strains that remained indicated successful removal of closely related strains with identical aneuploid karyotypes. In contrast, many of the remaining 31 polyploids clearly share a common polyploid ancestor (e.g. African Beer polyploids in Figure S1B). Logistic regression analysis of genetic clade, ecology, heterozygosity and ploidy showed two-way interactions involving ploidy (P = 0.01 to P = 0.05), suggesting that polyploidy might not increase aneuploidy rates in all genetic backgrounds or environments. Therefore, to test whether changes in aneuploidy prevalence arose multiple times, we excluded polyploids and repeated the logistic regression analysis on Chr 2-16 gain in 422 diploids, this time using the maximum-likelihood tree that excludes close relatives to determine a priori contrasts (Figure S1B).
Phenotype analysis
Phenotype scores included colony size after growth for defined periods in different laboratory environments (Peter et al. 2018) and sporulation measurements from (De Chiara et al. 2020). Colony sizes between aneuploid and euploid groups were compared using a Wilcoxon rank-sum test (implemented in R version 3.5.1 with a continuity correction) taking FDR < 0.05 as significant. To ensure that the European Wine sensitivity was not due to an unusually high aneuploidy burden in these sampled strains, we removed 4 outlier strains whose total genome content was greater than the largest sake genome (27.3 Mb), which is the aneuploid group with among the tightest distribution of genome contents. The median genome size of the remaining European Wine strains was not different from French Dairy, Sake, and Mosaic aneuploids; yet these European Wine aneuploids grew slower than euploids (P = 0.02) and showed fewer asci and more dyads (P < 0.01, one-sided Wilcoxon test). Where indicated, colony-size scores from cells grown in stress conditions were normalized to that strain’s colony-size score from rich YPD media, thereby representing the relative change in colony size in each stress. To score phenotypic benefits afforded by amplification of specific chromosomes (Figure 5B), FDR was calculated using only tests where the median aneuploid growth rate was equal to or better than the euploid growth rate.
Figure 5.

Amplification of specific chromosomes correlates with stress survival. (A) Distribution of growth rates in each stress condition normalized to strain-specific growth rates in rich medium for annotated clades and stresses. In all cases shown, normalized growth of aneuploid strains was significantly worse than the comparable euploids (FDR < 0.05, Wilcoxon test). (B) Distribution of growth rates as described in A for strains in which individual chromosomes were amplified (boxplots colored by chromosome, number of strains per analysis in parentheses under legend). All significant results are shown in which chromosomal amplification improves relative cell growth (FDR < 0.05, Wilcoxon test).
Ssd1 variation
For each strain, SSD1 forward DNA coding sequence was extracted from consensus genome sequences (see above) using faChooseSubseq.pl with the -r option to recover the correct strand (Bensasson et al. 2019). Aligned sequences (3,753 bp) revealed 153 variant sites. RAxML (version 8.2.11; Stamatakis 2014) was used to infer a maximum-likelihood tree with a general time reversible evolutionary model, a discrete γ-distribution to estimate heterogeneity across sites (GTRGAMMA), and 100 bootstrap replicates (seed -x 12345). Similar methods were applied to generate the Ssd1 protein tree.
To test if two common Ssd1 protein variants (allele classes A and B) were enriched among aneuploid strains that had amplified Chr 2-16 (without any losses), we did the following: We estimated clade-specific AA, AB, and BB genotype frequencies, based only on euploid strains in the datasets, and then used these frequencies to estimate the expected frequencies of the aneuploid group based on its clade proportions. Observed genotype frequencies were not different from expectation (P = 0.98, Chi-squared test).
Experimental methods
The SSD1 coding sequence plus 1,000 bp upstream and 337 bp downstream was cloned from YPS1009 or from S288c strain BY4741 into a low-copy CEN plasmid for complementation as previously described (Hose et al. 2020). Site-directed mutagenesis of the SSD1YPS1009 expressing plasmid was used to introduce the S1190G and A1196P substitutions into a YPS1009 backbone. All plasmids were sequence verified. Plasmids were transformed into wild-type and ssd1Δ aneuploids of the haploid YPS1009_Chr12 and NCYC110_Chr8 backgrounds (each disomic for the affected chromosome), aneuploidy was verified by qPCR as previously described (Hose et al. 2020), and growth rates in rich medium were measured in biological triplicate. Data in Figure 6C show the relative growth rates of ssd1Δ aneuploid strains transformed with each plasmid relative to the wild-type aneuploid transformed with the empty vector.
Data availability
Strains and plasmids are available upon request. Data, tree, and script files are available at https://github.com/bensassonlab/data/tree/master/scopel_etal20/. The authors affirm that all data necessary for confirming the conclusions of the article are present within the article, Figures, and tables or previously published. Supplemental Material available at figshare: https://doi.org/10.25386/genetics.13635050.
Results
We began by investigating the levels and types of chromosomal aneuploidies in 1,011 strains sequenced by Peter et al. (Peter et al. 2018). Of the 217 (21%) aneuploid strains, 26 were reported to show only chromosomal loss, whereas 191 strains amplified one or more of the 16 yeast chromosomes, a third of which gained two or more chromosomes. Of these 191 strains, over 80% were diploid or higher ploidy with one extra copy of the affected chromosomes. Chromosome I (Chr 1), both the smallest and carrying the fewest genes, was the most frequently gained, in 60 (27.6%) aneuploid strains. It was also the most frequently lost (14/217, 6.5%). The higher frequency could be due to increased rate of segregation errors; however, given its small size and low gene count this chromosome is least likely to incur large fitness defects when amplified. Consistent with this notion, we confirmed the result of Peter et al. that the frequency of chromosome amplification is negatively correlated with chromosome size and the covarying gene content (R2 = 0.38, Figure 1A), and in general smaller chromosomes were more often duplicated than larger chromosomes. This trend is reminiscence of the size-specific differences in fitness costs of chromosome amplification, measured across many backgrounds (Hose et al. 2015) and in a single laboratory strain in which most of the individual chromosomes have been duplicated (Torres et al. 2007; Gilchrist and Stelkens 2019). Interestingly, there was an even stronger negative correlation for the rate of chromosome loss and chromosome gene content (R2 = 0.53, Figure 1B). Together, these results are consistent with the model that substantial alteration in chromosome/gene content is generally selected against in S. cerevisiae, with smaller chromosomes likely to incur smaller fitness costs, contributing to their higher rate of detection in yeast populations. However, the relationship was not perfect. The second most commonly amplified chromosome in the 1,011 strains is Chr 9 (53 strains), the 4th smallest chromosome previously observed to amplify frequently in clinical isolates (Zhu et al. 2016), followed by Chr 8, 11, and 3 (24-28 strains each); although the frequency of aneuploidy did not correlate perfectly with size, all of these chromosomes are smaller than the median chromosome length.
Figure 1.

Frequency of gain and loss correlates with chromosome gene content. The number of strains that had gained (A) or lost (B) each chromosome (regardless of other chromosome patterns in that strain) is plotted against the number of genes on that chromosome. The percent variance explained is shown as the R2 of the linear fit. Chromosome size (which covaries with gene content) is depicted in Figure 3. (C) The proportion of strains from each ploidy (N) group that had gained or lost chromosomes larger than Chr 1 (Chr 2-16). Dark colored bars indicate strains with only chromosome gain or loss; light colored bars indicate strains with both gain and loss and were counted in both the gain and loss categories. The number of strains per ploidy group is listed in parentheses. Frequencies beyond chance were based on total values above or below the line and are highlighted in orange (asterisk, FDR < 0.05).
Whole-genome duplication precedes chromosome instability in cancer cells, giving rise to highly aberrant karyotypes (Storchova and Pellman 2004; Storchova 2014). The same forces may occur in yeast. We expanded on previous observations that aneuploidy is more common in polyploids (Mayer and Aguilera 1990; Storchova 2014; Zhu et al. 2016; Duan et al. 2018; Gilchrist and Stelkens 2019) with additional resolution. Because amplifications and losses may be subject to different selective pressures, we analyzed separately strains that showed only chromosome loss, those that gained only Chr 1 that carries the fewest genes and is subject to few fitness costs (Torres et al. 2007), and strains that amplified chromosomes larger than Chr 1 (Chr 2-16), with or without other chromosome losses. As ploidy increases, aneuploidy frequency increases, for both chromosome gains and losses (Figure 1C). Interestingly, haploid gains of Chr 2-16 were only slightly less prevalent (11%) than in diploids (14%; Fisher’s exact test, P = 0.4), but triploids had over double the frequency of Chr 2-16 gain (30%, Fisher’s exact test, P = 0.005). The frequency of chromosome loss (exclusive of or including other gains) is increasingly prevalent as ploidy increases, and aneuploidy becomes especially common in tetraploids and pentaploids (Figure 1C). This may arise from a higher rate of chromosome missegregation as ploidy increases (Storchova et al. 2006; Marco et al. 2013), but it could also be more tolerated due to less imbalance resulting from single-chromosome alteration at increasing ploidy levels.
We also noticed that aneuploid strains were more heterozygous than others. Even when controlling for ploidy effects by examining only diploids, cells with any type of aneuploidy were more heterozygous (median 0.05%, N = 145) than euploids (median 0.04%, N = 642; Wilcoxon test, P = 0.0002). More specifically, heterozygosity was elevated for strains that exclusively gained Chr 2-16 (median 0.05%, N = 108; Wilcoxon test, P = 0.0001), although the higher heterozygosity was not significant for the few strains that exclusively lost Chr 2-16 (median 0.08%, N = 10; Wilcoxon test, P = 0.3). In subsequent analyses, we therefore consider the effects of ploidy and heterozygosity alongside those of genetic lineage and ecological origin.
Aneuploidy frequency varies across lineages and ecological groups
Peter et al. identified 26 distinct lineages or genetic clades (which we recapitulated using a genome-wide maximum-likelihood tree, see Figure 6A), along with additional strains showing recent genetic admixture between these groups. One question is if different lineages show different propensities for aneuploidy. We therefore scored the frequency of aneuploidy by lineage as defined by Peter et al, again distinguishing between gains only, losses only, or gains with losses of Chr 2-16 (Figure 2). As previously noted (Gallone et al. 2016; Peter et al. 2018; Fay et al. 2019), strains in the Ale, Sake, and Mixed Origin lineages display high rates of chromosome amplification, with 40-50% of individuals carrying extra copies of chromosomes larger than Chr 1 (p < 0.008, Fisher’s exact test). In contrast, the European Wine clade was significantly under-represented for strains with extra chromosomes. In addition to gains, African Beer, Ale and Mixed Origin clades also showed a prevalence for chromosome loss, in the context of other amplifications (p < 4x10⁻⁷, Fisher’s exact test) or in strains that showed only loss (Figure 2). All three clades are also enriched for polyploids.
There were also several striking differences when strains were grouped instead by ecology. As expected based on previous studies (Gallone et al. 2016; Gorter de Vries et al. 2017; Kadowaki et al. 2017; Peter et al. 2018), strains used in some industries (including beer, bread, and sake but not wine or biofuel production) showed elevated rates of chromosome amplification. In contrast, strains isolated from nature, notably those from soil or all natural ecologies combined (Figure 2), were significantly depleted of aneuploids compared to the total set of 1,011 strains. However, a major challenge with this interpretation is that some ecologies are tightly associated with genetic lineage. For example, sake-making strains form a distinct genetic clade, as do ale strains that emerged from hybridization between Asian and European strains (Fay et al. 2019). In this dataset, natural strains are heavily enriched for the European Wine lineage, itself underrepresented for aneuploids. Understanding how environment affects aneuploidy prevalence thus requires methods that disentangle genotype from ecology.
Genetic background alone can predict differences in aneuploidy prevalence
Differences in aneuploidy prevalence could result from the direct action of ecological selection, or it could arise due to inherent differences in aneuploidy generation or tolerance according to genetic background. If ecology directly affects the prevalence of aneuploids, then it should improve predictions of aneuploidy frequencies when considered alongside other factors. Such an analysis is complicated by the co-variation of ploidy, heterozygosity, clade, and ecology, which confounds the forces driving aneuploidy frequency. For example, strains from the Mixed Origin clade are more likely to be aneuploid (P = 1x10⁻⁹, Fisher’s exact test), but they are also more often polyploid (P = 6x10⁻¹⁴, Fisher’s exact test) and more heterozygous (P < 2x10⁻¹⁶, Wilcoxon test) than other clades. Furthermore, many of these are bakery or clinical strains for which there is a known association between ploidy and aneuploidy (Zhu et al. 2016).
To begin to disentangle factors that influence aneuploidy prevalence, we performed a logistic regression that included clade designation, ecological source, ploidy, and heterozygosity to predict the frequency of Chr 2-16 gain (in the absence of chromosome loss for clarity of interpretation). When simplifying a maximal model that included all variables (clade, ecology, ploidy, heterozygosity) and most two-way interactions (except clade:ecology and clade:ploidy, see Methods), we found no effect of ploidy beyond what was explained by other factors (d.f. = 1, P > 0.1). Because clade and ecology covary, model simplification produced two different minimal adequate models depending on the order of deletion. These two models were not significantly worse than any more complicated models (see Methods). (i) The first model predicted differences in Chr 2-16 gain (CG) using only genetic clade (C), and the model revealed major differences among genetic clades (CG ∼ C; 17.9% of deviance, df = 25, P = 9x10⁻¹¹). (ii) The second model (CG ∼ E + H) predicted the probability of aneuploidy from ecological source (E; 14.8% of deviance, df = 22, P = 1x10⁻⁸) and heterozygosity (H; 1.8% of deviance, df = 1, P = 0.002). Clade explains a larger fraction of the differences (deviance) in chromosome gain in the first model than ecology does in the second model. Furthermore, the second model must also include heterozygosity for explanatory power, which covaries with genetic clade and may act with ecology as a surrogate for clade. The association between the prevalence of chromosome gain and genetic background is not an artifact of clonal expansion of aneuploid strains: we repeated the analysis after removing strains that were closely related to others in the dataset (see Methods), and still see differences in the prevalence of Chr 2-16 gains among genetic clades of S. cerevisiae (Figure S1). Together, these data suggest genetic clade is a better predictor of the differences in chromosome gain than ecology (see Discussion).
Aneuploidy prevalence increased multiple times in S. cerevisiae evolution
If genetic clade is the best predictor of aneuploidy prevalence, then could changes in aneuploidy prevalence have arisen multiple times? To investigate this, we considered the relationships among the genetic clades in the context of the tree topology in Figure 6A. If a single event gave rise to clades with higher aneuploidy prevalence, then high-aneuploidy groups should have a recent common ancestor. If on the other hand high-aneuploidy lineages are not closely related or influenced by admixture, it suggests that aneuploidy prevalence evolved through multiple events.
We used nested models to investigate if a reduced number of related lineages (from 26 clades used in the initial model above) could explain differences in aneuploidy frequency (see Methods). For example, the Alpechin clade is most closely related to the European Wine clade (Figure 6A) and also shows similar aneuploidy frequency across strains (d.f. = 1, P = 0.3); these clades can therefore be combined into a single group with a shared predicted probability of chromosome gain (PChr2-16). In contrast, Sake and Asian Fermentation clades are sister clades but differ in the prevalence of chromosome gain (d.f. = 1, P = 6x10⁻⁷), so the propensity for aneuploidy must have changed during the divergence of these lineages—these clades are therefore retained as separate groups with different values of PChr2-16. In this way, collapsing clade groupings led to a simpler model that required only 5 genetic groups, including 4 groups capturing 6 high-aneuploidy clades and a fifth group of clades with the same ancestral aneuploidy prevalence (the “ancestral frequency” group, PChr2-16 = 0.09). The 4 groups suggest independent events, discussed in more detail below, along the lineages leading to (i) Sake (PChr2-16 = 0.59), (ii) French Dairy and African Beer (PChr2-16 = 0.27), (iii) Ale beer and Mixed Origin (PChr2-16 = 0.39), and (iv) Mosaic Beer (PChr2-16 = 0.38) clades. This minimal adequate model with only 5 parameters predicts differences in PChr2-16 almost as well as the model with 26 clades (14.7% of deviance, AIC = 480.33 versus 17.9% of deviance, AIC = 504.54) without being significantly worse (-3.2% of deviance, d.f. = 21, P = 0.7).
Although this analysis excluded strains with recent genetic admixture (Peter et al. 2018; see Methods), there is evidence for more ancient admixture from Sake to the Ale lineage (Fay et al. 2019), raising the possibility that gene flow from Sake strains explains the higher rates in other groups. To assess, we used the method TreeMix to infer migration events (Figure S2). As expected, the method detected ancient admixture between Asian strains and the ancestor of modern-day Ale strains (Fay et al. 2019). The results also suggested the possibility of separate gene flow events from Asian strains to Mixed Origin and Mosaic Beer lineages; however, there was no admixture detected between other high aneuploidy groups including French Dairy and African Beer lineages (which are distinct groups in the TreeMix graph). Thus, this genome-wide allele frequency analysis suggests that multiple events in the species gave rise to high-aneuploidy lineages in S. cerevisiae (Figure S2). Even if gene flow from Sake-like ancestors influenced the spread of high-aneuploidy frequencies, the most likely explanation is not simple: it implies transmission through three separate gene flow events that would have occurred before the split of the high-aneuploidy Sake strains from low-aneuploidy Asian fermentation strains (Figure S2B-C), requiring subsequent reversion to lower frequencies in Asian fermentation strains.
Together, our results suggest that the ancestral state is a lower probability of aneuploidy at ∼9%, similar to that seen for the European Wine lineage, and that higher propensity for aneuploidy is not due to clonal expansion but rather emerged in the species through multiple discrete events that could include ancient gene flow (see Discussion).
Forces influencing aneuploidy occurrence
The differences in aneuploidy prevalence across clades could emerge for several reasons, including differences in aneuploidy generation through segregation errors and differences in selection that cull or enrich aneuploids. Amplification of specific chromosomes has been proposed to benefit industrial strains, and aneuploidy could have been selected for during domestication of niche-associated clades. On the other hand, selective pressures may vary considerably in different ecologies (including those tightly associated with clades), such that relaxed purifying selection explains differences in prevalence. Rapid growth, meiosis, and competition in highly diverse mixed communities are likely less important in managed industrial processes, and thus selection against detrimental chromosome gains may be relaxed. But a third possibility is that different genetic lineages may have acquired inherently different abilities to tolerate chromosome amplification, such that fitness costs differ among lineages. Below we combine genetic and phenotypic analysis to address these possibilities.
No evidence for selection of specific chromosome amplifications in industrial strains
As highlighted above, ale and sake producing strains as well as those linked to baking and beer production are enriched for chromosome gain. It has been proposed that amplification of specific chromosomes has been selected for, presumably due to up-regulated production of gene products enhancing desirable traits (Gorter de Vries et al. 2017; Kadowaki et al. 2017). This hypothesis posits that strains associated with different industries should be enriched for specific aneuploid karyotypes. To test this, we scored the frequency of each chromosome amplification compared to what was expected by chance (based on the total set of observed aneuploids in this dataset). In most cases we found that lineages with a high propensity for chromosomal aneuploidy did not share amplification of the same chromosomes (Figure 3). For example, although over 50% of strains in the Ale lineage carried extra chromosomes, there was no enrichment for any single chromosome in the group. Ale strains were also enriched for chromosome loss compared to other strains (P = 1x10⁻¹⁰, Fisher’s exact test); however, which chromosome(s) were lost also varied by strain.
Figure 3.
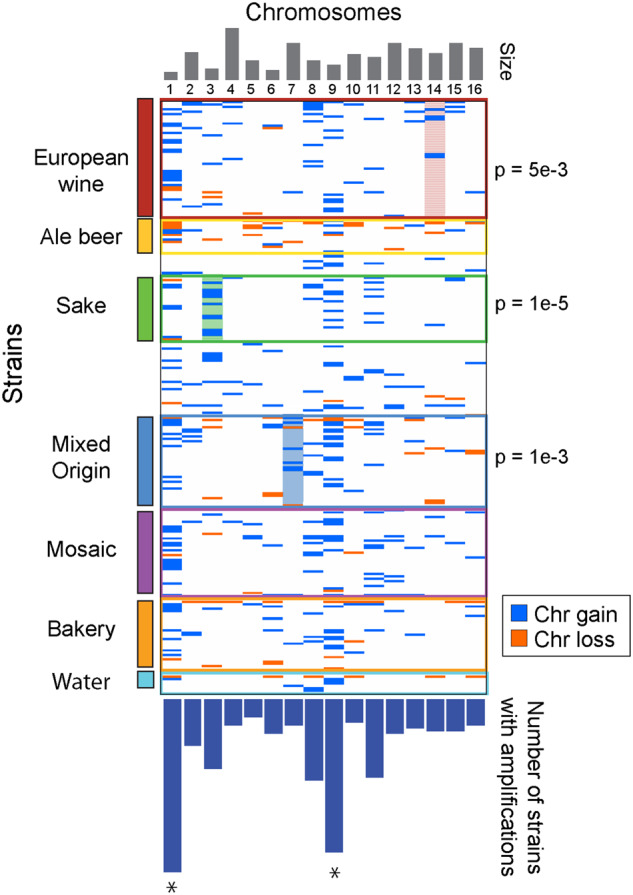
Most clades are not associated with specific karyotypes. The Figure shows gain (blue lines) or loss (orange lines) of each chromosome (columns) in aneuploid strains (rows) belonging to each clade or select ecology groups. Not all ecologies are shown in the Figure. Clades with significant enrichment for particular chromosomes are highlighted with p-value of the enrichment shown to the right. The top panel represents chromosome size and the bottom panel represents the fraction of all strains in the analysis in which each chromosome was amplified. Chromosomes enriched overall at a higher rate than expected are indicated with an asterisk (FDR < 0.002)
Somewhat surprisingly, a similar situation is seen for sake-producing strains, one of the few cases in which amplification of a specific chromosome is known to contribute desirable flavor characteristics. High pyruvate levels lead to off flavors in sake, and thus low pyruvate production is thought to have been selected for in modern-day sake-producing strains (Horie et al. 2010; Agrimi et al. 2014). Kadowaki et al. showed that sake strain TCR7 carrying an extra Chr 11 out-performed euploid variants of the same genotype (Kadowaki et al. 2017). We found that although a fifth of the aneuploid sake strains sequenced by Peter et al. carried extra Chr 11, there was no enrichment above expectation, based on the distribution of Chr 11 amplification across all strains. Instead, we found enrichment for Chr 3 gain, which was often found with other aneuploidies (Figure 3). The removal of closely related strains (Figure S1) and consideration of karyotypes in the context of close relatives (Figure S3) suggest that Chr 3 and 11 amplifications are not solely due to clonal expansion of the same strain. These results disfavor the model that high aneuploidy levels are due to fixation of specific chromosome amplifications. Instead, it suggests that Sake strains have a higher rate of segregation errors, a higher tolerance of karyotype imbalance, or both (see below and Discussion).
Phenotypic variation points to underlying differences in aneuploidy tolerance
Wild aneuploids studied to date are not nearly as sensitive to chromosome gain as laboratory strain W303, based on growth rate differences compared to their euploid cousins (Hose et al. 2015; Gasch et al. 2016; Hose et al. 2020). Nonetheless, a remaining explanation for differences in aneuploidy frequency is that wild strains still vary (albeit less so than compared to W303) in their ability to handle extra chromosomes. We reasoned that growth phenotypes of euploid and aneuploid strains within each clade may provide clues. Peter et al. measured colony size as a proxy for growth rate for 1,011 strains grown in 36 conditions, including rich medium without added drugs or stresses. Although they reported a slight but statistically significant fitness defect across aneuploids pooled across all conditions (and regardless of gain/loss type), we sought to look in more detail. We again considered separately strains with only chromosome loss, only Chr 1 amplification, or amplification of Chr 2-16 (here, regardless of other losses). We started by analyzing growth in rich medium, which is among the most optimal conditions for yeast growth, to assess if observed aneuploids show any defect in growth. One caveat of this analysis is that observed aneuploids could have adapted to handle the extra chromosomes; although this may be true in some cases, we sought common trends that might provide insights into lineage-specific effects.
Surprisingly, when strains were partitioned based on aneuploidy type, we saw no significant or major growth-rate defect in rich medium among strains that had amplified one or more chromosomes (Figure 4A). We did, however, observe a significant reduction in colony growth for strains with exclusive loss (p = 0.005, Wilcoxon test, Figure 4A). This group of 22 strains was heavily enriched for polyploids (P = 4x10⁻⁸, Fisher’s exact test), raising the possibility that reduced growth was due to ploidy burden. However, increased ploidy in otherwise euploid strains did not significantly affect growth rate compared to diploid euploids (Figure 4A). As mentioned above, strains that lost chromosomes were enriched for Ale, African Beer, and Mixed Origin isolates, suggesting that genetic background could be a confounding factor. In fact, Ale strains that had lost chromosomes were especially slow growing compared to euploids of the same clade (Figure 4B); however, the sensitivity may be due to the fact that most in this group are polyploid and Ale strains are particularly slow growing with higher ploidy.
Figure 4.

Aneuploidy presents different fitness consequences depending on strain background. (A) Distribution of colony growth scores for euploid strains and strains with only Chr 1 gain, Chr 2-16 gain, or only chromosome loss according to the key. The plot also shows the distribution of fitness scores for all euploids that are haploid (1 N), diploid (2 N), or greater than diploid ploidy. Colored boxes represent strains with Chr 2-16 gain. (B) Distribution of colony growth scores as in A but for specific clades, showing all clades with > 5 aneuploids. (C) Average and standard deviation of growth rates for cultures in liquid rich medium as measured in (Hose et al. 2015). (D) Percent cells that form asci (left) or incomplete tetrads (dyads, right) after 72 h in sporulation medium, for delineated clades. Groups that are statistically significantly different from the paired euploid groups are indicated with an asterisk (FDR < 0.05, Wilcoxon test) or plus (p < 0.07 Wilcoxon test or T-test in C). ‘Anc’ indicates all strains excluding European Wine strains with an ancestral aneuploidy frequency (namely, those outside the French Dairy, African Beer, Mixed Origin, Ale, and Sake groups that have high rates of aneuploidy according to the logistic model).
The lack of growth defect in strains with chromosome amplification was somewhat surprising (Figure 4A). One possibility is that aggregating strains with different lineage-specifics growth rates obscures the effects of chromosome amplification. We therefore scored differences in colony growth in rich medium for individual clades that had at least five aneuploid strains (Figure 4B). Even when analyzed by clade, most groups did not show significant defects in this assay upon chromosome amplification. These included strains in the French Dairy, Mixed Origin, Ale and Sake clades, for which the aneuploid growth rates were not significantly different from euploids, considering only rich medium (Figure 4B) or all traits combined (Supplementary Figure S4). In fact, sake strains with extra chromosomes displayed slightly larger colony sizes compared to euploids in that clade (P = 0.07, FDR = 12%). To confirm, we analyzed liquid growth rates measured for several individual strains, which grew equally well and in one case slightly better than euploid sake strains (Figure 4C; Hose et al. 2015). Even when fitness scores were combined across all conditions, aneuploid sake strains showed no growth defect compared to euploid cousins (Supplementary Figure S4). Although measuring liquid growth rates may reveal more subtle defects, these results reveal the absence of major defects in the strains analyzed here.
In contrast, European Wine aneuploid strains showed reduced growth rates in rich medium compared to euploids, a trend that persisted across different drug conditions (FDR < 0.05, Supplementary Figure S4 and 5A). Importantly, this sensitivity cannot be explained by differences in aneuploidy burden of the analyzed European Wine strains: first, there was no correlation between growth rate and change in gene content across this aneuploid group (P = 0.85), and second, even after removing a few outlier strains with many chromosome amplifications, the European Wine aneuploids still fared significantly worse than euploids (see Methods). Mosaic strains and strains from the African Beer group showed slightly reduced growth rates that were statistically significant when fitness traits were pooled over all conditions (FDR < 0.05, supplemental Supplementary Figure S4). Interestingly, strains in the ancestral aneuploidy frequency group defined above but excluding European Wine strains show no statistically significant defect upon chromosome amplification, in rich media or when all conditions were combined (Figure 4 and S4). Thus, chromosome amplification has different associations with growth rate depending on genetic background, with most clades showing no major defect in sampled aneuploids.
In nature, the ability to sporulate and outcross is important both for surviving extreme periods of starvation and stress as well as to exchange genetic material. A recent study by De Chiara et al. characterized many of these sequenced strains for life history traits including the ability to form viable spores (asci) (De Chiara et al. 2020). Domesticated strains are often poor sporulators with low spore viability, proposed to result from defects segregating aneuploid chromosomes combined with a high frequency of deleterious heterozygous alleles (Gallone et al. 2016; Duan et al. 2018; De Chiara et al. 2020). To test if aneuploidy is associated with poor sporulation performance, we scored each clade for the propensity to form viable tetrad spores (asci) versus incomplete dyads after 72 hours in sporulation media.
Surprisingly, both the ability to sporulate and the interference associated with chromosome amplification appears clade specific. Euploid European Wine strains were among the best sporulators compared to other clades analyzed here. However, those that had amplified chromosomes bigger than Chr 1 showed a clear defect in sporulation, as most cells formed only dyads after 72 h (Figure 4D, FDR < 0.05). Defects in European Wine sporulation rate and tetrad completion (i.e. dyad rate) remained or became significant after strains with outlier gene content were removed (P < 0.01, one-sided Wilcoxon test, see Methods). Aneuploids in the Mixed Origin clade also showed a defect in asci formation compared to euploids, but no difference in dyad rate. In contrast, aneuploids in other strain groups showed no sporulation defect over euploids (FDR > 0.05). Although French Dairy and Sake strains were poor sporulators overall, extra chromosomes did not further hinder spore formation, showing that the relatively poor sporulation abilities are not caused by aneuploidy. Together, these results suggest that both the ability to sporulate and the ability to handle extra chromosomes during meiosis are influenced by clade-specific effects.
Amplification of specific chromosomes produces passive fitness benefits
Even if having extra chromosomes is deleterious in optimal conditions, myriad studies show that aneuploidy can rapidly emerge during strong selective pressure and can present adaptive benefits (Tsai and Nelliat 2019). We found no environments in which generalized aneuploidy (i.e. pooled across chromosomes) was associated with improved growth; however, there were several cases where chromosome amplification exacerbated stress sensitivity, most notably for European Wine and African Beer strains grown in different environments (Figure 5A).
We next investigated phenotypic consequences of amplifying specific chromosomes independent of lineage. To control for differences in strain-specific growth rates, we normalized each strain’s stress-responsive growth to its growth in rich medium, and then assessed phenotypic gains specific to the amplification of each of the 16 yeast chromosomes. There were several important relationships (FDR < 0.05, Wilcoxon test, Figure 5B). Strains with extra Chr 16 were associated with improved growth on arsenite, strains with extra Chr 7 grew relatively better on anisomysin and 6-azauracil (the latter also associated with amplification of Chr 3), whereas the strains that amplified Chr 2 showed improved growth on several drugs. It is tempting to speculate which genes on these chromosomes contribute to the phenotypes. For example, Chr 16 carries ARR1, the arsenite-binding transcription factor that up-regulates defense genes including Arr3 arsenite antiporter that is also encoded on Chr 16 (Wysocki et al. 1997; Wysocki et al. 2004). Chr 7 carries two genes whose over-expression underlies tolerance to the 6-azauracil that perturbs pyrimidine biosynthesis, including pyrimidine nucleotidase SDT1 and multidrug resistance gene SNG1 (Shimoaraiso et al. 2000; García-López et al. 2010). Chr 2, which was associated with better growth on benomyl, cycloheximide, and antifungal drug fluconazole, carries the genes encoding multidrug resistance transcription factor Pdr3 and efflux pump Flr1 that gives resistance to benomyl, fluconazole, and other drugs (Broco et al. 1999). Verifying which genes are responsible will require specific interrogation; nonetheless, these results show that amplification of specific chromosomes can provide fitness benefits. It is interesting to note that the affected strains shown here come from very different ecologies and lineages, and thus it is unlikely that these phenotypic benefits were selected for (at least, via the same selective pressures). It instead more likely highlights the passive benefits that can arise from chromosome amplification, even in the face of a fitness cost to growth under optimal conditions in some lineages.
Sequence variation in full-length SSD1 does not influence aneuploidy tolerance
The extreme sensitivity of laboratory strain W303 is primarily due to a premature stop codon in the SSD1 gene that ablates 40% of this RNA binding protein (Uesono et al. 1994; Uesono et al. 1997; Hose et al. 2020). Although uncommon, seven strains sequenced by Peter et al. reportedly carry premature stop codons (three of the ssd1w303 allele), raising the possibility that extreme sensitivity to aneuploidy segregates in nature. But beyond disease alleles, it is not known if Ssd1 sequence variation contributes to aneuploidy phenotypes or frequency. We therefore analyzed Ssd1 alleles across the 1,011 strains and their association with aneuploidy phenotypes.
Nearly a third of the strains share identical Ssd1 protein sequence, which is found in many vineyard strains as well as in lab strain S288c. The remaining protein variants differed from one another by a small number of largely private substitutions. However, both the protein tree and DNA tree revealed two major allelic classes, differentiated by two linked nonsynonymous substitutions. Allelic Class A sequence (SDNKQNA) is ancestral in S. paradoxus and S. uvarum (Cherry 2015) and encoded in two thirds of the strains. The remaining strains carried the derived Class B substitutions (GDNKQNP) at those positions. There was no association between Ssd1 protein class and clades with different aneuploidy frequencies (Figure 6A). Interestingly, Chinese strains from primeval forest, which are diverged from most other S. cerevisiae lineages (Wang et al. 2012; Bing et al. 2014; Peter et al. 2018), harbor both A and B alleles as well as an intermediate A/B sequence (GDNKQNA), suggesting that the B variant is anciently derived.
Several clades enriched for chromosome amplifications express Ssd1 B variants, including the Sake clade and Mixed Origin group (which is enriched for AB heterozygotes); but other aneuploid groups such as the French Dairy and African Beer were largely homozygous for the AA alleles, as was the European Wine clade (Figure 6A). That both alleles were prevalent in aneuploidy-enriched clades already disfavored a generalizable role for these Ssd1 allele classes in aneuploidy tolerance. Nonetheless, we took two approaches to assess if allelic differences were associated with aneuploidy phenotypes. First, we reasoned that if Ssd1 protein variants contributed to differences in aneuploidy tolerance, there may be a bias in allele frequency among aneuploidy strains. However, this was not the case. There was no difference in AA, AB, and BB genotype frequencies for aneuploids with Chr 2-16 gains compared to the frequency expected based on clade proportions of the group (P = 0.98, Chi-squared test, see Methods). Furthermore, there was no difference in genotype frequencies in aneuploids versus euploids in the mosaic strain group (P = 0.2, Chi-squared test).
Second, we assessed phenotypic impacts of aneuploidy in mosaic strains with different alleles. If the Ssd1 B allele contributes to aneuploidy tolerance, then strains within B variants should have milder defects than strains that express A variants. Yet in all cases the mosaic aneuploids were within the euploid growth distributions, independent of Ssd1 allele class (Figure 6B). Together, these results do not support a model in which the major allele classes of Ssd1 contribute to aneuploidy tolerance.
Finally, we tested experimentally the ability of A versus B variants to complement aneuploidy tolerance in an SSD1 deletion strain. Deletion of SSD1 causes a major defect in the growth rate of North American oak strain YPS1009 with an extra copy of Chr 12 and in unrelated West African strain NCYC110 with a duplication of Chr 8, compared to their respective SSD1+ wild-type aneuploid parents (Figure 6C). We found that introducing the YPS1009 B allele fully complemented SSD1 deletion in YPS1009 and largely complemented the defect in NCYC110 (which naturally expresses a B variant). Importantly, the level of complementation was indistinguishable when S288c Class A allele was expressed, or when G1190, P1196 residues were substituted to S1190 and A1196 to mimic the A variant in a YPS1009 backbone. Thus, Ssd1 variants in the A versus B classes have no discernable effect on aneuploidy tolerance.
Discussion
Aneuploidy has played an important role in disease biology and human health as well as natural variation and evolution. An unanswered question had been the importance of genetic background in tolerating chromosomal aneuploidy, particularly the burden of chromosome amplification. Here we leveraged yeast population genomics to reflect on the forces influencing eukaryotic aneuploidy. The availability of S. cerevisiae genomes, phenotypes collected across environments, and strong population structure that distinguishes genetic groups provide a rich resource to address this problem. Our results shed important light on aneuploidy prevalence and tolerance in yeast that likely pertains to other organisms.
Collectively, our results reveal that genetic background alone is a better predictor of aneuploidy prevalence in S. cerevisiae populations than is ecological source. The close association between strain ecological source, ploidy, heterozygosity, and genetic background has confounded analysis of their contributions to differences in aneuploidy prevalence. For example, karyotype imbalance is more frequent as ploidy increases (Figure 1C and (Storchova 2014; Zhu et al. 2016; Duan et al. 2018; Gilchrist and Stelkens 2019)), consistent with models from cancer cells (Storchova and Pellman 2004), but interpreting this result is complicated in S. cerevisiae by the association between ploidy and genetic clade (Figure 2). Modeling aneuploidy prevalence to decouple these factors revealed little power for ecology, ploidy, or heterozygosity beyond the explanatory power of genetic background. Our analysis predicts that increases in aneuploidy prevalence occurred multiple times in the history of the species and is associated with domesticated clades. Ancient admixture between the progenitors of Sake and Ale beer strains (Fay et al. 2019) could have contributed to high aneuploidy in some but not all high-aneuploidy lineages. This would most likely have involved multiple admixture events, and their timing suggests that the high-aneuploidy trait rose to high frequency in populations multiple times (Supplementary Figure S2). We found no evidence for selection of specific karyotypes, although the variability in industrial conditions could lead to selection of locally adapted strains (e.g. Chr 5 amplification has been repeatedly observed in repitched Ale fermentations from West coast breweries (Large et al. 2020)). An alternate explanation is that relaxed purifying selection in industrial settings could have had an important role. It is interesting to note that clades that lost efficient sporulation are often enriched for aneuploid variants (Figure 4D), which could indicate that meiosis helps to purge cells with karyotype imbalance. Survival in some niches (including natural environments) likely requires meiosis and mitosis, subjecting cells to additional purifying selection compared to managed domesticated environments that do not require sex. Thus, although genetic clade best explains variation in aneuploidy rates, the result could be coupled to domestication of those lineages.
Although our models have predictive power, they explain less than 18% of the variation in aneuploidy occurrence. One possibility is that other features, including strain-specific adaptation to aneuploidy, contribute to differences in its prevalence. But another is that aneuploidy is only slightly deleterious in the species, such that extra chromosomes appear stochastically at observable rates. The association between chromosome size/gene content and rates of chromosome imbalance (Figure 1) are consistent with a generally deleterious effect of karyotype imbalance (Gilchrist and Stelkens 2019; Tsai and Nelliat 2019). However, the effect in most strains may be far less deleterious than in the highly sensitized W303 laboratory strain. Thus, aneuploids resulting from periodic segregation defects may persist in the population for appreciable times and could enable lineages to survive stressful environments long enough to adapt through long-term mechanisms (Yona et al. 2012).
Clade-specific differences in the ability to handle aneuploidy stress may also contribute to differences in aneuploidy frequency. Remarkably, most clades did not show major fitness defects upon chromosome amplification, at least based on the data and isolates studied here. This was most clear for strains in the Sake clade. Aneuploid Sake strains showed no major growth defect compared to euploid strains, based on colony sizes measured by Peter et al. or liquid growth rates measured in our lab for several individual strains ((Hose et al. 2015), Figure 4). We propose that the Sake genetic lineage may be inherently tolerant of karyotype imbalance, which may explain the higher rate of aneuploidy in this clade. In fact, numerous lines of evidence suggest that these strains display unstable karyotypes. In generating meiotic products from Chr 11-amplified sake strain TCR7, Kadowaki et al. observed a large fraction of spores with aneuploidies not found in the parental strain, consistent with a meiotic segregation defect (Kadowaki et al. 2017). Another study found that some sake strains are sensitive to the microtubule poison benomyl that disrupts chromosome segregation—this sensitivity is explained by polymorphisms in Cdc55, a critical regulator of the mitotic spindle checkpoint (Goshima et al. 2016). Finally, anecdotal work from our lab showed variability in chromosomal duplication in sake strain K9, with different chromosomal amplifications appearing in replicate genomic analyses (Gasch et al. 2016). Together, these data suggest that Sake strains have unstable karyotypes due to a higher rate of segregation defects—we propose that a higher level of aneuploidy tolerance accommodates this rate. An intriguing possibility is that the higher rate of segregation errors has actually been selected for, as proposed by Kadowaki et al. who identified industrial benefits from chromosome amplification, regardless of which chromosome was affected (Kadowaki et al. 2017).
The European Wine strains provide a counterpoint to aneuploidy-tolerant strains. This clade shows low aneuploidy frequency, similar to what may be ancestral rates. However, unlike most other groups (including other strains in the ancestral frequency group defined here), aneuploid European Wine strains were slower growing than euploids in rich medium, showed sporulation defects, and were especially sensitive to stress compared to growth in optimal conditions (Figures 4-5). Growth-rate defects are unlikely to be as severe as in aneuploid W303 strains, based on past work in our lab (Hose et al. 2015; Gasch et al. 2016; Hose et al. 2020). Nonetheless, differences in underlying aneuploidy tolerance could have significant impacts on evolution, as aneuploidy-sensitive strains may be less likely to sample evolutionary trajectories afforded by chromosome duplication (Yona et al. 2012; Berman 2016). Indeed, Filteau et al. previously showed that strong laboratory selective pressure produces different solutions depending on genetic background, with aneuploidy emerging in one genetic background but not another (Filteau et al. 2015). An exciting and important avenue for future work is the systematic quantification of aneuploidy tolerance in the absence of selection, using lines with engineered chromosome duplications, and dissection of the genetic basis for these differences. Such defined analysis in the absence of natural selection is an important step in clarifying the true impact of genetic background on variation in aneuploidy tolerance.
Acknowledgements
We thank Joseph Schacherer for providing phenotype data described in Peter et al. (2018) and Mike Place and Auguste Dutcher for useful discussions and support. In memory, we thank Angelika Amon for thought-provoking and collegial discussions and for her important contributions to this field.
Funding
This work was funded by NIH grant R01CA229532 to APG and NSF grant IOS 1946046 to DB and APG.
Conflicts of interest
None declared.
References
- Agrimi G, Mena MC, Izumi K, Pisano I, Germinario L, et al. 2014. Improved sake metabolic profile during fermentation due to increased mitochondrial pyruvate dissimilation. FEMS Yeast Res. 14:249–260. [DOI] [PubMed] [Google Scholar]
- Antonarakis SE, Epstein CJ.. 2006. The challenge of Down syndrome. Trends Mol Med. 12:473–479. [DOI] [PubMed] [Google Scholar]
- Beach RR, Ricci-Tam C, Brennan CM, Moomau CA, Hsu PH, et al. 2017. Aneuploidy causes non-genetic individuality. Cell. 169:229–242 e221. [DOI] [PMC free article] [PubMed] [Google Scholar]
- Beaupere C, Dinatto L, Wasko BM, Chen RB, VanValkenburg L, et al. 2018. Genetic screen identifies adaptive aneuploidy as a key mediator of ER stress resistance in yeast. Proc Natl Acad Sci Usa. 115:9586–9591. [DOI] [PMC free article] [PubMed] [Google Scholar]
- Bensasson D, Dicks J, Ludwig JM, Bond CJ, Elliston A, et al. 2019. Diverse lineages of Candida albicans Live on Old Oaks. Genetics. 211:277–288. [DOI] [PMC free article] [PubMed] [Google Scholar]
- Berman J. 2016. Ploidy plasticity: a rapid and reversible strategy for adaptation to stress. FEMS Yeast Res. 16: [DOI] [PubMed] [Google Scholar]
- Bing J, Han PJ, Liu WQ, Wang QM, Bai FY.. 2014. Evidence for a Far East Asian origin of lager beer yeast. Curr Biol. 24:R380–381. [DOI] [PubMed] [Google Scholar]
- Bolger AM, Lohse M, Usadel B.. 2014. Trimmomatic: a flexible trimmer for Illumina sequence data. Bioinformatics. 30:2114–2120. [DOI] [PMC free article] [PubMed] [Google Scholar]
- Brennan CM, Vaites LP, Wells JN, Santaguida S, Paulo JA, et al. 2019. Protein aggregation mediates stoichiometry of protein complexes in aneuploid cells. Genes Dev. 33:1031–1047. [DOI] [PMC free article] [PubMed] [Google Scholar]
- Broco N, Tenreiro S, Viegas CA, Sa-Correia I.. 1999. FLR1 gene (ORF YBR008c) is required for benomyl and methotrexate resistance in Saccharomyces cerevisiae and its benomyl-induced expression is dependent on pdr3 transcriptional regulator. Yeast. 15:1595–1608. [DOI] [PubMed] [Google Scholar]
- Chen G, Bradford WD, Seidel CW, Li R.. 2012. Hsp90 stress potentiates rapid cellular adaptation through induction of aneuploidy. Nature. 482:246–250. [DOI] [PMC free article] [PubMed] [Google Scholar]
- Cherry JM. 2015. The Saccharomyces genome database: a tool for discovery. Cold Spring Harb Protoc. 2015:pdb top083840. [DOI] [PMC free article] [PubMed] [Google Scholar]
- Crawley MJ. 2012a. Binary response variables. In: The R Book, 2nd ed. John Wiley and Sons Ltd. p. 650–665. [Google Scholar]
- Crawley MJ. 2012b. Statistical modelling. In: The R Book, 2nd ed. John Wiley and Sons Ltd. p. 388–448. [Google Scholar]
- De Chiara M, Barre B, Persson J, Chioma AO, Irizar A, et al. 2020. Domestication reprogrammed the budding yeast life cycle. bioRxiv Preprint. [DOI] [PubMed] [Google Scholar]
- Dephoure N, Hwang S, O'Sullivan C, Dodgson SE, Gygi SP, et al. 2014. Quantitative proteomic analysis reveals posttranslational responses to aneuploidy in yeast. Elife. 3:e03023. [DOI] [PMC free article] [PubMed] [Google Scholar]
- Dodgson SE, Santaguida S, Kim S, Sheltzer J, Amon A.. 2016. The pleiotropic deubiquitinase Ubp3 confers aneuploidy tolerance. Genes Dev. 30:2259–2271. [DOI] [PMC free article] [PubMed] [Google Scholar]
- Donnelly N, Storchova Z.. 2015. Causes and consequences of protein folding stress in aneuploid cells. Cell Cycle. 14:495–50 1. [DOI] [PMC free article] [PubMed] [Google Scholar]
- Duan SF, Han PJ, Wang QM, Liu WQ, Shi JY, et al. 2018. The origin and adaptive evolution of domesticated populations of yeast from Far East Asia. Nat Commun. 9:2690. [DOI] [PMC free article] [PubMed] [Google Scholar]
- Fay JC, Liu P, Ong GT, Dunham MJ, Cromie GA, et al. 2019. A polyploid admixed origin of beer yeasts derived from European and Asian wine populations. PLoS Biol. 17:e3000147. [DOI] [PMC free article] [PubMed] [Google Scholar]
- Felsenstein J. 1989. Phylogeny inference package (version 3.2). Cladistics. 5:164–166. [Google Scholar]
- Filteau M, Hamel V, Pouliot MC, Gagnon-Arsenault I, Dube AK, et al. 2015. Evolutionary rescue by compensatory mutations is constrained by genomic and environmental backgrounds. Mol Syst Biol. 11:832. [DOI] [PMC free article] [PubMed] [Google Scholar]
- Gallone B, Steensels J, Prahl T, Soriaga L, Saels V, et al. 2016. Domestication and Divergence of Saccharomyces cerevisiae Beer Yeasts. Cell. 166:1397–1410 e1316. [DOI] [PMC free article] [PubMed] [Google Scholar]
- García-López MC, Mirón-García MC, Garrido-Godino AI, Mingorance C, Navarro F.. 2010. Overexpression of SNG1 causes 6-azauracil resistance in Saccharomyces cerevisiae. Curr Genet. 56:251–263. [DOI] [PubMed] [Google Scholar]
- Gasch AP, Hose J, Newton MA, Sardi M, Yong M, et al. 2016. Further support for aneuploidy tolerance in wild yeast and effects of dosage compensation on gene copy-number evolution. Elife. 5:e14409. [DOI] [PMC free article] [PubMed] [Google Scholar]
- Gilchrist C, Stelkens R.. 2019. Aneuploidy in yeast: Segregation error or adaptation mechanism? Yeast. [DOI] [PMC free article] [PubMed] [Google Scholar]
- Gorter de Vries AR, Pronk JT, Daran JG.. 2017. Industrial relevance of chromosomal copy number variation in Saccharomyces yeasts. Appl Environ Microbiol. 83:11. [DOI] [PMC free article] [PubMed] [Google Scholar]
- Goshima T, Nakamura R, Kume K, Okada H, Ichikawa E, et al. 2016. Identification of a mutation causing a defective spindle assembly checkpoint in high ethyl caproate-producing sake yeast strain K1801. Biosci Biotechnol Biochem. 80:1657–1662. [DOI] [PubMed] [Google Scholar]
- Holland AJ, Cleveland DW.. 2012. Losing balance: the origin and impact of aneuploidy in cancer. EMBO Rep. 13:501–514. [DOI] [PMC free article] [PubMed] [Google Scholar]
- Horie K, Oba T, Motomura S, Isogai A, Yoshimura T, et al. 2010. Breeding of a low pyruvate-producing sake yeast by isolation of a mutant resistant to ethyl alpha-transcyanocinnamate, an inhibitor of mitochondrial pyruvate transport. Biosci Biotechnol Biochem. 74:843–847. [DOI] [PubMed] [Google Scholar]
- Hose J, Escalante LE, Clowers KJ, Dutcher HA, Robinson D, et al. 2020. The genetic basis of aneuploidy tolerance in wild yeast. Elife. 9:e52063. [DOI] [PMC free article] [PubMed] [Google Scholar]
- Hose J, Yong CM, Sardi M, Wang Z, Newton MA, et al. 2015. Dosage compensation can buffer copy-number variation in wild yeast. Elife. 4:e05462. [DOI] [PMC free article] [PubMed] [Google Scholar]
- Hughes TR, Roberts CJ, Dai H, Jones AR, Meyer MR, et al. 2000. Widespread aneuploidy revealed by DNA microarray expression profiling. Nat Genet. 25:333–337. [DOI] [PubMed] [Google Scholar]
- Kadowaki M, Fujimaru Y, Taguchi S, Ferdouse J, Sawada K, et al. 2017. Chromosomal aneuploidy improves the brewing characteristics of sake yeast. Appl Environ Microbiol. 83:24. [DOI] [PMC free article] [PubMed] [Google Scholar]
- Large CRL, Hanson N, Tsouris A, Saada OA, Koonthongkaew J, et al. 2020. Genomic stability and adaptation of beer brewing yeasts during serial repitching in the brewery. bioRxiv Preprint. [Google Scholar]
- Larrimore KE, Barattin-Voynova NS, Reid DW, Ng DTW.. 2020. Aneuploidy-induced proteotoxic stress can be effectively tolerated without dosage compensation, genetic mutations, or stress responses. BMC Biol. 18:117. [DOI] [PMC free article] [PubMed] [Google Scholar]
- Li H, Durbin R.. 2009. Fast and accurate short read alignment with Burrows-Wheeler transform. Bioinformatics. 25:1754–1760. [DOI] [PMC free article] [PubMed] [Google Scholar]
- Li H, Edie S, Klinedinst D, Jeong JS, Blackshaw S, et al. 2016. Penetrance of congenital heart disease in a mouse model of down syndrome depends on a trisomic potentiator of a disomic modifier. Genetics. 203:763–770. [DOI] [PMC free article] [PubMed] [Google Scholar]
- Li H, Handsaker B, Wysoker A, Fennell T, Ruan J, 1000 Genome Project Data Processing Subgroup, et al. 2009. The sequence alignment/map format and SAMtools. Bioinformatics. 25:2078–2079. [DOI] [PMC free article] [PubMed] [Google Scholar]
- Liu Y, Borel C, Li L, Muller T, Williams EG, et al. 2017. Systematic proteome and proteostasis profiling in human Trisomy 21 fibroblast cells. Nat Commun. 8:1212. [DOI] [PMC free article] [PubMed] [Google Scholar]
- MacLennan M, Crichton JH, Playfoot CJ, Adams IR.. 2015. Oocyte development, meiosis and aneuploidy. Semin Cell Dev Biol. 45:68–76. [DOI] [PMC free article] [PubMed] [Google Scholar]
- Marco E, Dorn JF, Hsu PH, Jaqaman K, Sorger PK, et al. 2013. S. cerevisiae chromosomes biorient via gradual resolution of syntely between S phase and anaphase. Cell. 154:1127–1139. [DOI] [PMC free article] [PubMed] [Google Scholar]
- Mayer VW, Aguilera A.. 1990. High levels of chromosome instability in polyploids of Saccharomyces cerevisiae. Mutat Res. 231:177–186. [DOI] [PubMed] [Google Scholar]
- Nguyen LT, von Haeseler A, Minh BQ.. 2018. Complex models of sequence evolution require accurate estimators as exemplified with the invariable site plus gamma model. Syst Biol. 67:552–558. [DOI] [PMC free article] [PubMed] [Google Scholar]
- Oromendia AB, Amon A.. 2014. Aneuploidy: implications for protein homeostasis and disease. Dis Model Mech. 7:15–20. [DOI] [PMC free article] [PubMed] [Google Scholar]
- Oromendia AB, Dodgson SE, Amon A.. 2012. Aneuploidy causes proteotoxic stress in yeast. Genes Dev. 26:2696–2708. [DOI] [PMC free article] [PubMed] [Google Scholar]
- Pavelka N, Rancati G.. 2013. Never in neutral: a systems biology and evolutionary perspective on how aneuploidy contributes to human diseases. Cytogenet Genome Res. 139:193–205. [DOI] [PubMed] [Google Scholar]
- Pavelka N, Rancati G, Zhu J, Bradford WD, Saraf A, et al. 2010. Aneuploidy confers quantitative proteome changes and phenotypic variation in budding yeast. Nature. 468:321–325. [DOI] [PMC free article] [PubMed] [Google Scholar]
- Peter J, De Chiara M, Friedrich A, Yue JX, Pflieger D, et al. 2018. Genome evolution across 1,011 Saccharomyces cerevisiae isolates. Nature. 556:339–344. [DOI] [PMC free article] [PubMed] [Google Scholar]
- Pickrell JK, Pritchard JK.. 2012. Inference of population splits and mixtures from genome-wide allele frequency data. PLoS Genet. 8:e1002967. [DOI] [PMC free article] [PubMed] [Google Scholar]
- Popadin K, Peischl S, Garieri M, Sailani MR, Letourneau A, et al. 2018. Slightly deleterious genomic variants and transcriptome perturbations in Down syndrome embryonic selection. Genome Res. 28:1–10. [DOI] [PMC free article] [PubMed] [Google Scholar]
- Prandini P, Deutsch S, Lyle R, Gagnebin M, Delucinge Vivier C, et al. 2007. Natural gene-expression variation in Down syndrome modulates the outcome of gene-dosage imbalance. Am J Hum Genet. 81:252–263. [DOI] [PMC free article] [PubMed] [Google Scholar]
- Rancati G, Pavelka N, Fleharty B, Noll A, Trimble R, et al. 2008. Aneuploidy underlies rapid adaptive evolution of yeast cells deprived of a conserved cytokinesis motor. Cell. 135:879–893. [DOI] [PMC free article] [PubMed] [Google Scholar]
- Reich D, Thangaraj K, Patterson N, Price AL, Singh L.. 2009. Reconstructing Indian population history. Nature. 461:489–494. [DOI] [PMC free article] [PubMed] [Google Scholar]
- Selmecki A, Forche A, Berman J.. 2006. Aneuploidy and isochromosome formation in drug-resistant Candida albicans. Science. 313:367–370. [DOI] [PMC free article] [PubMed] [Google Scholar]
- Selmecki AM, Dulmage K, Cowen LE, Anderson JB, Berman J.. 2009. Acquisition of aneuploidy provides increased fitness during the evolution of antifungal drug resistance. PLoS Genet. 5:e1000705. [DOI] [PMC free article] [PubMed] [Google Scholar]
- Sheltzer JM, Torres EM, Dunham MJ, Amon A.. 2012. Transcriptional consequences of aneuploidy. Proc Natl Acad Sci USA. 109:12644–12649. [DOI] [PMC free article] [PubMed] [Google Scholar]
- Shimoaraiso M, Nakanishi T, Kubo T, Natori S.. 2000. Transcription elongation factor S-II confers yeast resistance to 6-azauracil by enhancing expression of the SSM1 gene. J Biol Chem. 275:29623–29627. [DOI] [PubMed] [Google Scholar]
- Stamatakis A. 2014. RAxML version 8: a tool for phylogenetic analysis and post-analysis of large phylogenies. Bioinformatics. 30:1312–1313. [DOI] [PMC free article] [PubMed] [Google Scholar]
- Storchova Z. 2014. Ploidy changes and genome stability in yeast. Yeast. 31:421–430. [DOI] [PubMed] [Google Scholar]
- Storchova Z, Breneman A, Cande J, Dunn J, Burbank K, et al. 2006. Genome-wide genetic analysis of polyploidy in yeast. Nature. 443:541–547. [DOI] [PubMed] [Google Scholar]
- Storchova Z, Pellman D.. 2004. From polyploidy to aneuploidy, genome instability and cancer. Nat Rev Mol Cell Biol. 5:45–54. [DOI] [PubMed] [Google Scholar]
- Strope PK, Skelly DA, Kozmin SG, Mahadevan G, Stone EA, et al. 2015. The 100-genomes strains, an S. cerevisiae resource that illuminates its natural phenotypic and genotypic variation and emergence as an opportunistic pathogen. Genome Res. 25:762–774. [DOI] [PMC free article] [PubMed] [Google Scholar]
- Sunshine AB, Payen C, Ong GT, Liachko I, Tan KM, et al. 2015. The fitness consequences of aneuploidy are driven by condition-dependent gene effects. PLoS Biol. 13:e1002155. [DOI] [PMC free article] [PubMed] [Google Scholar]
- Targa A, Rancati G.. 2018. Cancer: a CINful evolution. Curr Opin Cell Biol. 52:136–144. [DOI] [PubMed] [Google Scholar]
- Thorburn RR, Gonzalez C, Brar GA, Christen S, Carlile TM, et al. 2013. Aneuploid yeast strains exhibit defects in cell growth and passage through START. MBoC. 24:1274–1289. [DOI] [PMC free article] [PubMed] [Google Scholar]
- Todd RT, Selmecki A.. 2020. Expandable and reversible copy number amplification drives rapid adaptation to antifungal drugs. Elife. 9:e58349. [DOI] [PMC free article] [PubMed] [Google Scholar]
- Torres EM, Dephoure N, Panneerselvam A, Tucker CM, Whittaker CA, et al. 2010. Identification of aneuploidy-tolerating mutations. Cell. 143:71–83. [DOI] [PMC free article] [PubMed] [Google Scholar]
- Torres EM, Sokolsky T, Tucker CM, Chan LY, Boselli M, et al. 2007. Effects of aneuploidy on cellular physiology and cell division in haploid yeast. Science. 317:916–924. [DOI] [PubMed] [Google Scholar]
- Tsai HJ, Nelliat A.. 2019. A double-edged sword: aneuploidy is a prevalent strategy in fungal adaptation. Genes (Basel). 10:787. [DOI] [PMC free article] [PubMed] [Google Scholar]
- Uesono Y, Fujita A, Toh-e A, Kikuchi Y.. 1994. The MCS1/SSD1/SRK1/SSL1 gene is involved in stable maintenance of the chromosome in yeast. Gene. 143:135–138. [DOI] [PubMed] [Google Scholar]
- Uesono Y, Toh-e A, Kikuchi Y.. 1997. Ssd1p of Saccharomyces cerevisiae associates with RNA. J Biol Chem. 272:16103–16109. [DOI] [PubMed] [Google Scholar]
- van den Broek M, Bolat I, Nijkamp JF, Ramos E, Luttik MA, et al. 2015. Chromosomal copy number variation in Saccharomyces pastorianus is evidence for extensive genome dynamics in industrial lager brewing strains. Appl Environ Microbiol. 81:6253–6267. [DOI] [PMC free article] [PubMed] [Google Scholar]
- Wang QM, Liu WQ, Liti G, Wang SA, Bai FY.. 2012. Surprisingly diverged populations of Saccharomyces cerevisiae in natural environments remote from human activity. Mol Ecol. 21:5404–5417. [DOI] [PubMed] [Google Scholar]
- Wysocki R, Bobrowicz P, Ułaszewski S.. 1997. The Saccharomyces cerevisiae ACR3 gene encodes a putative membrane protein involved in arsenite transport. J Biol Chem. 272:30061–30066. [DOI] [PubMed] [Google Scholar]
- Wysocki R, Fortier P-K, Maciaszczyk E, Thorsen M, Leduc A, et al. 2004. Transcriptional activation of metalloid tolerance genes in Saccharomyces cerevisiae requires the AP-1-like proteins Yap1p and Yap8p. MBoC. 15:2049–2060. [DOI] [PMC free article] [PubMed] [Google Scholar]
- Yang F, Teoh F, Tan ASM, Cao Y, Pavelka N, et al. 2019. Aneuploidy enables cross-adaptation to unrelated drugs. Mol Biol Evol. 36:1768–1782. [DOI] [PMC free article] [PubMed] [Google Scholar]
- Yona AH, Manor YS, Herbst RH, Romano GH, Mitchell A, et al. 2012. Chromosomal duplication is a transient evolutionary solution to stress. Proc Natl Acad Sci USA. 109:21010–21015. [DOI] [PMC free article] [PubMed] [Google Scholar]
- Zhu YO, Sherlock G, Petrov DA.. 2016. Whole genome analysis of 132 clinical Saccharomyces cerevisiae strains reveals extensive ploidy variation. G3 (Bethesda). 6:2421–2434. [DOI] [PMC free article] [PubMed] [Google Scholar]
Associated Data
This section collects any data citations, data availability statements, or supplementary materials included in this article.
Data Availability Statement
Strains and plasmids are available upon request. Data, tree, and script files are available at https://github.com/bensassonlab/data/tree/master/scopel_etal20/. The authors affirm that all data necessary for confirming the conclusions of the article are present within the article, Figures, and tables or previously published. Supplemental Material available at figshare: https://doi.org/10.25386/genetics.13635050.