Figure 5.
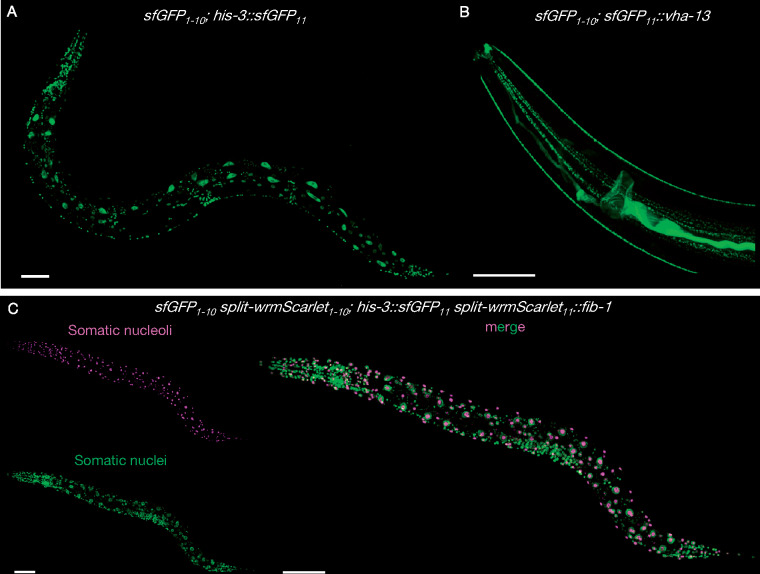
Split-sfGFP and split-wrmScarlet dual-color protein labeling. Images of animals stably expressing sfGFP1–10 in somatic tissues (A) CF4592 muIs253[Peft-3::sfGFP1–10::unc-54 3'UTR Cbr-unc-119(+)] II; unc-119(ed3) III; his-3(muIs255[his-3::sfGFP11]) V or (B) CF4589 muIs253[Peft-3::sfGFP1–10::unc-54 3'UTR Cbr-unc-119(+)] II; unc-119(ed3) III; vha-13(muIs268[sfGFP11::vha-13]) V. (C) Dual color protein labeling with split-wrmScarlet and split-sfGFP in somatic cells. Composite display of red and green channels of animals expressing split-wrmScarlet1–10 and sfGFP1–10 in somatic tissues, HIS-3::sfGFP11 and split-wrmScarlet11::FIB-1; CF4602 muIs253[Peft-3::sfGFP1–10::unc-54 3'UTR Cbr-unc-119(+)] muIs252[Peft-3::split-wrmScarlet1–10::unc-54 3'UTR Cbr-unc-119(+)] II; unc-119(ed3) III; fib-1(muIs254[split-wrmScarlet11::fib-1]) his-3(muIs255[his-3::sfGFP11]) V. Maximum intensity projections of 3D stacks shown. Scale bars, 50 µm.

