

Abstract
Objectives:
Despite disparities in lung cancer incidence and mortality, the molecular landscape of lung cancer in patients of African ancestry remains underexplored, and race-related differences in RNA splicing remain unexplored.
Materials and Methods:
We identified differentially spliced genes (DSGs) and differentially expressed genes (DEGs) in biobanked lung squamous cell carcinoma (LUSC) between patients of West African and European ancestry, using ancestral genotyping and Affymetrix Clariom D array. DSGs and DEGs were validated independently using the National Cancer Institute Genomic Data Commons. Associated biological processes, overlapping canonical pathways, enriched gene sets, and cancer relevance were identified using Gene Ontology Consortium, Ingenuity Pathway Analysis, Gene Set Enrichment Analysis, and CancerMine, respectively. Association with LUSC survival was conducted using The Cancer Genome Atlas.
Results:
4,829 DSGs and 267 DEGs were identified, including novel targets in NSCLC as well as genes identified previously to have relevance to NSCLC. RNA splicing events within 3 DSGs as well as 1 DEG were validated in the independent cohort. 853 DSGs and 29 DEGs have been implicated as potential drivers, oncogenes and/or tumor suppressor genes. Biological processes enriched among DSGs and DEGs included metabolic process, biological regulation, and multicellular organismal process and, among DSGs, ion transport. Overlapping canonical pathways among DSGs included neuronal signaling pathways and, among DEGs, cell metabolism involving biosynthesis. Gene sets enriched among DSGs included KRAS Signaling, UV Response, E2F Targets, Glycolysis, and Coagulation. 355 RNA splicing events within DSGs and 18 DEGs show potential association with LUSC patient survival.
Conclusion:
These DSGs and DEGs, which show potential biological and clinical relevance, could have the ability to drive novel biomarker and therapeutic development to mitigate LUSC disparities.
Keywords: Lung squamous cell carcinoma, RNA splicing, Aggregate gene expression, West African ancestry, European ancestry
Introduction
In the United States, lung and bronchus cancer is the second most common cancer diagnosed and is responsible for the largest number of deaths from cancer (1). Black males and females combined have the highest number of new cases and deaths per 100,000 persons for lung and bronchus cancer (1), a disparity that likely results from a complex interplay among social, psychosocial, lifestyle, environmental, health system, and biological determinants of health (2).
Smoking is the strongest risk factor for lung cancer (1). African Americans (AA) are more likely to smoke mentholated cigarettes than whites (3), which is associated with reduced odds of quitting (4) and may be related to greater total nicotine exposure (TNE) (5). While AAs have historically smoked fewer cigarettes than whites, AAs have a longer cumulative exposure to tobacco, which has a greater effect on lung cancer risk (3). Despite these findings, there is evidence that suggests that smoking is not a primary driver of lung cancer disparities. Studies have revealed that AAs diagnosed with lung cancer are more likely to be intermittent or light smokers than whites (3). In addition, the disparity between AA and Caucasian lung cancer incidence among females persists even among never smokers (6).
The majority of studies to date investigating the underlying biology of non-small cell lung cancer (NSCLC) in AA patients have focused on DNA-level variation. Studies have reported genetic variation in Cytochrome P450 Family 2 Subfamily A Member 6 (CYP2A6) and DNA Methyltransferase 3 Beta (DNMT3B) that have been shown to contribute to differences in nicotine dependence and metabolism between AAs and European Americans (EAs) (7,8). Studies regarding the frequency of somatic, oncogenic, actionable mutations and rearrangements in NSCLC among different populations are conflicting. Two studies have reported that AA patients across stages of NSCLC and AA patients with metastatic lung adenocarcinomas (LUADs) had the lowest rates of somatic, oncogenic, actionable mutations and rearrangements compared with Asian, Latino and Caucasian/white patients (9,10). Another study has reported that the frequency of somatic BRAF variants was higher in AA patients compared with Caucasians with LUADs (11). Most recently, a study has reported that the frequency of driver mutations was lower in AA NSCLC patients compared with white NSCLC patients, using a targeted panel (12); however, whole exome sequencing in this same study revealed many mutations in such driver genes and in novel genes in AA NSCLC patients compared with white NSCLC patients. In contrast, two studies have reported that the frequency of somatic mutations and copy number alterations did not differ in NSCLCs between African ancestry/black patients and European ancestry/white patients (13,14).
Recently, two studies have begun to report differences in aggregate expression at the RNA- and protein-level in NSCLC between AA and EA/Caucasian patients. One study has reported enrichment of expression of stem cell and invasion gene sets, differences in predicted drug responses based on the expression profiling differences, greater fractions of specific T cells and macrophages, and higher expression of CTLA4 in NSCLCs, predominantly LUADs, between AA and EA patients (15). In addition, this study reported differences in aggregate expression of mRNAs and miRNAs between patient-matched tumor and normal lung tissue from AA and EA patients. Another study has reported lower expression of PD-L1 protein in AA patients compared with Caucasian patients with LUSCs (11).
Given the burden of lung cancer among blacks and that the underlying biology of NSCLC in patients of African ancestry remains underexplored, we sought to identify and characterize a novel aspect of the molecular landscape of NSCLC in patients of African ancestry, RNA splicing. RNA splicing is emerging as a major mechanism driving abnormal phenotypic heterogeneity in human malignancy (16). Studies from our team and others have identified RNA splicing-related genetic and genomic variation in tumors, oncogenes dysregulated by alternative RNA splicing, RNA splice variants driving race-related prostate cancer aggressiveness and response to targeted therapies, spliceosome-dependent transformation and RNA splicing-related immunogenic epitopes in cancer (17). In addition, studies have begun to develop approaches to modulate RNA splicing for therapeutic application (17). In this study, we interrogated RNA from LUSC tissue from patients of African and European ancestry. We identified novel race-related differences in RNA splicing and aggregate gene expression and the potential biological and clinical relevance of these differences.
Materials and Methods
Human LUSC Specimens.
Tissue cores were harvested from archival formalin-fixed, paraffin-embedded (FFPE) tissue blocks from resected LUSC from 21 self-identified AA and 20 self-identified white patients using 4 mm punches. Such specimens were obtained from the BioRepository & Precision Pathology Center at Duke University Medical Center according to a protocol approved by the Duke University Medical Center Institutional Review Board (Pro00079652). Pertinent demographic information and clinical data were captured from the electronic medical record and stored in a RedCap database for analysis.
DNA and RNA Preparation.
Genomic DNA and total RNA were simultaneously isolated from tissue cores using the AllPrep DNA/RNA FFPE Kit (Qiagen). Isolated nucleic acids were quantified using the Qbit 3.0 fluorometer (Life Technologies). RNA integrity was determined using the Agilent Bioanalyzer (Agilent Technologies).
Ancestry Estimate.
Global genetic ancestry analysis was performed as previously described (18). Briefly, genomic DNA was genotyped for 100 ancestry informative markers (AIMs) using the Sequenom MassARRAY iPLEX platform. The AIMs panel consisted of carefully selected autosomal markers previously identified and validated for estimating continental ancestry information in admixed populations. Individual single-nucleotide polymorphism (SNP) genotype calls were generated using Sequenom TYPER software. Individual admixture estimates for each study participant were calculated using a model-based clustering method as implemented in the program STRUCTURE v2.3. As we were unsure about the ancestries of our samples, we used the admixture model to determine which estimation of K (number of sub populations) is the best fit for the data. We set K from 2 to 5 and ran 100 iterations. We determined that K = 3 had the best fit and used the K = 3 estimates for our analyses. There was no evidence of any hidden relationships among the participants.
Transcriptome Array Analysis.
The Affymetrix WT PLUS reagent kit was used to prepare total RNA isolated from tissue cores for whole transcriptome expression analysis. The kit generates amplified and biotinylated sense-strand DNA targets from total RNA that provides a complete and unbiased coverage of the transcriptome. Affymetrix transcriptome array analysis was prepared according to the manufacturer’s instructions, and targets were hybridized to the Affymetrix Human Clariom D Array within the Duke Microbiome Shared Resource. The Affymetrix transcriptome array data are available from GEO (GSE137291).
Pre-processing of Transcriptome Array Data.
The raw array CEL data were processed and analyzed by Transcriptome Analysis Console (TAC, version 4.0.0.25, Thermo Fisher Scientific). The signal space transformation-robust multi-chip analysis algorithm was used for quantifying the expression at both gene and exon levels. The threshold for positive versus negative area under the curve (AUC) was set at 0.6. Samples below or equal to this threshold were excluded from the downstream analyses. All other parameters were set as default.
Differentially Spliced Genes (DSGs) and Differentially Expressed Genes (DEGs).
For discovery, a splicing event was categorized as a DSG if the corresponding unadjusted p-value was < 0.01 when compared by race. Similarly, a gene was categorized as a DEG if the corresponding unadjusted p-value was < 0.01 when compared by race.
National Cancer Institute Genomic Data Commons (GDC) Validation.
RNA-Seq expression for The Cancer Genome Atlas (TCGA)-LUSC (19) patients were queried from the GDC (20) using the R package TCGAbiolinks (v2.14.0) (21). The raw gene counts were normalized using the variance-stabilizing transformation method implemented in the R package DESeq2 (v1.26.0) (22). RNA splicing events and patterns measured in Percent Spliced In (PSI) values for TCGA-LUSC were obtained from MD Anderson’s TCGASpliceSeq (23) website. Normal samples and duplicated samples were excluded and a final cohort of 501 primary solid tumor samples was used for the validation analysis. To validate the DEGs identified by Affymetrix Clariom D array, the genes found present in the TCGA-LUSC data set were tested for differences in expression between AA and white patients using linear models implemented by Limma (v3.42.0) (24). To validate the race-related differentially expressed probesets identified by Affymetrix Clariom D array, the probesets were first matched to the splicing events in TCGA-LUSC using the exon annotation file available on the TCGASpliceSeq website. A probe selection region (PSR) type of probeset was considered to be matched to a TCGASpliceSeq event if the probe selection region was within an exonic region of the event plus 5 bp flanking the region on both sides. A junction (JUC) type of probeset was considered to be matched to a TCGASpliceSeq event if the gap between the junction selection region and an inter-exon region of the event was no greater than 5 bp. Because of discrepancies in human genome versions and annotation and measurements between the microarray and RNASeq platforms, the number of matchable probesets was limited (about 11% of ~ 716,111 probesets) and the probesets may not fully capture the directionality of matched splicing events. The matched splicing events were tested for differences in PSI using the Wilcoxon rank-sum test. The Benjamini-Hochberg method (25) was used to adjust p-values for multiple hypothesis testing within the false-discovery framework.
Pathway Analysis.
Gene Ontology/Biological Process annotation was performed using the Gene Ontology Resource. The list of DEGs and DSGs were inputted into the GO Enrichment Analysis powered by PANTHER (geneontology.org). Resulting pathway analysis was prioritized according to unadjusted p-value. Further categorization of pathways was done using the PANTHER 14.1 classification system (26). Biological process was selected as the main category of pathway identification and each gene was grouped according to function within the GO biological process categories. In addition, Ingenuity Pathway Analysis (IPA) (Ingenuity Systems) was used to determine gene enrichment in curated pathways. The list of DEGs and DSGs were inputted into the IPA system, which generated a list arranged by unadjusted p-value as well as a summary of the most significant overlapping canonical pathways that appeared in each gene list. In Figure 2B and 2F, the nodes are the top pathways and connecting lines are inferred relationships that have an effect (i.e. activation or inhibition) consistent with the pattern of activity predicted by the analysis. These graphs provide an overview of the major biological themes in the identified DSGs or DEGs illustrating how these concepts relate to one another. The graphs were generated by selecting and connecting a subset of the most significant pathways predicted using the IPA system. The graphical summary uses a precomputed table containing inferred relationships between molecules, functions, diseases, and pathways. Gene Set Enrichment Analysis (GSEA) was performed to elucidate the gene sets enriched among DSGs or DEGs (27,28). GSEA was performed using the list of DSGs and DEGs inputted into GSEA v.4.1.0 based on the Molecular Signatures Database v.6.2 H (Hallmark Gene Sets). p-value < 0.05 and FDR < 0.25 were considered statistically significant.
Survival Analysis.
To determine the association between the overall survival time of patients and expression for DEGs or PSI for splicing events within DSGs, a Cox proportional hazards regression model was fit using the R package survival (v3.1–12) (29), and the marginal p-values were determined by score test. A DEG or race-related differential splicing event was considered to be potentially associated with survival if the unadjusted p-value was < 0.05. To visualize the effect of DEGs or race-related differential splicing events upon the survival times in a Kaplan-Meier plot, patients were stratified into three groups: low (1st to 25th percentile), medium (26th to 75th percentile) and high (76th to 100th percentile) in expression for DEGs or in PSI for splicing events within DSGs. All analyses were performed in R (v3.6.3) (30) and figures were generated using the R package ggplot2 (v3.3.0) (31).
Results
Patient cohort.
Comparisons of baseline characteristics between the 21 self-identified AA patients and the 20 self-identified white patients in this study are shown in Table 1. The mean age of the patients was 68.0 years, with 73.2% male. All were smokers. All patients had NSCLC of squamous histology and 34.1% had stage I, 36.6% had stage II, and 29.3% had stage III/IV disease at the time of resection.
Table 1.
Clinical and demographic characteristics of study subjects.
| African American (N=21) |
White (N=20) |
Total (N=41) |
P-value | |
|---|---|---|---|---|
| Age | 0.39521 | |||
| Mean (SD) | 67 (8) | 69 (7) | 68 (7) | |
| Median (IQR) | 67 (62, 73) | 71 (66, 73) | 69 (64, 73) | |
| Range | 51, 82 | 53, 80 | 51, 82 | |
| Gender, n (%) | 1.00002 | |||
| Female | 6 (28.6) | 5 (25.0) | 11 (26.8) | |
| Male | 15 (71.4) | 15 (75.0) | 30 (73.2) | |
| Pack Years | 0.91041 | |||
| Mean (SD) | 86 (67) | 77 (47) | 82 (58) | |
| Median (IQR) | 67 (42, 134) | 67 (33, 113) | 67 (42, 125) | |
| Range | 5, 250 | 7, 167 | 5, 250 | |
| Stage, n (%) | 0.85782 | |||
| I | 7 (33.3) | 7 (35.0) | 14 (34.1) | |
| II | 7 (33.3) | 8 (40.0) | 15 (36.6) | |
| III/IV | 7 (33.3) | 5 (25.0) | 12 (29.3) |
Wilcoxon rank sum p-value;
Fisher Exact p-value
Ancestry of patient cohort.
European (Euro), Native American (NatAm) and West African (WestAfr) ancestry were determined for the 21 self-identified AA and the 20 self-identified white patients. As shown in Supplementary Figure 1, ancestral genotyping revealed a range of 44.4%–98.7% (mean 77.3%, SD 13%) WestAfr ancestry among self-identified AAs and a range of 88.1%–99.3% (mean 94.4%, SD 3.1%) Euro ancestry among self-identified whites. Minimal NatAm ancestry was revealed among all patients.
Identification of DSGs and/or DEGs.
We interrogated total RNA isolated from LUSC tissue obtained from the 21 patients of WestAfr ancestry and the 20 patients of Euro ancestry for differences in RNA splicing and/or aggregate gene expression between the populations. A final cohort of 25 patients (14 patients of WestAfr ancestry and 11 patients of Euro ancestry) passed the AUC threshold and we filtered expression data to include those genes with a specified UniGene identifier. Based on our selection criterion, we identified 4,829 DSGs (Figure 1, Supplementary Table 1) and 267 DEGs (Figure 1, Supplementary Table 2). A total of 208 genes were classified as both DEG and DSG (Figure 1).
Figure 1. Differentially spliced genes (DSGs) and differentially expressed genes (DEGs) in lung squamous cell carcinoma (LUSC) between patients of West African (WestAfr) and European (Euro) ancestry.

Venn diagram depicting the number of genes exhibiting differential RNA splicing, differential aggregate gene expression, and both differential RNA splicing and differential aggregate gene expression in LUSC between patients of West Afr and Euro ancestry, as determined by transcriptome array analysis. The top 10 genes exhibiting differential RNA splicing, differential aggregate gene expression, or both differential RNA splicing and differential aggregate gene expression ranked by p-values are highlighted.
Validation of DSGs.
We validated independently RNA splicing events within DSGs using the GDC. To validate, we matched the race-related differentially expressed probesets identified by transcriptome array to the RNA splicing events in TCGA-LUSC and then tested for differences in PSI. It is important to note an assessment of concordance between the estimated direction of the effect size between these two platforms is limited because of not only differences between the technologies, digital reads versus probesets but also differences between the reference genome and annotation files among other considerations and the probesets may not fully capture the directionality of matched splicing events. This analysis validated differential alternative termination in CASP2 And RIPK1 Domain Containing Adaptor With Death Domain (CRADD), alternative termination in 2’–5’-Oligoadenylate Synthetase 2 (OAS2), and skipping/inclusion of exons 5 and 6 in LYR Motif Containing 1 (LYRM1) in LUSC in patients of WestAfr ancestry compared with patients of Euro ancestry (adjusted p-value = 0.002, adjusted p-value = 0.015, adjusted p-value = 0.015, respectively; Supplementary Table 3). Supplementary Figure 2 depicts the validated RNA splicing events in the DSGs. Although CRADD, OAS2, and LYRM1 are novel targets in NSCLC reported herein, all have been reported to play roles in cellular processes relevant to oncogenesis. CRADD encodes a protein that induces apoptosis by interacting with and recruiting Caspase 2 to the cell death signal transduction complex and has been reported to be downregulated in gastric cancer (32,33). OAS2 encodes a protein that plays a role in the innate immune response to viral infection, and, in the context of cancer, has been reported to be negatively associated with colorectal cancer recurrence and is part of a prognostic signature identifed for oral squamous cell carcinoma (34–36). LYRM1 encodes a protein that is a member of the mitochondrial leucine/tyrosine/arginine motif family of proteins, which are involved in proliferation and apoptosis, and, in the context of cancer, has been reported to be associated with pancreatic cancer progression and prognosis (37,38).
Validation of DEGs.
We also validated independently DEGs using the GDC. To validate, the genes found present in the TCGA-LUSC data set were tested for differences in expression between AA and white patients. This analysis validated downregulation of Phospholipid Phosphatase Related 4 (PLPPR4) in LUSC in patients of WestAfr ancestry compared with patients of Euro ancestry (adjusted p-value = 0.029; Supplementary Table 4). Although PLPPR4 is a novel target in NSCLC reported herein, the protein it encodes has been reported to play a role in important cellular processes and has been reported to be relevant in oncogenesis. Specifically, PLPPR4 encodes a member of the phospholipid phosphatase family, which catalyzes dephosphorylation of bioactive lipid mediators that regulate cell functions, and is expressed in neurons, playing an important role in axonal outgrowth (39). In the context of cancer, it has been reported to promote peritoneal metastasis in gastric cancer (40).
Biological and cancer relevance of DSGs and DEGs.
We determined biological processes enriched and overlapping canonical pathways among DSGs using PANTHER software and Gene Ontology biological process pathways and IPA, respectively. All DSGs used for pathway analysis exhibited an unadjusted p-value of < 0.05. PANTHER and IPA revealed 359 and 111 pathways, respectively, enriched in DSGs (Supplementary Table 5). Major biological processes associated included the following: cellular process, which comprised 33% of the significantly enriched pathways, metabolic process (20%), biological regulation (16%), localization (10%), multicellular organismal process (7%), and response to stimulus (5%) (Figure 2A). Overlapping canonical pathways among DSGs included neuronal signaling pathways (Figure 2B).
Figure 2. Biological processes enriched and overlapping canonical pathways among differentially spliced genes (DSGs) and differentially expressed genes (DEGs) in lung squamous cell carcinoma (LUSC) from patients of West African (WestAfr) and European (Euro) ancestry.

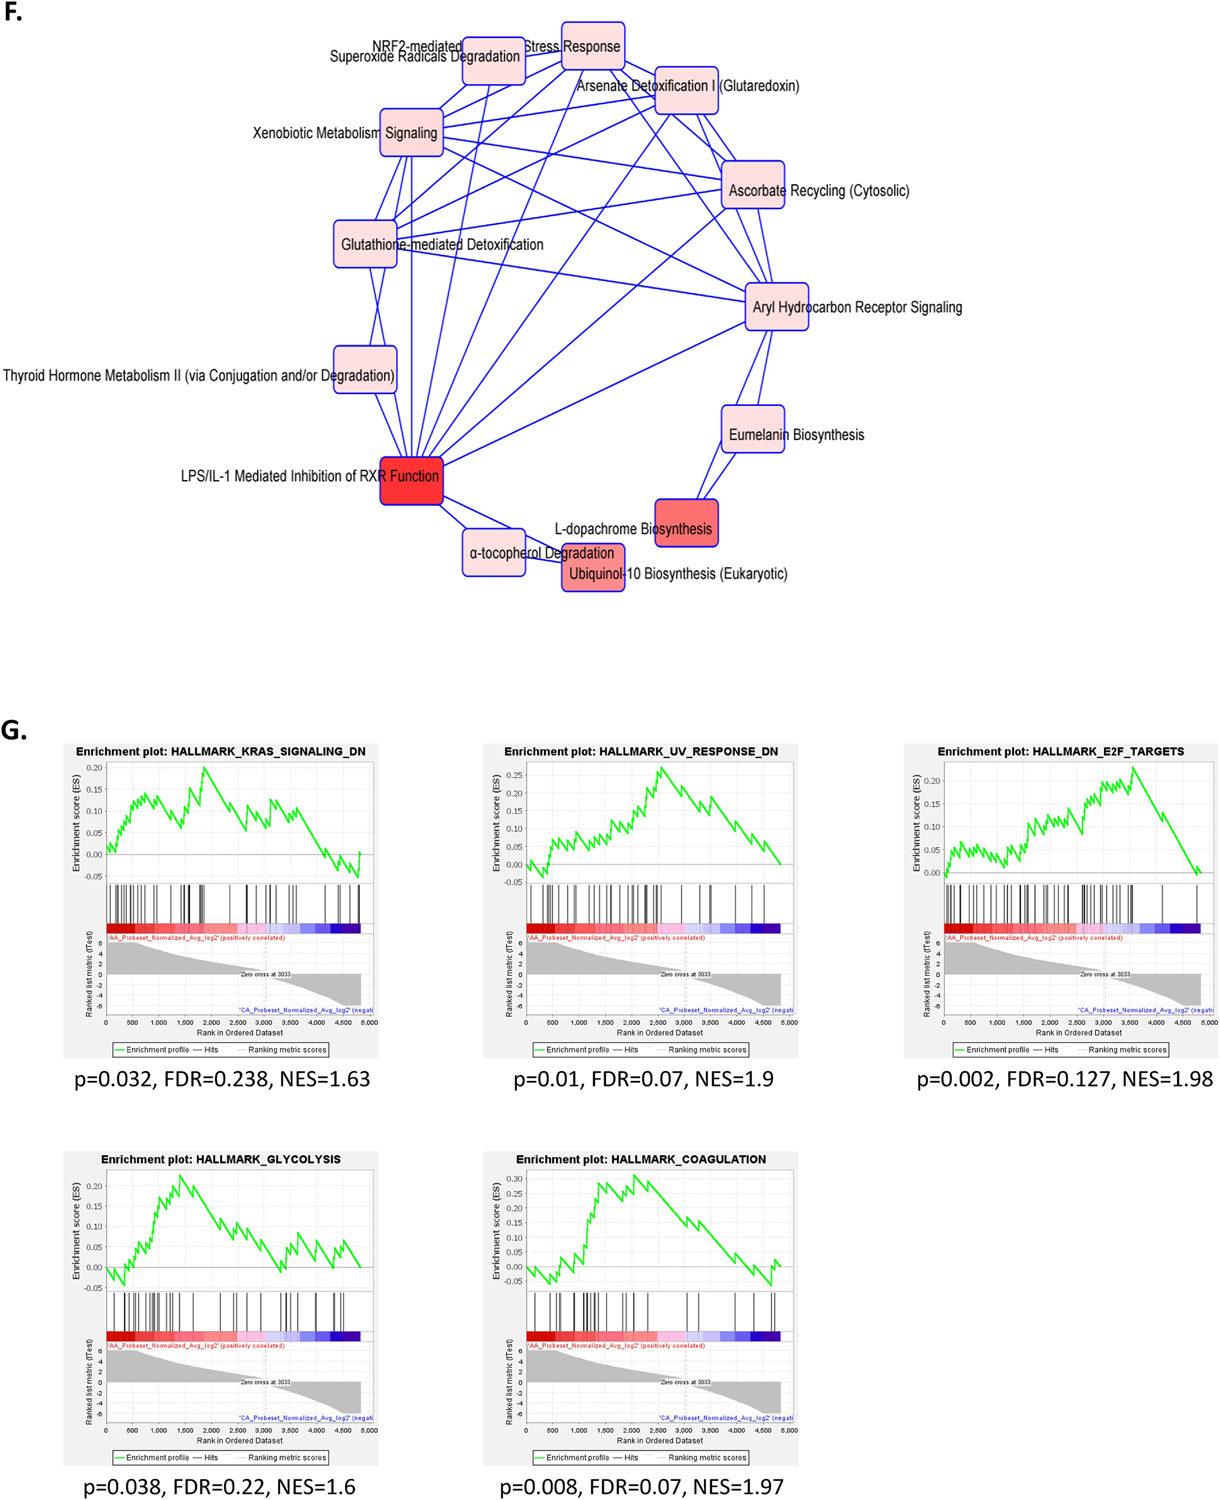
A. Biological processes enriched among DSGs from GO PANTHER. B. Overlapping canonical pathways among DSGs from Ingenuity Pathway Analysis. C. Biological processes enriched among all DEGs from GO PANTHER. D. Biological processes enriched among DEGs upregulated among patients of WestAfr ancestry from GO PANTHER. E. Biological processes enriched among DEGs downregulated among patients of WestAfr ancestry from GO PANTHER. F. Overlapping canonical pathways among all DEGs from Ingenuity Pathway Analysis. G. Gene sets enriched among DSGs from Gene Set Enrichment Analysis.
We also determined biological processes enriched and overlapping canonical pathways among all DEGs and those that were upregulated or downregulated in patients of WestAfr ancestry. All DEGs used for pathway analysis exhibited an unadjusted p-value of < 0.01. Directionality for aggregate gene expression was determined using fold change relative to aggregate gene expression in patients of WestAfr ancestry. PANTHER revealed 303 pathways enriched among all DEGs, 133 pathways enriched among DEGs upregulated among patients of WestAfr ancestry, and 319 pathways enriched among DEGs downregulated among patients of WestAfr ancestry (Figure 2C and Supplementary Table 6). IPA revealed 19 pathways enriched among all DEGs (Supplementary Table 6). Major biological processes associated with DEGs upregulated among patients of WestAfr ancestry included cellular process (31%), biological regulation (19%), metabolic process (13%), multicellular organismal process (13%), localization (12%), biological adhesion (6%), and cellular component organization or biogenesis (6%) (Figure 2D). Major biological processes associated with DEGs downregulated among patients of WestAfr ancestry included cellular process (34%), metabolic process (18%), biological regulation (18%), localization (12%), multicellular organismal process (8%), and response to stimulus (5%) (Figure 2E). Overlapping canonical pathways among all DEGs included cell metabolism involving biosynthesis, including pathways associated with carcinogenesis and oxidative damage (Figure 2F).
GSEA revealed several enriched pathways among DSGs. These included KRAS Signaling, UV Response, E2F Targets, Gycolysis, and Coagulation pathways (Figure 2G).
We assessed the cancer relevance of all DSGs and DEGs using CancerMine, a literature-based database of drivers, oncogenes and tumor suppressor genes in cancer (41). Among the 4,829 DSGs, 853 genes (18%) have been previously implicated in cancer, including 204 drivers (4% of total), 533 oncogenes and/or 437 tumor suppressor genes (Supplementary Table 7). Among the 267 DEGs, 29 (11%) have been previously implicated in cancer, including 5 drivers (2% of total), 17 oncogenes and/or 14 tumor suppressor genes (Supplementary Table 7).
Clinical relevance of DSGs and DEGs.
Using TCGA RNA-Seq and clinical data, we investigated the association between DSGs or DEGs and survival in the LUSC cohort. Among the 4,829 DSGs, 355 race-related differential splicing events were potentially associated with overall survival for LUSC (Supplementary Table 8). Of these, 23 are alternative acceptors (AA), 17 are alternative donors (AD), 92 are alternative promoters (AP), 110 are alternative terminators (AT), 101 are exon skipping (ES), 2 are mutual exclusion (ME), and 10 are retained introns (RI). Figure 3A highlights two of the events, selected based on importance of the gene in cancer biology. Among the 267 DEGs, 18 were potentially associated with overall survival for LUSC (Supplementary Table 8). Figure 3B highlights two of these, selected based on importance of the gene in cancer biology.
Figure 3. Association of differentially spliced genes (DSGs) and differentially expressed genes (DEGs) in lung squamous cell carcinoma (LUSC) from patients of West African (WestAfr) and European (Euro) ancestry with LUSC overall survival.
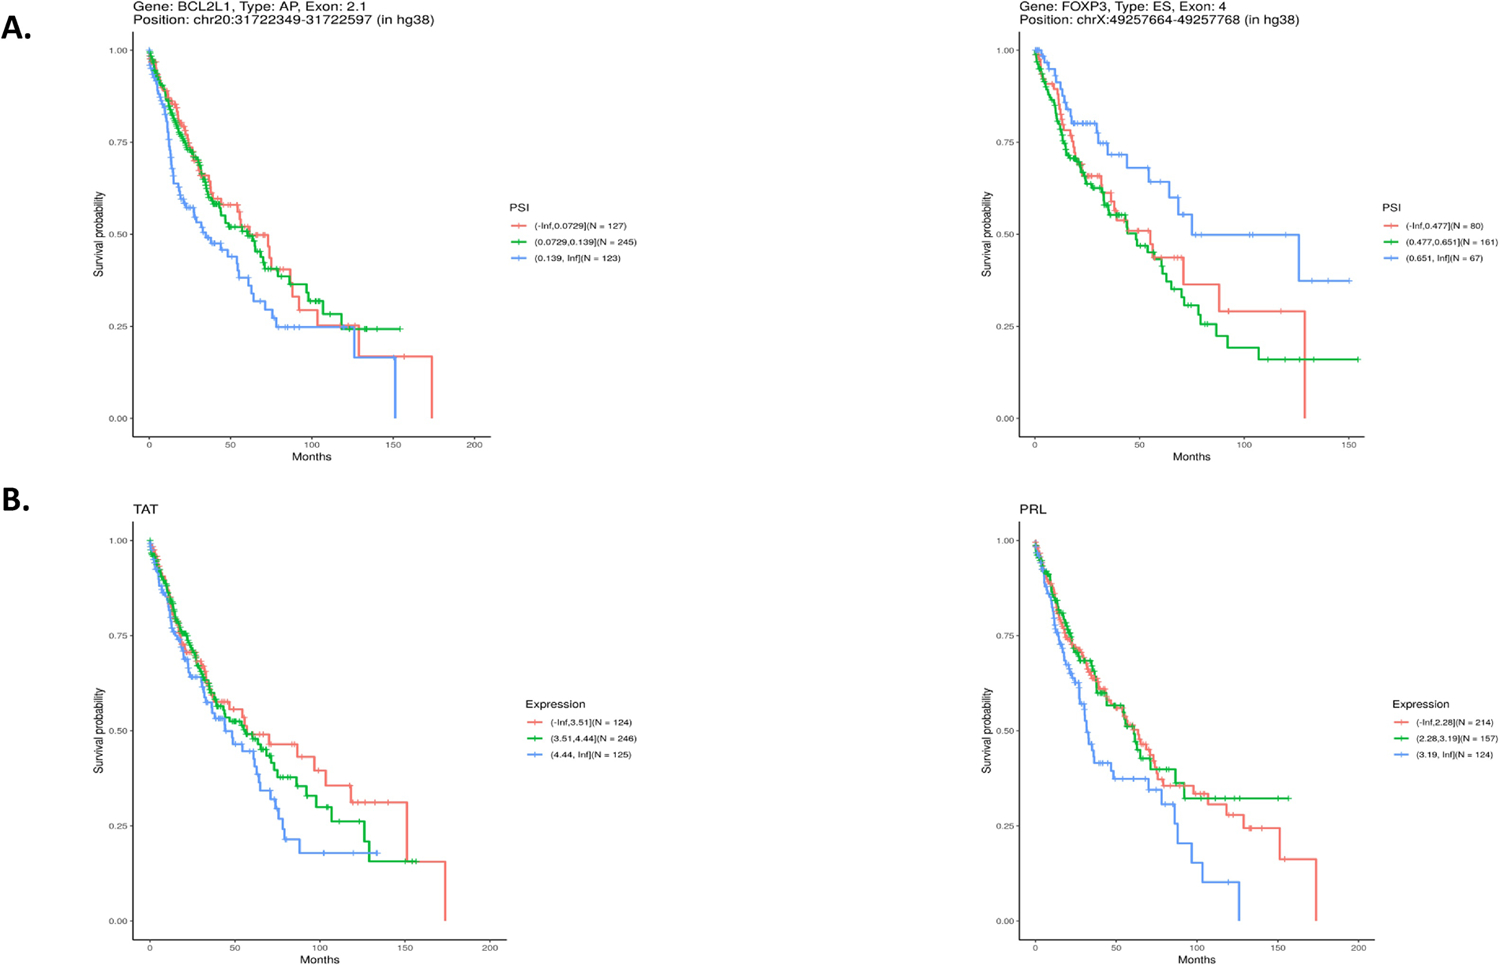
A. Kaplan-Meier plot showing Percent Spliced In (PSI) association with LUSC overall survival of (left) BCL2L1 Exon 2.1 as an alternative promoter and (right) FOXP3 exon 4 as a cassette exon. B. Kaplan-Meier plot showing gene expression association with LUSC overall survival in (left) TAT and (right) PRL.
Discussion
Herein, we identified DSGs and DEGs in LUSC across stages between patients of African and European ancestry, with a history of smoking. The finding that the observed number of DSGs exceeded the observed number of DEGs in the same tissue is consistent with our previous study focusing on prostate cancer (42). This observation, now observed in two different tumor types, is consistent with the emerging understanding that RNA splicing likely plays an underappreciated but major role in defining the transcriptomic landscape of cancer, likely impacting the tumor phenotype, tumor heterogeneity, and tumor response to therapy (17). To characterize DSGs and DEGs, we determined the association with biological processes. From this analysis, a number of themes emerged.
Among DSGs and DEGs, we found enrichment of receptors for the neurotransmitter, gamma aminobutyric acid (GABA). Potential for disparate effects of GABA on lung cancer aggressiveness has been reported, as nicotine treatment of NSCLC cells resulted in decreased levels of endogenous GABA, while treatment of NSCLC cells with GABA inhibited cell proliferation (43). Interestingly, one of the DSGs we identified, SRRM2, belongs to a group of SRRM splicing factors, which have been implicated in regulation of GABA activity (probeset p-value 0.009, Supplementary Table 1 page 25) (44). We also found enrichment of olfactory receptors, which play a role in cancer progression and serve as biomarkers in several cancers (45). Among DSGs, were pathways related to ion transport. Dysregulated aggregate expression and aberrant splicing of ion channels and transporters have been detected across cancers (46). Additionally, dysregulated aggregate expression of ions has been shown to alter RNA splicing (47). Canonical overlapping pathways among DSGs also included neuronal signaling pathways. Also highlighting relevance of neuronal signaling pathways is the validation of downregulation of PLPPR4 in LUSC in patients of WestAfr ancestry compared with patients of Euro ancestry (gene p-value 0.009, Supplementary Table 2 page 1). Interestingly, neuroendocrine feature has been reported in a minority of NSCLCs (48). Gene sets enriched among DSGs included E2F Targets, reported to be frequently dysregulated in NSCLC, including LUSC, and Glycolysis, reported to be dysregulated particulary in LUSC (49,50). In addition, interestingly, gene sets enriched among DSGs also included KRAS Signaling, a pathway frequently found to be dysregulated in NSCLC in smokers, but frequently found to be dysregulated in LUAD and rarely found to be dysregulated in LUSC (51).
Importantly, we have discovered and validated in an independent cohort a number of DSGs, including CRADD, OAS2, and LYRM1 that are novel targets in NSCLC (CRADD probeset p-value 0.004, Supplementary Table 1 page 11; OAS2 probeset p-values 0.004, 0.006, and 0.008, Supplementary Table 1 page 12, 18, and 24; LYRM1 probeset p-values 0.007 and 0.008, Supplementary Table 1 page 21 and 24). In addition, we have discovered a number of DSGs involving previously identified drivers, oncogenes, and/or tumor suppressor genes, including MET, Phosphatase and Tensin Homolog (PTEN) and BCL2, among others (MET probeset p-value 0.009, Supplementary Table 1 page 25; PTEN probeset p-value 0.005, Supplementary Table 1 page 14; BCL2 probeset p-value 0.001, Supplementary Table 1 page 3). MET alterations have been well documented in promoting cancer cell proliferation, survival, and metastasis (52). Inhibition of MET in the presence of either MET exon 14 splice site alterations or MET amplification is an emerging therapeutic option for NSCLC (53). While we did not find a race-related differential splicing event involving exon 14, the presence of race-related differential splicing of MET raises the possibility of therapeutic relevance for the race-related RNA splicing alterations we identified. Furthermore, splicing modulation of BCL2 has been described as a mechanism underlying cytotoxicity and small molecule splicing modulators may have clinical implication in cancer therapy (54). PTEN, which has two isoforms, is part of the PTEN/PI3K/AKT pathway and its inactivation has been associated with lower survival in NSCLC (55). While the functional significance of these race-related RNA splicing events requires detailed investigation, the findings herein highlight that differential RNA splicing exists in LUSC between patients of WestAfr and Euro ancestry, involves critical oncogenic pathways, and many of these pathways are associated with known therapeutic agents. Accordingly, DSGs in NSCLC have the potential to provide new targets and foster a generation of novel therapeutic agents or combinations exploiting RNA splicing differences in NSCLC between patients of WestAfr and Euro ancestry. Given the established and growing role for precision oncology with routine clinical molecular characterization, rational therapeutic strategies targeting DSGs may have the potential to improve clinical outcomes and mitigate NSCLC disparity.
In addition to association with important biological processes and potential oncogenic relevance, specific DSGs and DEGs were found to be potentially associated with overall survival for LUSC, strongly suggesting their clinical relevance as well. While 101 of the 355 splicing events within DSGs found to be potentially associated with LUSC survival were the result of ES, a large proportion of the events involved AP and AT, emphasizing the need for study of these events in RNA splicing analyses. Interestingly, DSGs potentially associated with overall survival for LUSC included the novel gene in LUSC identified herein, LYRM1, and two genes commonly implicated in oncogenesis: BCL2 Like 1 (BCL2L1) (AP at exon 2.1) and Forkhead Box P3 (FOXP3) (ES of exon 4) (LYRM1 probeset p-values 0.007 and 0.008, Supplementary Table 1 page 21 and 24; BCL2L1 probeset p-value 0.005, Supplementary Table 1 page 16; FOXP3 probeset p-values 0.001 and 0.007, Supplementary Table 1 page 2 and 20). The BCL2L1 gene is a member of the anti-apoptotic BCL2 family of proteins, dysregulated in cancers and integral to cancer cell survival (56) and FOXP3 has been implicated in proliferation, metastasis and immune tolerance (57,58). Our identification of differential RNA splicing events in LUSC between patients of WestAfr and Euro ancestry potentially associated with LUSC survival is supported by a recent study identifying RNA splicing events associated with both tumor stage and overall survival for NSCLC (59). It is important to note that our analysis includes only RNA splicing events that have already been annotated in TCGA. Thus, this leaves opportunity for further discovery of novel differential splicing events in LUSC between patients of WestAfr and Euro ancestry that are potentially associated with survival for LUSC. Among the 18 DEGs that were potentially associated with survival for LUSC were prolactin (PRL) and tyrosine aminotransferase (TAT) (PRL gene p-value 0.004, Supplementary Table 2 page 1; TAT gene p-value 0.007, Supplementary Table 2 page 1). Prolactin has been indicated as a potential negative early predictive factor for NSCLC patients treated with Nivolumab (60). TAT has been shown to be associated with hepatocellular carcinoma (HCC) in which its downregulation leads to tyrosinemia, a known HCC risk factor (61).
In the future, the findings herein should be validated in an independent, larger cohort of LUSC patients with patient-matched adjacent “normal” lung tissue specimens and include adjustments for annotation of social, psychosocial, lifestyle, environmental, and health system factors as baseline, and be extended to include LUAD patients. Future studies should incorporate transcript-level estimates of ancestry. The identified DSGs and DEGs herein provide potential new targets for development of novel biomarkers and/or therapeutics for NSCLC in patients of African ancestry. Ultimately, such precision oncology tools could have the ability to mitigate NSCLC disparities.
Supplementary Material
Highlights.
RNA splicing differs in lung squamous cell carcinoma by patient ancestry
Ancestry-related differentially spliced genes have cancer relevance
Ancestry-related differentially spliced genes have biological relevance
Ancestry-related differential splicing events associate with patient survival
Acknowledgements
We acknowledge the BioRepository & Precision Pathology Center (BRPC), a shared resource of the Duke University School of Medicine and Duke Cancer Institute, for providing access to the human biospecimens used under Institutional Review Board oversight in this work. The BRPC receives support from the P30 Cancer Center Support Grant (P30 CA014236). In addition, we acknowledge Bonnie LaCroix, laboratory manager.
Financial support
This work was supported by a V Foundation for Cancer Research/Lung Cancer Initiative of North Carolina grant to JMC PI and JAF Co-PI, developmental funds of the Duke Cancer Institute as part of the P30 Cancer Center Support Grant (Grant ID: NIH CA014236) to JMC PI and JAF Co-PI, and a Department of Defense Lung Cancer Research Program Idea Development Award – New Investigator W81XWH2010483 to JAF PI and JMC Co-I.
Footnotes
Publisher's Disclaimer: This is a PDF file of an unedited manuscript that has been accepted for publication. As a service to our customers we are providing this early version of the manuscript. The manuscript will undergo copyediting, typesetting, and review of the resulting proof before it is published in its final form. Please note that during the production process errors may be discovered which could affect the content, and all legal disclaimers that apply to the journal pertain.
The authors declare no potential conflicts of interest.
References
- 1.NIH NCI SEER Cancer Stat Facts: Lung and Bronchus Cancer. <https://seer.cancer.gov/statfacts/html/lungb.html>.
- 2.Coughlin SS, Matthews-Juarez P, Juarez PD, Melton CE, King M. Opportunities to address lung cancer disparities among African Americans. Cancer Med 2014;3(6):1467–76 10.1002/cam4.348. [DOI] [PMC free article] [PubMed] [Google Scholar]
- 3.Holford TR, Levy DT, Meza R. Comparison of Smoking History Patterns Among African American and White Cohorts in the United States Born 1890 to 1990. Nicotine Tob Res 2016;18 Suppl 1:S16–29 10.1093/ntr/ntv274. [DOI] [PMC free article] [PubMed] [Google Scholar]
- 4.Committee TPSA. 2011 TPSAC Meeting Materials and Information.
- 5.Ross KC, Dempsey DA, St Helen G, Delucchi K, Benowitz NL. The Influence of Puff Characteristics, Nicotine Dependence, and Rate of Nicotine Metabolism on Daily Nicotine Exposure in African American Smokers. Cancer Epidemiol Biomarkers Prev 2016;25(6):936–43 10.1158/1055-9965.EPI-15-1034. [DOI] [PMC free article] [PubMed] [Google Scholar]
- 6.Thun MJ, Hannan LM, Adams-Campbell LL, Boffetta P, Buring JE, Feskanich D, et al. Lung cancer occurrence in never-smokers: an analysis of 13 cohorts and 22 cancer registry studies. PLoS Med 2008;5(9):e185 10.1371/journal.pmed.0050185. [DOI] [PMC free article] [PubMed] [Google Scholar]
- 7.Park SL, Tiirikainen MI, Patel YM, Wilkens LR, Stram DO, Le Marchand L, et al. Genetic determinants of CYP2A6 activity across racial/ethnic groups with different risks of lung cancer and effect on their smoking intensity. Carcinogenesis 2016;37(3):269–79 10.1093/carcin/bgw012. [DOI] [PMC free article] [PubMed] [Google Scholar]
- 8.Hancock DB, Guo Y, Reginsson GW, Gaddis NC, Lutz SM, Sherva R, et al. Genome-wide association study across European and African American ancestries identifies a SNP in DNMT3B contributing to nicotine dependence. Mol Psychiatry 2018;23(9):1–9 10.1038/mp.2017.193. [DOI] [PMC free article] [PubMed] [Google Scholar]
- 9.Steuer CE, Behera M, Berry L, Kim S, Rossi M, Sica G, et al. Role of race in oncogenic driver prevalence and outcomes in lung adenocarcinoma: Results from the Lung Cancer Mutation Consortium. Cancer 2016;122(5):766–72 10.1002/cncr.29812. [DOI] [PMC free article] [PubMed] [Google Scholar]
- 10.Araujo LH, Lammers PE, Matthews-Smith V, Eisenberg R, Gonzalez A, Schwartz AG, et al. Somatic Mutation Spectrum of Non-Small-Cell Lung Cancer in African Americans: A Pooled Analysis. J Thorac Oncol 2015;10(10):1430–6 10.1097/JTO.0000000000000650. [DOI] [PMC free article] [PubMed] [Google Scholar]
- 11.Heath EI, Lynce F, Xiu J, Ellerbrock A, Reddy SK, Obeid E, et al. Racial Disparities in the Molecular Landscape of Cancer. Anticancer Res 2018;38(4):2235–40 10.21873/anticanres.12466. [DOI] [PMC free article] [PubMed] [Google Scholar]
- 12.Lusk CM, Watza D, Dyson G, Craig DB, Ratliff V, Wenzlaff AS, et al. Profiling the mutational landscape in known driver genes and novel genes in African American non-small cell lung cancer patients. Clin Cancer Res 2019: 10.1158/1078-0432.CCR-18-2439. [DOI] [PMC free article] [PubMed]
- 13.Campbell JD, Lathan C, Sholl L, Ducar M, Vega M, Sunkavalli A, et al. Comparison of Prevalence and Types of Mutations in Lung Cancers Among Black and White Populations. JAMA Oncol 2017;3(6):801–9 10.1001/jamaoncol.2016.6108. [DOI] [PMC free article] [PubMed] [Google Scholar]
- 14.Araujo LH, Timmers C, Bell EH, Shilo K, Lammers PE, Zhao W, et al. Genomic Characterization of Non-Small-Cell Lung Cancer in African Americans by Targeted Massively Parallel Sequencing. J Clin Oncol 2015;33(17):1966–73 10.1200/JCO.2014.59.2444. [DOI] [PMC free article] [PubMed] [Google Scholar]
- 15.Mitchell KA, Zingone A, Toulabi L, Boeckelman J, Ryan BM. Comparative Transcriptome Profiling Reveals Coding and Noncoding RNA Differences in NSCLC from African Americans and European Americans. Clin Cancer Res 2017;23(23):7412–25 10.1158/1078-0432.CCR-17-0527. [DOI] [PMC free article] [PubMed] [Google Scholar]
- 16.Climente-González H, Porta-Pardo E, Godzik A, Eyras E. The Functional Impact of Alternative Splicing in Cancer. Cell Rep 2017;20(9):2215–26 10.1016/j.celrep.2017.08.012. [DOI] [PubMed] [Google Scholar]
- 17.Robinson TJ, Freedman JA, Al Abo M, Deveaux AE, LaCroix B, Patierno BM, et al. Alternative RNA Splicing as a Potential Major Source of Untapped Molecular Targets in Precision Oncology and Cancer Disparities. Clinical cancer research : an official journal of the American Association for Cancer Research 2019. 10.1158/1078-0432.CCR-18-2445. [DOI] [PMC free article] [PubMed]
- 18.Al-Alem U, Rauscher G, Shah E, Batai K, Mahmoud A, Beisner E, et al. Association of genetic ancestry with breast cancer in ethnically diverse women from Chicago. PloS one 2014;9(11):e112916 10.1371/journal.pone.0112916. [DOI] [PMC free article] [PubMed] [Google Scholar]
- 19.Cancer Genome Atlas Research N. Comprehensive genomic characterization of squamous cell lung cancers. Nature 2012;489(7417):519–25 10.1038/nature11404. [DOI] [PMC free article] [PubMed] [Google Scholar]
- 20.Grossman RL, Heath AP, Ferretti V, Varmus HE, Lowy DR, Kibbe WA, et al. Toward a Shared Vision for Cancer Genomic Data. The New England journal of medicine 2016;375(12):1109–12 10.1056/NEJMp1607591. [DOI] [PMC free article] [PubMed] [Google Scholar]
- 21.Colaprico A, Silva TC, Olsen C, Garofano L, Cava C, Garolini D, et al. TCGAbiolinks: an R/Bioconductor package for integrative analysis of TCGA data. Nucleic acids research 2016;44(8):e71 10.1093/nar/gkv1507. [DOI] [PMC free article] [PubMed] [Google Scholar]
- 22.Anders S, Huber W. Differential expression analysis for sequence count data. Genome Biol 2010;11(10):R106 10.1186/gb-2010-11-10-r106. [DOI] [PMC free article] [PubMed] [Google Scholar]
- 23.Ryan M, Wong WC, Brown R, Akbani R, Su X, Broom B, et al. TCGASpliceSeq a compendium of alternative mRNA splicing in cancer. Nucleic acids research 2016;44(D1):D1018–22 10.1093/nar/gkv1288. [DOI] [PMC free article] [PubMed] [Google Scholar]
- 24.Ritchie ME, Phipson B, Wu D, Hu Y, Law CW, Shi W, et al. limma powers differential expression analyses for RNA-sequencing and microarray studies. Nucleic acids research 2015;43(7):e47 10.1093/nar/gkv007. [DOI] [PMC free article] [PubMed] [Google Scholar]
- 25.Benjamini Y, Hochberg Y. Controlling the false discovery rate: a practical and powerful approach to multiple testing. Journal of the Royal Statistical Society Series B 1995;57:289–300. [Google Scholar]
- 26.Mi H, Muruganujan A, Ebert D, Huang X, Thomas PD. PANTHER version 14: more genomes, a new PANTHER GO-slim and improvements in enrichment analysis tools. Nucleic Acids Res 2019;47(D1):D419–D26 10.1093/nar/gky1038. [DOI] [PMC free article] [PubMed] [Google Scholar]
- 27.Subramanian A, Tamayo P, Mootha VK, Mukherjee S, Ebert BL, Gillette MA, et al. Gene set enrichment analysis: a knowledge-based approach for interpreting genome-wide expression profiles. Proceedings of the National Academy of Sciences of the United States of America 2005;102(43):15545–50 10.1073/pnas.0506580102. [DOI] [PMC free article] [PubMed] [Google Scholar]
- 28.Mootha VK, Lindgren CM, Eriksson KF, Subramanian A, Sihag S, Lehar J, et al. PGC-1alpha-responsive genes involved in oxidative phosphorylation are coordinately downregulated in human diabetes. Nature genetics 2003;34(3):267–73 10.1038/ng1180. [DOI] [PubMed] [Google Scholar]
- 29.Therneau TM, Grambsch PM. Modeling Survival Data: Extending the Cox Model. Springer Science & Business Media; 2013. 356 p.
- 30.Team RC. R: A Language and Environment for Statistical Computing. Vienna, Austria: 2019. [Google Scholar]
- 31.Wickham H ggplot2: Elegant graphics for data analysis: Springer; 2016. [Google Scholar]
- 32.Sladky V, Schuler F, Fava LL, Villunger A. The resurrection of the PIDDosome - emerging roles in the DNA-damage response and centrosome surveillance. Journal of cell science 2017;130(22):3779–87 10.1242/jcs.203448. [DOI] [PubMed] [Google Scholar]
- 33.Shen Q, Tang W, Sun J, Feng L, Jin H, Wang X. Regulation of CRADD-caspase 2 cascade by histone deacetylase 1 in gastric cancer. American journal of translational research 2014;6(5):538–47. [PMC free article] [PubMed] [Google Scholar]
- 34.Hovanessian AG, Brown RE, Kerr IM. Synthesis of low molecular weight inhibitor of protein synthesis with enzyme from interferon-treated cells. Nature 1977;268(5620):537–40 10.1038/268537a0. [DOI] [PubMed] [Google Scholar]
- 35.Kim JC, Ha YJ, Tak KH, Roh SA, Kwon YH, Kim CW, et al. Opposite functions of GSN and OAS2 on colorectal cancer metastasis, mediating perineural and lymphovascular invasion, respectively. PloS one 2018;13(8):e0202856 10.1371/journal.pone.0202856. [DOI] [PMC free article] [PubMed] [Google Scholar]
- 36.Wang J, Wang Y, Kong F, Han R, Song W, Chen D, et al. Identification of a six-gene prognostic signature for oral squamous cell carcinoma. Journal of cellular physiology 2020;235(3):3056–68 10.1002/jcp.29210. [DOI] [PubMed] [Google Scholar]
- 37.Qiu J, Gao CL, Zhang M, Chen RH, Chi X, Liu F, et al. LYRM1, a novel gene promotes proliferation and inhibits apoptosis of preadipocytes. Eur J Endocrinol 2009;160(2):177–84 10.1530/EJE-08-0518. [DOI] [PubMed] [Google Scholar]
- 38.Yan X, Wan H, Hao X, Lan T, Li W, Xu L, et al. Importance of gene expression signatures in pancreatic cancer prognosis and the establishment of a prediction model. Cancer Manag Res 2019;11:273–83 10.2147/CMAR.S185205. [DOI] [PMC free article] [PubMed] [Google Scholar]
- 39.Strauss U, Brauer AU. Current views on regulation and function of plasticity-related genes (PRGs/LPPRs) in the brain. Biochim Biophys Acta 2013;1831(1):133–8 10.1016/j.bbalip.2012.08.010. [DOI] [PubMed] [Google Scholar]
- 40.Zang D, Zhang C, Li C, Fan Y, Li Z, Hou K, et al. LPPR4 promotes peritoneal metastasis via Sp1/integrin alpha/FAK signaling in gastric cancer. American journal of cancer research 2020;10(3):1026–44. [PMC free article] [PubMed] [Google Scholar]
- 41.Lever J, Zhao EY, Grewal J, Jones MR, Jones SJM. CancerMine: a literature-mined resource for drivers, oncogenes and tumor suppressors in cancer. Nature Methods 2019;16(6):505 10.1038/s41592-019-0422-y. [DOI] [PubMed] [Google Scholar]
- 42.Wang B-D, Ceniccola K, Hwang S, Andrawis R, Horvath A, Freedman JA, et al. Alternative splicing promotes tumour aggressiveness and drug resistance in African American prostate cancer. Nat Commun 2017;8 10.1038/ncomms15921. [DOI] [PMC free article] [PubMed] [Google Scholar]
- 43.Al-Wadei HAN, Al-Wadei MH, Schuller HM. Cooperative regulation of non-small cell lung carcinoma by nicotinic and beta-adrenergic receptors: a novel target for intervention. PLOS ONE 2012;7(1):e29915 10.1371/journal.pone.0029915. [DOI] [PMC free article] [PubMed] [Google Scholar]
- 44.Nakano Y, Wiechert S, Bánfi B. Overlapping Activities of Two Neuronal Splicing Factors Switch the GABA Effect from Excitatory to Inhibitory by Regulating REST. Cell Rep 2019;27(3):860–71. 10.1016/j.celrep.2019.03.072. [DOI] [PMC free article] [PubMed] [Google Scholar]
- 45.Weber L, Maßberg D, Becker C, Altmüller J, Ubrig B, Bonatz G, et al. Olfactory Receptors as Biomarkers in Human Breast Carcinoma Tissues. Front Oncol 2018;8:33 10.3389/fonc.2018.00033. [DOI] [PMC free article] [PubMed] [Google Scholar]
- 46.Pedersen SF, Stock C. Ion Channels and Transporters in Cancer: Pathophysiology, Regulation, and Clinical Potential. Cancer Res 2013;73(6):1658–61 10.1158/0008-5472.CAN-12-4188. [DOI] [PubMed] [Google Scholar]
- 47.Sharma A, Nguyen H, Geng C, Hinman MN, Luo G, Lou H. Calcium-mediated histone modifications regulate alternative splicing in cardiomyocytes. Proc Natl Acad Sci USA 2014;111(46):E4920–8 10.1073/pnas.1408964111. [DOI] [PMC free article] [PubMed] [Google Scholar]
- 48.Gazdar AF, Helman LJ, Israel MA, Russell EK, Linnoila RI, Mulshine JL, et al. Expression of neuroendocrine cell markers L-dopa decarboxylase, chromogranin A, and dense core granules in human tumors of endocrine and nonendocrine origin. Cancer research 1988;48(14):4078–82. [PubMed] [Google Scholar]
- 49.Wang H, Wang X, Xu L, Zhang J, Cao H. Integrated analysis of the E2F transcription factors across cancer types. Oncol Rep 2020;43(4):1133–46 10.3892/or.2020.7504. [DOI] [PMC free article] [PubMed] [Google Scholar]
- 50.Goodwin J, Neugent ML, Lee SY, Choe JH, Choi H, Jenkins DMR, et al. The distinct metabolic phenotype of lung squamous cell carcinoma defines selective vulnerability to glycolytic inhibition. Nat Commun 2017;8:15503 10.1038/ncomms15503. [DOI] [PMC free article] [PubMed] [Google Scholar]
- 51.Ferrer I, Zugazagoitia J, Herbertz S, John W, Paz-Ares L, Schmid-Bindert G. KRAS-Mutant non-small cell lung cancer: From biology to therapy. Lung Cancer 2018;124:53–64 10.1016/j.lungcan.2018.07.013. [DOI] [PubMed] [Google Scholar]
- 52.Gentile A, Trusolino L, Comoglio PM. The Met tyrosine kinase receptor in development and cancer. Cancer Metastasis Rev 2008;27(1):85–94 10.1007/s10555-007-9107-6. [DOI] [PubMed] [Google Scholar]
- 53.Frampton GM, Ali SM, Rosenzweig M, Chmielecki J, Lu X, Bauer TM, et al. Activation of MET via diverse exon 14 splicing alterations occurs in multiple tumor types and confers clinical sensitivity to MET inhibitors. Cancer Discov 2015;5(8):850–9 10.1158/2159-8290.CD-15-0285. [DOI] [PubMed] [Google Scholar]
- 54.Aird D, Teng T, Huang CL, Pazolli E, Banka D, Cheung-Ong K, et al. Sensitivity to splicing modulation of BCL2 family genes defines cancer therapeutic strategies for splicing modulators. Nat Commun 2019;10(1):137 10.1038/s41467-018-08150-5. [DOI] [PMC free article] [PubMed] [Google Scholar]
- 55.Perez-Ramirez C, Canadas-Garre M, Molina MA, Faus-Dader MJ, Calleja-Hernandez MA. PTEN and PI3K/AKT in non-small-cell lung cancer. Pharmacogenomics 2015;16(16):1843–62 10.2217/pgs.15.122. [DOI] [PubMed] [Google Scholar]
- 56.Cui J, Placzek WJ. Post-Transcriptional Regulation of Anti-Apoptotic BCL2 Family Members. Int J Mol Sci 2018;19(1) 10.3390/ijms19010308. [DOI] [PMC free article] [PubMed] [Google Scholar]
- 57.Yang S, Liu Y, Li MY, Ng CSH, Yang SL, Wang S, et al. FOXP3 promotes tumor growth and metastasis by activating Wnt/beta-catenin signaling pathway and EMT in non-small cell lung cancer. Molecular cancer 2017;16(1):124 10.1186/s12943-017-0700-1. [DOI] [PMC free article] [PubMed] [Google Scholar]
- 58.Giatromanolaki A, Banham AH, Harris AL, Koukourakis MI. FOXP3 infiltrating lymphocyte density and PD-L1 expression in operable non-small cell lung carcinoma. Exp Lung Res 2019;45(3–4):76–83 10.1080/01902148.2019.1617371. [DOI] [PubMed] [Google Scholar]
- 59.Li Y, Sun N, Lu Z, Sun S, Huang J, Chen Z, et al. Prognostic alternative mRNA splicing signature in non-small cell lung cancer. Cancer Letters 2017;393:40–51 10.1016/j.canlet.2017.02.016. [DOI] [PubMed] [Google Scholar]
- 60.Caponnetto S, Iannantuono GM, Barchiesi G, Magri V, Gelibter A, Cortesi E. Prolactin as a Potential Early Predictive Factor in Metastatic Non-Small Cell Lung Cancer Patients Treated with Nivolumab. Oncology 2017;93(1):62–6 10.1159/000464328. [DOI] [PubMed] [Google Scholar]
- 61.Fu L, Dong SS, Xie YW, Tai LS, Chen L, Kong KL, et al. Down-regulation of tyrosine aminotransferase at a frequently deleted region 16q22 contributes to the pathogenesis of hepatocellular carcinoma. Hepatology 2010;51(5):1624–34 10.1002/hep.23540. [DOI] [PubMed] [Google Scholar]
Associated Data
This section collects any data citations, data availability statements, or supplementary materials included in this article.