

Abstract
The main objective of this research was to disclose the correlative contribution of urban-associated factors affecting the COVID-19 outbreak in the macro-scale of MECA countries and the downscaled micro-scale of the provincial divisions in Iran. For this purpose, the correlation coefficients between the variables and clustering analysis were used to expose the possible effects. Results revealed the comparatively strong relationships between some independent variables (e.g., total greenhouse gas emissions, CO2 emissions, nitrous oxide emissions, and urban population) and confirmed cases (R from 0.619 to 0.695), demonstrating the possible effective role of urbanization and its induced GHG emissions on the COVID-19 outbreak in the country level of the MECA region. Therefore, the results significantly confirmed the strong relationships between some independent variables (e.g., total population, urban population, fuel consumption, NO2–CO2 emissions, energy use, and total intra-changed travels) and confirmed cases (R from 0.724 to 0.945), explaining an explicit relationship between urbanization processes and the COVID-19 outbreak in Iran. Besides, the HCA results revealed the substantial role of the urban population and urban-induced energy use and gas emission in clustering locations regarding the COVID-19 outbreak in both the MECA region and Iran. The main implication of this research is to give a practical correlation between Coronavirus infection and urban constitution, aiming to increase the health of urban societies by creating effective planning in the future.
Keywords: COVID-19 outbreak, Clustering analysis, Greenhouse gas (GHG) emissions, Population, Urbanization
Introduction
During the last decades, we faced plentiful studies associating the urbanization growth with some environmental, social, and health issues. For instance, the urbanization role on carbon emission has been investigated repetitively by researchers (e.g., Cordell et al., 2009; Dhakal, 2010; Zarzoso & Maruotti, 2011; Liddle, 2011; Zhu et al., 2012; Jorgenson, 2012; Knight et al., 2013), revealing the significant contribution of urban regions to CO2 emissions in the national and global scales. Similar correlative researches have been probed between urban growth and social behavior (e.g., De Meester et al., 2013; Gehl et al., 2006; Şatir & Korkmaz, 2005). Meanwhile, the effects of urbanization on human health issues such as the obesity prevalence (Eid et al., 2008; Feng et al., 2010) have been carried out to understand physical and environmental factors affecting population health (Mackenbach et al., 2014).
At the end of 2019, a novel Coronavirus, namely SARS-CoV-2, resulted in an acute respiratory illness epidemic in Wuhan, China, which was defined as Coronavirus Disease 2019 (COVID-19) by the World Health Organization (WHO) (Alhazzani et al., 2020). After this outbreak, the nature of living and working patterns in the urban areas was transformed into new challenges (Salama et al., 2020; Acuto, 2020). For example, by the ongoing COVID-19 pandemic, the densely urban spaces were nearly defenseless in terms of disease outbreaks because the pandemic status affected the millions of inhabitants, living in the compressed urban regions (Desai, 2020). The urban areas as the hubs for transnational commerce and mobility and densely populated regions can magnify the pandemic risks (Manawadu et al., 2020). Even, the sprawled cities (with a lower density of population) can be characterized as responsive to high mobility that is the susceptible status regarding the initial pandemic spread (Aguilar et al., 2020).
Owing to the historical experiences of the 1918 influenza pandemic, Garrett (2007) has reported a positive and significant relationship between the mortality rates and the state-level population density in the USA, while Mills et al. (2004) have noted no significant associations between mortality rate and population density in the US large cities (Hamidi et al., 2020). Hence, the different relations between the pandemic spread and urban variables are complex and need more multi-variable analysis. During the last year of 2020, many studies were carried out regarding the COVID-19 pandemic. For instance, several studies have focused on the influences of COVID-19 outbreak on the urban activities, systems, processes, and health (e.g., Chapman & Tsuji, 2020; Fatmi, 2020; Feng et al., 2020; Girdhar et al., 2020). In the vice versa, some scholars have addressed the possible links between urban air pollution and illness outbreaks in the different regions and countries (e.g., Conticini et al., 2020; Magazzino et al., 2020; Ogen, 2020; Travaglio et al., 2020; Yongjian et al., 2020). The aforementioned studies have found that several factors could be associated with an increased risk of COVID-19 cases in the world.
Nevertheless, the lack of sufficient similar studies is the main research problem for the Middle East, Central Asia, and Iran territories. In addition, insufficient works have also exposed different inexperienced and initial results. For example, in Iran, some initial works have attempted to disclose the GIS-based hotspot maps for the COVID-19 outbreak in Iran in the last months based on the limited rate of infected and confirmed cases (e.g., Mahmoudzadeh & Daneshvar, 2020; Mazar et al., 2020). In this regard, some possible effective factors on the COVID-19 outbreak have been explained such as high-level population density (Ahmadi et al., 2020). Furthermore, some clinical studies, with limited hospital-based data, have been performed to indicate the role of physical characteristics of the human body on confirmed and suspected COVID-19 cases such as age and sex (e.g., Nikpouraghdam et al., 2020; Zali et al., 2020).
Hence, the main novelty of the present study is to assess the contribution of urban-associated factors affecting the COVID-19 outbreak in the country level of the Middle East and Central Asia (MECA) countries and in the provincial level of Iran, which has not been investigated in the previous works. It seems that the world is still fighting COVID-19 and the severity of the crisis varies by place to place (Hu, 2020). Then, more studies in different regions should be carried out to recognize the complexity of the pandemic status and its influencing factors. Now, the main hypothesis of the research is retained as the urbanization and its related population and processes (e.g., GHG emissions) have a positive association with the pandemic status of COVID-19 outbreak in both scales of the MECA region and Iran.
Data and methods
Study area
In this research, we obtained two levels of study areas. In the first level and according to the International Monetary Fund (IMF) dataset, the Middle East and Central Asia (MECA) region is defined as the economic issues (IMF, 2017). The MECA region, including 26 countries of Afghanistan, Armenia, Azerbaijan, Bahrain, Cyprus, Egypt, Georgia, Iran, Iraq, Israel, Jordan, Kazakhstan, Kuwait, Kyrgyzstan, Lebanon, Oman, Pakistan, Qatar, Saudi Arabia, Syria, Tajikistan, Turkey, Turkmenistan, United Arab Emirates (UAE), Uzbekistan, and Yemen, is located between 10°–45° N latitude and 24°–88° E longitude (Ghanbari & Daneshvar, 2020). Among these countries, three countries of Cyprus, Turkmenistan, and Yemen were removed due to a lack of sufficient data for COVID-19 confirmed cases (Fig. 1). In the second level, the provincial divisions in Iran are assumed to further comparative and correlative research, including 31 provinces (Fig. 2).
Fig. 1.

Geographical distribution of the MECA countries concerning a total urban population in 2019 and b total confirmed cases of COVID-19 in December 31, 2020
Fig. 2.
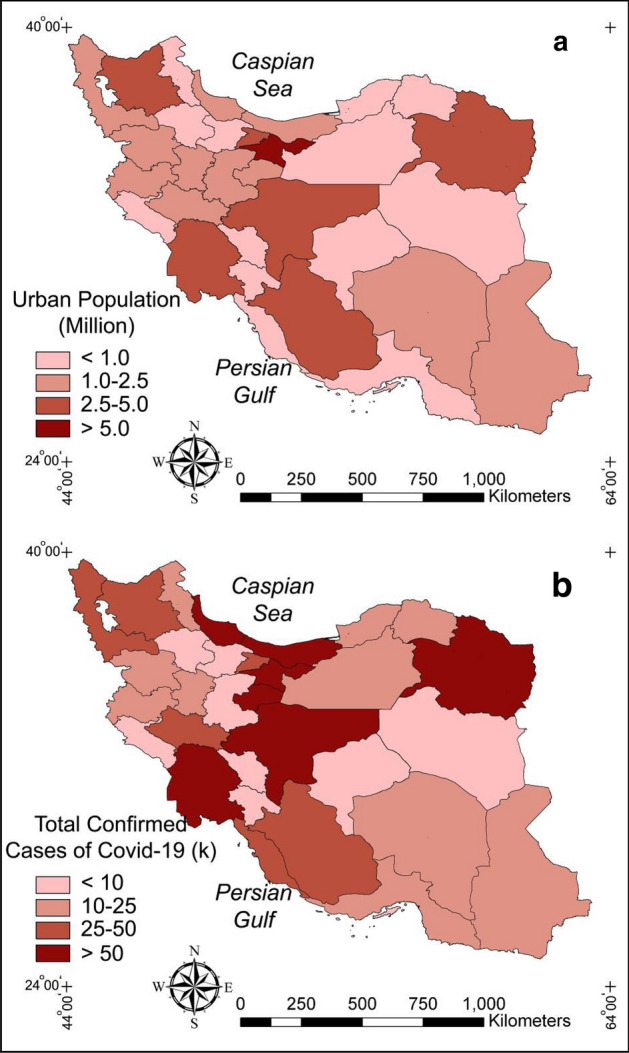
Geographical distribution of the provincial divisions of Iran concerning a total urban population in 2019 and b total confirmed cases of COVID-19 in December 31, 2020
Data preparation
Based on two levels of the study areas, we were obliged to consider all dependent and independent variables in the international (MECA countries) and national (Iran) scales. The dependent variables relate to total deaths and confirmed cases of COVID-19 up to December 31, 2020, which were collected on the international scale from Coronavirus source data as a collection of the COVID-19 data maintained by Our World in Data (OWID, 2020) via https://ourworldindata.org/coronavirus-source-data. However, the announcement of the confirmed cases on the national scale for Iran has been restricted on March 23, 2020, due to governmental decision (https://www.irna.ir/news/83725207). Hence, we estimated the cumulative confirmed cases for each province based on the latest official report of confirmed cases via https://www.worldometers.info/coronavirus/country/iran in addition to the sample daily/ weekly update (WHO, 2020) and risk status of COVID-19 in Iran via http://www.emro.who.int/irn/iran-news.
The independent variables in the scale of MECA countries were assumed as the latest annual data extracted from the World Bank (2020). On this basis, ten variables, namely land area (km2), total population (inhabitants), urban population (inhabitants), urban population growth (annual %), the population in urban agglomerations of more than 1 million (% of the total population), CO2 emissions (kt), methane emissions (kt of CO2 equivalent), nitrous oxide emissions (kt of CO2 equivalent), total greenhouse gas emissions (kt of CO2 equivalent), and energy use (kt of oil equivalent), were collected from the World development indicators of the World Bank datasets via https://databank.worldbank.org/source/world-development-indicators. The mentioned variables, which were dominantly related to the urban development and its emission indicators, were prepared based on the latest time scale (dominantly in 2018) and were arranged for 23 countries of the MECA region (Table 1). Meanwhile, the main sources for urban development and emission databases could be considered from the latest revision of world urbanization prospects via http://esa.un.org/unpd/wup (WUP, 2018) and statistical data of greenhouse gas emissions via http://edgar.jrc.ec.europa.eu (EDGAR, 2018).
Table 1.
Dependent variables based on the COVID-19 dataset for the MECA countries (up to December 31, 2020)
| Country name | COVID-19 total confirmed cases | COVID-19 total deaths |
|---|---|---|
| Afghanistan | 51,526 | 2191 |
| Armenia | 159,409 | 2823 |
| Azerbaijan | 218,700 | 2641 |
| Bahrain | 92,675 | 352 |
| Egypt | 138,062 | 7631 |
| Georgia | 227,420 | 2505 |
| Iran | 1,225,142 | 55,223 |
| Iraq | 595,291 | 12,813 |
| Israel | 423,262 | 3325 |
| Jordan | 294,494 | 3834 |
| Kazakhstan | 201,196 | 2761 |
| Kuwait | 150,584 | 934 |
| Kyrgyzstan | 81,034 | 1355 |
| Lebanon | 181,503 | 1468 |
| Oman | 128,867 | 1499 |
| Pakistan | 482,178 | 10,176 |
| Qatar | 143,834 | 245 |
| Saudi | 362,741 | 6223 |
| Syria | 11,434 | 711 |
| Tajikistan | 13,296 | 90 |
| Turkey | 2,208,652 | 20,881 |
| UAE | 207,822 | 669 |
| Uzbekistan | 77,060 | 614 |
| Total | 7,676,182 | 140,964 |
The independent variables in the scale of provincial divisions of Iran were also obtained from official reports of national statistics such as the balance sheet of the energy use in Iran extracted from the Iranian Ministry of Energy via https://isn.moe.gov.ir/Statistical-Reports (MOE, 2019), the GIS-based statistics of the population data gathered from Statistical Center of Iran via https://www.amar.org.ir/english/Iran-Statistical-Yearbook (SCI, 2018), and the transportation yearbook obtained from Iranian Road Maintenance and Transportation Organization via http://rmto.ir/Pages/SalnameAmari.aspx (RMTO, 2019). In this regard, ten variables were attained including land area (km2), total population (inhabitants), urban population (inhabitants), urban points (no.), urban density (no. per km2), fuel consumption (m3), energy use (kt), total intra-changed travels (travel), CO2 emissions (kt), and NO2 emissions (kt).
Data analysis
Based on the main objective of this research, regarding the correlative contribution of urban-associated factors to the COVID-19 confirmed cases, the geographical distribution of the total urban population in 2019 and total confirmed cases of COVID-19 on December 31, 2020, was represented as the sample spatial visualization of the variables for MECA countries and provincial divisions of Iran (Figs. 1 and 2). The correlation coefficients were used between the dependent and independent variables using the Pearson test in SPSS, exposing the possible direct effects. According to these correlation matrices, a hierarchical clustering analysis (HCA) was used to cluster the cases (23 countries or 31 provinces) based on the variables. In this regard, the Euclidean distance measure for the variables and Ward’s method for the linkage rule were used for the clustering procedure. A similar procedure has reported by Ghanbari and Daneshvar (2020). The clustering analysis was assumed based on all 10 independent variables in addition to one dependent variable (confirmed cases) in the scales of the MECA region and Iran.
Results and discussion
Analyses of the country level of the MECA region
Estimation of the variables
On December 31, 2020, the COVID-19 outbreak was recorded in 23 countries of the MECA region by a total of 7,676,172 confirmed cases and 140,964 total deaths (OWID, 2020). Iran with a total of 1,225,142 confirmed cases and 55,223 total deaths is the most injured country in the region, which has been affected seriously by pandemic status with 16% and 39% of total confirmed cases and mortality rates of the MECA countries. Based on the confirmed cases above 300 k, six countries of Turkey, Iran, Iraq, Pakistan, Israel, and Saudi Arabia reflected the overall confirmed cases of COVID-19 by 69% of the total region (Table 1). Meanwhile, based on the total deaths above 5 k, six countries of Iran, Turkey, Iraq, Pakistan, Egypt, and Saudi Arabia have represented approximately 80% of the total mortality rate of the study area.
Synchronizing, six countries of Turkey, Iran, Iraq, Pakistan, Israel, and Saudi Arabia have the highest total greenhouse gas (GHG) emissions with a total of 2586 Mt of CO2 equivalents (60% of the study area). This fact has been reported for three countries of Iran, Turkey, and Saudi Arabia by Ghanbari and Daneshvar (2020), describing the contribution of mentioned countries to high-level total GHG emissions, CO2 emissions, and energy use of the MECA region. According to Table 2, the overall contribution of six countries to the total urban population and total urban-based energy use of the MECA region is recorded as 264.5 million habitants (66% of the study area) and 734.2 Mt of oil equivalent (62% of the study area), respectively. Some other urban-associated indicators are presented in Table 2 like as urban population growth, the population in urban agglomerations, methane, and nitrous oxide emissions. For instance, the highest amount of the total urban population, methane, and nitrous oxide emissions belong to Pakistan, Turkey, and Iran by 45–50% of the study area. Therefore, the highest level of urban population growth and population in urban agglomerations belongs to some globalized high-income countries of Bahrain, Oman, Kuwait, and UAE.
Table 2.
Independent variables based on the annual world development indicators for the MECA countries
| Country name | Land area | Total population | Urban population | Urban population growth | Population in urban agglomerations | CO2 emissions | Methane emissions | Nitrous oxide emissions | Total greenhouse gas emissions | Energy use |
|---|---|---|---|---|---|---|---|---|---|---|
| Afghanistan | 652,860 | 38,928,341 | 9,477,100 | 3.32 | 11 | 8672 | 13,763 | 3424 | 40,429 | 4500 |
| Armenia | 28,470 | 2,963,234 | 1,864,017 | 0.31 | 37 | 5156 | 3426 | 1023 | 11,817 | 2959 |
| Azerbaijan | 82,670 | 10,139,175 | 5,534,464 | 1.47 | 23 | 37,620 | 19,955 | 2673 | 54,830 | 14,322 |
| Bahrain | 778 | 1,701,583 | 1,401,305 | 4.59 | 0 | 31,694 | 3379 | 131 | 35,085 | 14,158 |
| Egypt | 995,450 | 102,334,403 | 42,030,812 | 2.04 | 26 | 238,560 | 51,977 | 25,110 | 283,632 | 74,826 |
| Georgia | 69,490 | 3,989,175 | 2,184,950 | 0.53 | 29 | 10,128 | 5019 | 2352 | 20,418 | 4390 |
| Iran | 1,628,760 | 83,992,953 | 61,266,765 | 2.01 | 26 | 661,710 | 121,298 | 25,191 | 790,647 | 237,075 |
| Iraq | 434,128 | 40,222,503 | 27,085,311 | 2.54 | 25 | 190,061 | 24,351 | 5007 | 221,790 | 49,481 |
| Israel | 21,640 | 8,655,541 | 8,209,306 | 1.99 | 58 | 65,166 | 3416 | 1751 | 74,273 | 22,696 |
| Jordan | 88,780 | 10,203,140 | 9,057,879 | 1.70 | 21 | 25,108 | 2115 | 605 | 29,548 | 8180 |
| Kazakhstan | 2,699,700 | 18,776,707 | 10,495,828 | 1.49 | 16 | 247,207 | 71,350 | 17,822 | 391,007 | 76,667 |
| Kuwait | 17,820 | 4,270,563 | 4,137,312 | 1.67 | 73 | 98,734 | 12,691 | 704 | 108,563 | 33,879 |
| Kyrgyzstan | 191,800 | 6,524,191 | 2,298,401 | 2.76 | 0 | 9787 | 4291 | 1567 | 17,999 | 3795 |
| Lebanon | 10,230 | 6,825,442 | 6,067,668 | 0.29 | 35 | 24,796 | 1150 | 462 | 27,155 | 7494 |
| Oman | 309,500 | 5,106,622 | 4,082,797 | 4.03 | 30 | 63,457 | 16,858 | 1146 | 84,602 | 24,327 |
| Pakistan | 770,880 | 220,892,331 | 77,810,763 | 2.68 | 20 | 201,150 | 158,337 | 30,651 | 368,460 | 89,887 |
| Qatar | 11,610 | 2,881,060 | 2,757,615 | 1.85 | 0 | 103,259 | 41,124 | 339 | 130,969 | 44,076 |
| Saudi | 2,149,690 | 34,813,867 | 28,255,384 | 1.94 | 48 | 563,449 | 62,903 | 6517 | 631,428 | 213,505 |
| Syria | 183,630 | 17,500,657 | 9,156,781 | 2.17 | 32 | 28,830 | 12,783 | 6001 | 39,458 | 10,802 |
| Tajikistan | 138,790 | 9,537,642 | 2,469,421 | 3.03 | 0 | 5310 | 5408 | 1848 | 26,443 | 2805 |
| Turkey | 769,630 | 84,339,067 | 61,857,510 | 1.99 | 37 | 372,725 | 78,853 | 35,612 | 499,268 | 121,541 |
| UAE | 71,020 | 9,890,400 | 8,332,898 | 1.75 | 61 | 206,324 | 26,120 | 2413 | 252,656 | 70,474 |
| Uzbekistan | 425,400 | 33,469,199 | 16,635,580 | 1.79 | 7 | 91,811 | 47,333 | 13,192 | 153,272 | 43,660 |
| Total | 11,752,726 | 757,957,796 | 402,469,867 | 47.92 | 614 | 3,290,714 | 787,898 | 185,541 | 4,293,749 | 1,175,499 |
Correlation coefficients
The possible relationships between the COVID-19 outbreak and influencing indicators are investigated in this section. On this basis, the Pearson test was applied to correlate dependent and independent variables in the country scale of MECA countries (Table 3). The results significantly (at the confidence level of 99%) confirmed the comparatively strong relationships, with the positive and direct associations, between some independent variables (i.e., total greenhouse gas emissions, CO2 emissions, nitrous oxide emissions, and urban population) and confirmed cases (R from 0.619 to 0.695). The wind-rose diagram for the aforementioned relationships between confirmed cases of COVID-19 and ten independent variables in the MECA countries is plotted in Fig. 3, revealing the possible role of total GHG, CO2, and nitrous oxide emissions from urban areas in the illness outbreak.
Table 3.
The correlations between independent variables and total confirmed cases of COVID-19 among the MECA countries
| Indicators | Test | Total confirmed cases |
|---|---|---|
| Land area | R | 0.268 |
| Sig | 0.216 | |
| Total population | R | 0.409 |
| Sig | 0.053 | |
| Urban population | R | 0.695 |
| Sig | 0.000 | |
| Urban population growth | R | − 0.068 |
| Sig | 0.758 | |
| Population in urban agglomerations | R | 0.193 |
| Sig | 0.378 | |
| CO2 emissions | R | 0.619 |
| Sig | 0.002 | |
| Methane emissions | R | 0.511 |
| Sig | 0.013 | |
| Nitrous oxide emissions | R | 0.684 |
| Sig | 0.000 | |
| Total greenhouse gas emissions | R | 0.642 |
| Sig | 0.001 | |
| Energy use | R | 0.580 |
| Sig | 0.004 |
No. of country cases: 23
Fig. 3.

A wind-rose diagram for the relationships between total confirmed cases of COVID-19 and ten independent variables in the MECA countries
Hence, at the country level of the MECA region, the COVID-19 outbreak could be dependent on urbanization and its induced GHG emissions. Therefore, the moderate relationships, with the positive and direct associations, were estimated between some other independent variables (i.e., energy use, methane emissions, and total population) and confirmed cases (R from 0.409 to 0.580). This fact perhaps describes the direct effect of the unsustainable urbanization processes (i.e., high demand for energy and high emission of air pollutions) on the COVID-19 outbreak. Contrarily, the meaningless relationships were observed between confirmed cases and three independent variables (i.e., land area, the population in urban agglomerations, and urban population growth). Meanwhile, due to the natural dependence between total confirmed cases and total deaths caused by COVID-19, which was obtained as a correlation coefficient of 0.705 at the confidence level of 99% in Table 4, the main dependent variable is assumed as total confirmed cases in the next sections of the research.
Table 4.
The correlations between total deaths and total confirmed cases of COVID-19 among the MECA countries
| Indicators | Test | Total confirmed cases |
|---|---|---|
| Total deaths | R | 0.705 |
| Sig | 0.000 | |
| N | 23 |
Clustering analysis
Based on the hierarchical clustering analysis (HCA), the MECA countries were clustered as a dendrogram plot (Fig. 4). On this basis, 23 countries were classified based on one dependent and ten independent variables in three clusters from A to C. In the first cluster, four countries of Iran, Turkey, Egypt, and Pakistan revealed a group with a high concentration of urbanization and confirmed cases of COVID-19 in the MECA region, which are susceptible areas for infection spread affected by respiratory disease. The main characteristic of these countries depends on their large amount of urban population share from the total urban population of the study region (above than 60%). In adding up, the share of the total population in these countries is higher than 65% of the total population in 23 countries. Hence, the HCA result indicates the substantial role of the total population and urban population in clustering countries regarding the COVID-19 outbreak.
Fig. 4.

Clustering dendrogram of the MECA countries based on the inter-group relations between urbanism and the COVID-19 infections
Analyses of the province level of Iran
Estimation of the variables
Based on the latest official report of confirmed cases in Iran, the total confirmed cases and deaths caused by the COVID-19 have been reported as 1225.1 k and 55.2 k, respectively. Among 31 provincial divisions in Iran, the highest confirmed cases above 50 k belong to seven provinces of Tehran, Khuzestan, Khorasan-Razavi, Esfahan, Gilan, Qom, and Mazandaran with overall confirmed cases of COVID-19 as 65% of the country (Table 5).
Table 5.
Dependent variable based on the COVID-19 dataset for the provincial divisions of Iran (up to December 31, 2020)
| Province name | COVID-19 total confirmed cases |
|---|---|
| Alborz | 27,000 |
| Ardabil | 10,000 |
| Azarbaijan-G | 31,000 |
| Azarbaijan-S | 37,000 |
| Bushehr | 45,000 |
| Chaharmahal-B | 3000 |
| Esfahan | 73,000 |
| Fars | 42,000 |
| Gilan | 68,000 |
| Golestan | 23,000 |
| Hamedan | 16,000 |
| Hormozgan | 13,000 |
| Ilam | 7000 |
| Kerman | 12,000 |
| Kermanshah | 21,000 |
| Khorasan-J | 2000 |
| Khorasan-R | 111,000 |
| Khorasna-S | 19,000 |
| Khuzestan | 115,000 |
| Kohgiluyeh-B | 3000 |
| Kordestan | 18,000 |
| Lorestan | 42,000 |
| Markazi | 9000 |
| Mazandaran | 58,000 |
| Qazvin | 4000 |
| Qom | 59,000 |
| Semnan | 11,000 |
| Sistan-B | 22,000 |
| Tehran | 311,000 |
| Yazd | 5000 |
| Zanjan | 8000 |
| Total | 1,225,000 |
These seven provinces have the most provincial contribution to the total population and urban population settlements with nearby 46% (36.6 million inhabitants) and 51% (29.9 million inhabitants), respectively (Table 6). Indeed, these provinces are involved in the highest values of national CO2 emissions with 252 Mt of CO2 equivalents (49% of national emissions), the highest values of national fuel consumption with 12.9 M m3 (50% of national consumptions), and the highest values of total intra-changed travels with 64,949 travels (44% of national travels).
Table 6.
Independent variables based on the annual national development indicators for the provincial divisions of Iran
| Country name | Land area | Total population | Urban population | Urban points | Urban density | Fuel consumption | Energy use | Total intra-changed travels | CO2 emissions | NO2 emissions |
|---|---|---|---|---|---|---|---|---|---|---|
| Alborz | 5833 | 2,712,400 | 2,512,737 | 18 | 0.31 | 957,616 | 2984 | 6600 | 16,274 | 930 |
| Ardabil | 17,800 | 1,270,420 | 866,034 | 28 | 0.16 | 299,894 | 1365 | 1969 | 3811 | 82 |
| Azarbaijan-G | 37,411 | 3,265,219 | 2,136,203 | 44 | 0.12 | 766,254 | 3420 | 5444 | 13,061 | 201 |
| Azarbaijan-S | 45,651 | 3,909,652 | 2,809,424 | 65 | 0.14 | 949,688 | 5717 | 5118 | 23,458 | 480 |
| Bushehr | 23,198 | 1,163,400 | 835,955 | 39 | 0.17 | 489,101 | 12,227 | 2914 | 25,595 | 618 |
| Chaharmahal-B | 16,328 | 947,763 | 607,444 | 41 | 0.25 | 247,317 | 1049 | 4389 | 3791 | 122 |
| Esfahan | 107,018 | 5,120,850 | 4,507,309 | 109 | 0.10 | 1,894,061 | 10,779 | 11,917 | 51,209 | 918 |
| Fars | 122,608 | 4,851,274 | 3,401,675 | 104 | 0.08 | 1,716,506 | 4868 | 10,409 | 29,108 | 346 |
| Gilan | 14,042 | 2,530,696 | 1,603,026 | 55 | 0.39 | 941,259 | 2911 | 4576 | 20,246 | 1005 |
| Golestan | 20,117 | 1,868,619 | 995,615 | 32 | 0.16 | 396,143 | 1742 | 3309 | 5606 | 95 |
| Hamedan | 20,173 | 1,758,268 | 1,097,217 | 31 | 0.15 | 445,700 | 2250 | 4016 | 12,308 | 236 |
| Hormozgan | 70,697 | 1,776,415 | 971,822 | 40 | 0.06 | 730,721 | 1131 | 1626 | 21,317 | 132 |
| Ilam | 20,103 | 580,158 | 395,263 | 26 | 0.13 | 165,751 | 502 | 2578 | 1740 | 31 |
| Kerman | 183,285 | 3,164,718 | 1,858,587 | 74 | 0.04 | 1,125,013 | 2263 | 6421 | 18,988 | 90 |
| Kermanshah | 24,998 | 1,952,434 | 1,468,615 | 34 | 0.14 | 446,740 | 2480 | 3658 | 9762 | 200 |
| Khorasan-J | 151,193 | 768,898 | 453,827 | 30 | 0.02 | 239,825 | 490 | 1881 | 2307 | 5 |
| Khorasan-R | 118,018 | 6,434,501 | 4,700,924 | 78 | 0.07 | 1,772,099 | 6792 | 19,408 | 38,607 | 373 |
| Khorasna-S | 28,434 | 863,092 | 484,346 | 24 | 0.08 | 179,756 | 1466 | 2275 | 3452 | 33 |
| Khuzestan | 64,055 | 4,710,509 | 3,554,205 | 82 | 0.13 | 1,321,217 | 12,049 | 5466 | 37,684 | 728 |
| Kohgiluyeh-B | 15,504 | 713,052 | 397,461 | 18 | 0.12 | 183,795 | 456 | 1017 | 1426 | 18 |
| Kordestan | 29,137 | 1,603,011 | 1,134,229 | 31 | 0.11 | 392,162 | 1775 | 3220 | 8015 | 121 |
| Lorestan | 28,294 | 1,760,649 | 1,134,908 | 28 | 0.10 | 389,055 | 1326 | 2390 | 5282 | 67 |
| Markazi | 29,127 | 1,429,475 | 1,099,764 | 36 | 0.12 | 460,409 | 2859 | 2077 | 17,154 | 326 |
| Mazandaran | 23,756 | 3,283,582 | 1,897,238 | 61 | 0.26 | 1,387,065 | 4472 | 5166 | 26,269 | 779 |
| Qazvin | 15,567 | 1,273,761 | 952,149 | 27 | 0.17 | 447,494 | 2125 | 2793 | 15,285 | 396 |
| Qom | 11,240 | 1,292,283 | 1,229,964 | 8 | 0.07 | 455,286 | 1363 | 1957 | 11,631 | 158 |
| Semnan | 97,491 | 702,360 | 560,502 | 21 | 0.02 | 281,242 | 1276 | 1618 | 3512 | 12 |
| Sistan-B | 180,726 | 2,775,014 | 1,345,642 | 39 | 0.02 | 878,952 | 10 | 5104 | 5550 | 12 |
| Tehran | 18,814 | 13,267,637 | 12,452,230 | 48 | 0.26 | 5,165,078 | 15,455 | 16,459 | 66,338 | 3177 |
| Yazd | 73,477 | 1,138,533 | 971,355 | 23 | 0.03 | 483,400 | 3086 | 1505 | 10,247 | 55 |
| Zanjan | 19,164 | 1,057,461 | 711,177 | 23 | 0.12 | 307,396 | 1478 | 1294 | 4230 | 68 |
| Total | 1,633,259 | 79,946,104 | 59,146,847 | 1317 | – | 25,915,995 | 112,166 | 148,574 | 513,262 | 11,815 |
Other urban-associated indicators are presented in Table 6 like energy use, NO2 emissions, urban point numbers, and urban density. For example, the highest amount of NO2 emissions belongs to the aforementioned seven provinces by 60% of the total national emissions. Gilan province has the highest value of urban density with 0.39 no. per km2. Tehran and Bushehr provinces have the highest amount of national energy use by 25% of the national level (27.7 Mt). Furthermore, the large value of urban point numbers belongs to Esfahan province with 109 urban points.
Correlation coefficients
Based on Table 7, the correlations were estimated between independent variables and total confirmed cases of the COVID-19 among the provinces of Iran. The results significantly (at the confidence level of 99%) confirmed the very strong and strong relationships, with the positive and direct associations, between some independent variables (i.e., total population, urban population, fuel consumption, NO2 and CO2 emissions, energy use, and total intra-changed travels) and confirmed cases (R from 0.724 to 0.945). Based on a wind-rose diagram for the relationships between confirmed cases of COVID-19 and ten independent variables in Iran, a strong relationship was observed between confirmed cases and the urban population (Fig. 5). Hence, in the province level of Iran, the COVID-19 outbreak certainly depends on urbanization and its population abundance. Therefore, there are weak relationships, with the positive and direct associations, between some other independent variables (i.e., urban density and urban point numbers) and total confirmed cases (R from 0.305 to 0.346). Contrarily, a meaningless relationship was observed between confirmed cases and land area. Hence, the COVID-19 outbreak in Iran has no sufficient significant correlation with physical indicators such as land area, urban density, and urban point numbers.
Table 7.
The correlations between independent variables and total confirmed cases of COVID-19 among the provinces of Iran
| Indicators | Test | Total confirmed cases |
|---|---|---|
| Land area | R | − 0.055 |
| Sig | 0.771 | |
| Total population | R | 0.925 |
| Sig | 0.000 | |
| Urban population | R | 0.945 |
| Sig | 0.000 | |
| Urban points | R | 0.346 |
| Sig | 0.056 | |
| Urban density | R | 0.305 |
| Sig | 0.096 | |
| CO2 emissions | R | 0.830 |
| Sig | 0.000 | |
| NO2 emissions | R | 0.905 |
| Sig | 0.000 | |
| Fuel consumption | R | 0.928 |
| Sig | 0.000 | |
| Total intra-changed travels | R | 0.724 |
| Sig | 0.000 | |
| Energy use | R | 0.787 |
| Sig | 0.000 |
No. of province cases: 31
Fig. 5.

A wind-rose diagram for the relationships between total confirmed cases of COVID-19 and ten independent variables in the Iran provinces
Clustering analysis
The provinces in Iran were clustered as a dendrogram plot using HCA (Fig. 6). On this basis, 31 provinces were classified based on one dependent and ten independent variables in three clusters from A to C. The first cluster, including only Tehran province, revealed a great populated and urbanized region of Iran with the most confirmed cases of COVID-19 on the national scale. Tehran has the highest rate of air pollutions, inversions, CO2, and total GHG emissions in Iran (e.g., Daneshvar & Abadi, 2017; Khalesi & Daneshvar, 2020) so that is very susceptible to the spread of any pandemic status with health issues.
Fig. 6.

Clustering dendrogram of the provincial divisions of Iran based on the inter-group relations between urbanism and the COVID-19 infections
Meanwhile, 11 and 19 provinces in clusters B and C were clustered, respectively. Later then, Tehran, Khorasan-Razavi, Khuzestan, and Esfahan provinces have the highest confirmed cases of COVID-19 and the large amounts of urban population fuel consumptions, and NO2–CO2 emissions. In summarizing, the HCA in the province level of Iran revealed the substantial role of the urban populations and urban-associated pollutant gas emissions in clustering provinces regarding the COVID-19 outbreak.
Discussion
The MECA region has contributed to ~9% of the total population in the World in 2019 (World Bank, 2020). At the end of December 31, 2020, this region has also contributed to ~9% of the total confirmed cases of COVID-19 (OWID, 2020). Some recent investigations regarding (MECA) countries have demonstrated the greenhouse gas (GHG) emissions from urban origins above 80% (Ghanbari & Daneshvar, 2020; Tavakoli et al., 2016). Accordingly, the International Energy Agency has reported that about 90% of the urban-based CO2 emissions can belong to developing countries (IEA, 2018) such as MECA countries. Hence, the MECA region is an attractive place to study pandemic status. Among this region, Iran has contributed to ~10% of the total population and ~16% of confirmed cases of COVID-19, exposing a risky condition in comparison with other countries.
The present paper attempted to discover the influencing factors on the illness outbreak based on the statistical analysis on different levels. In the first level, results exposed that six countries of Turkey, Iran, Iraq, Pakistan, Israel, and Saudi Arabia, contributing to the urban population by 66%, greenhouse gas (GHG) emissions by 60%, and urban-based energy use of the MECA region by 62%, have earmarked 69% (5,297,266 cases) of overall confirmed cases of COVID-19 in the study area. Accordingly, statistical examination revealed the comparatively strong positive and direct relationships between total confirmed cases and some independent variables such as total greenhouse gas emissions, CO2 emissions, nitrous oxide emissions, and urban population (R from 0.619 to 0.695). Hence, at the country level of the MECA region, the COVID-19 outbreak could be dependent on urbanization and its induced GHG, CO, and NO2 emissions. This finding is adopted with other researches, such as Bilal et al. (2020), Yongjian et al. (2020), Travaglio et al. (2020), and Conticini et al. (2020), indicating a significant relationship between urban-based GHG and NO2 emissions and the outbreak of COVID-19. The possible reason relates to the highest NO2 concentrations combined with downwards airflow, which prevent efficient dispersion of air pollutions and increase illness outbreaks (Ogen, 2020). The mentioned pollutant gas concentrations, which are caused by economic growth, could foster COVID-19 by making the respiratory system more susceptible to infection (Mele & Magazzino, 2021).
Furthermore, the relationship between urbanization and GHG emissions, influencing the citizens' health, has been revealed in the other work (see Carozzi & Roth, 2020). Meanwhile, we found that urban density has no appropriate relationship with the COVID-19 outbreak in the country level of the MECA region. It seems that urban density can be considered as an effective factor in the commencement of the pandemic status not during the outbreak. Carozzi et al. (2020) describe a similar fact, demonstrating that the densely urban points get the head start on the spread of the first peak of the pandemic in the USA but in the period of pandemic status, the sprawled and low-dense pre-urban areas can be categorized as prone areas.
In the next step, a similar indication was also examined at the provincial level of the study in Iran. In this regard, seven provinces of Tehran, Khuzestan, Khorasan-Razavi, Esfahan, Gilan, Qom, and Mazandaran with overall confirmed cases of 65% revealed the most contribution to the urban population (51%), national CO2 emissions (49%), national fuel consumption (50%), and total intra-changed travels (44%). Based on the very strong and strong relationships between confirmed cases and some independent variables such as total population, urban population, fuel consumption, NO2–CO2 emissions, energy use, and total intra-changed travels (R from 724 to 0.945), the COVID-19 outbreak certainly depends on the urbanization and its population abundance. The previous works have noted that the provinces of Tehran, Khorasan-Razavi, and Esfahan are more susceptible to the COVID-19 outbreak due to the high metropolitan areas, population, and intra-changed travels (Ahmadi et al., 2020). In the metropolitan areas, GHG emissions and air pollution are recorded as high concentrations measures where the physical health of the population is directly threatened (Magazzino et al., 2020). Hence, the pandemic status of COVID-19 in Iran, during the year 2020, definitely depended on the provinces and territories including the high level of urban population rates and their related fuel consumption, energy use, and NO2–CO2 emissions. Ultimately, we can approve the research hypothesis in the study areas, with the strongest evidence in Iran, demonstrating that the urbanization and its related population and processes (e.g., GHG, CO2, and NO2 emissions) have a positive association with the pandemic status of COVID-19 outbreak.
Conclusion
Among the MECA countries, the first suspected and confirmed cases of COVID-19 infection were observed in United Arab Emirates (UAE) on January 27, 2020, and accordingly, the Iranian health organization has announced the first cases on February 19, 2020 (Behzadifar et al., 2020). Afterward, the WHO officially reported the COVID-19 outbreak as a pandemic status on March 12, 2020 (Mikhael & Al-Jumaili, 2020). Now at the end of December 31, 2020, the COVID-19 is confirmed in 218 countries and territories with a total of 83.42 million confirmed cases and 1,818,116 total deaths (OWID, 2020). Hence, it seems that the world is still fighting COVID-19 and more studies in different regions should be carried out to recognize the complexity of the pandemic status and its influencing factors. In this regard, The main objective of the present research was to disclose the correlative contribution of urban-associated factors (independent variables such as urban population) affecting the COVID-19 confirmed cases (dependent variable) in the country level of the MECA region and downscaling the research in the provincial level in Iran.
Based on the results, the COVID-19 outbreak can be dependent on the urbanization and its induced fuel consumption or energy use, GHG, CO2, and NO2 emissions in the MECA region and Iran. Contrarily, results revealed that the COVID-19 outbreak could not relate to the physical indicators such as land area, urban density, and urban point numbers. Accordingly, further researches should divide two categories of physical and functional indicators due to their diverse effects on the COVID-19 status. This practical recommendation can decrease the paradoxical findings regarding relationships between urbanization and illness outbreaks. Besides, the HCA results revealed the substantial role of the urban populations and urban-associated gas emissions in clustering locations regarding the COVID-19 outbreak.
The high level of the urban population in the megacities is a main vulnerable condition regarding a pandemic, which indicates for urban planners, designers, policymakers, and administrators to reconsider their sustainability quotient on denser or compact cities (Desai, 2020). Furthermore, influenced by the COVID-19 outbreak, the lockdown and quarantining of many urban areas are influencing globalized urban lifestyles at various scales (Salama, 2020). Hence, the main contribution of this research is to give a useful correlation between Coronavirus infection and urban constitution, aiming to increase the health of urban societies by creating effective planning in the future.
The implication of the results can be considered for both practical and academic applications. The practical implication is to identify the urbanization role in the COVID-19 status within the MECA countries and Iran, which is applicable for health policymakers, urban managers, and environmental planners. Besides, the academic implication is to associate the theoretical backgrounds to conduce the researchers to define unique concepts, subjects, and study areas. Eventually, the limitations of this research relate to the inadequacy of data mining for independent indicators, countries, and time-interval curbs. More indicators and countries should be considered in further researches to overcome these limitations by assuming the co-registered time intervals such as daily or monthly scales.
Acknowledgements
We also thank anonymous reviewers for technical suggestions on data interpretations.
Authors' contributions
All authors were equally involved in analyzing and editing the paper.
Funding
This study was not funded by any grant.
Availability of data and material
The data that support the findings of this study are available from the corresponding author upon request.
Declarations
Conflict of interest
The authors declare that they have no conflict of interest.
Ethics approval and consent to participate
This article does not contain any studies with participants performed by any of the authors.
Informed consent
Informed consent was obtained from individual participant included in the study.
Footnotes
Publisher's Note
Springer Nature remains neutral with regard to jurisdictional claims in published maps and institutional affiliations.
Contributor Information
Nikta Bahman Bijari, Email: nikbh.bijari@mshdiau.ac.ir.
Mohammad Reza Mansouri Daneshvar, Email: mrm_daneshvar2012@yahoo.com, http://www.researcherid.com/rid/G-2881-2012.
References
- Acuto M. COVID-19: Lessons for an urban(izing) world. One Earth. 2020;2(4):317–319. doi: 10.1016/j.oneear.2020.04.004. [DOI] [PMC free article] [PubMed] [Google Scholar]
- Aguilar, J., Bassolas, A., Ghoshal, G., Hazarie, S., Kirkley, A., Mazzoli, M., Meloni, S., Mimar, S., Nicosia, V., Ramasco, J. J., & Sadilek, A. (2020). Impact of urban structure on COVID-19 spread. arXiv:2007.15367v1 [physics.soc-ph], 1–11. [DOI] [PMC free article] [PubMed]
- Ahmadi M, Sharifi A, Dorosti S, Ghoushchi SJ, Ghanbari N. Investigation of effective climatology parameters on COVID-19 outbreak in Iran. Science of the Total Environment. 2020;729:138705. doi: 10.1016/j.scitotenv.2020.138705. [DOI] [PMC free article] [PubMed] [Google Scholar]
- Alhazzani W, Møller MH, Arabi YM, Loeb M, Gong MN, Fan E, Oczkowski S, Levy MM, Derde L, Dzierba A, Du B, Aboodi M, Wunsch H, Cecconi M, Koh Y, Chertow DS, Maitland K, Alshamsi F, Cote EB, Greco M, Laundy M, Morgan JS, Kesecioglu J, McGeer A, Mermel L, Mammen MJ, Alexander PE, Arrington A, Centofanti JE, Citerio G, Baw B, Memish ZA, Hammond N, Hayden FG, Evans L, Rhodes A. Surviving sepsis campaign: Guidelines on the management of critically ill adults with coronavirus disease 2019 (COVID-19) Intensive Care Medicine. 2020;46:854–887. doi: 10.1007/s00134-020-06022-5. [DOI] [PMC free article] [PubMed] [Google Scholar]
- Behzadifar M, Ghanbari MK, Bakhtiari A, Behzadifar M, Bragazzi NL. Ensuring adequate health financing to prevent and control the COVID-19 in Iran. International Journal for Equity in Health. 2020;19:61. doi: 10.1186/s12939-020-01181-9. [DOI] [PMC free article] [PubMed] [Google Scholar]
- Bilal BMF, Benghoul M, Numan U, Shakoor A, Komal B, Tan D. Environmental pollution and COVID-19 outbreak: Insights from Germany. Air Quality, Atmosphere and Health. 2020;13:1385–1394. doi: 10.1007/s11869-020-00893-9. [DOI] [PMC free article] [PubMed] [Google Scholar]
- Carozzi, F., Provenzano, S., & Roth, S. (2020). Urban density and COVID-19. IZA discussion paper 13440. [DOI] [PMC free article] [PubMed]
- Carozzi, F., & Roth, S. (2020). Dirty density: air quality and the density of American cities. IZA discussion paper, 13191.
- Chapman A, Tsuji T. Impacts of COVID-19 on a transitioning energy system, society, and international cooperation. Sustainability. 2020;12:8232. doi: 10.3390/su12198232. [DOI] [Google Scholar]
- Conticini E, Frediani B, Caro D. Can atmospheric pollution be considered a co-factor in extremely high level of SARS-CoV-2 lethality in Northern Italy? Environmental Pollution. 2020;261:114465. doi: 10.1016/j.envpol.2020.114465. [DOI] [PMC free article] [PubMed] [Google Scholar]
- Cordell D, Drangert JO, White S. The story of phosphorus: Global food security and food for thought. Global Environmental Change. 2009;19(2):292–305. doi: 10.1016/j.gloenvcha.2008.10.009. [DOI] [Google Scholar]
- Daneshvar MRM, Abadi NH. Spatial and temporal variation of nitrogen dioxide measurement in the Middle East within 2005–2014. Modeling Earth Systems and Environment. 2017;3:20. doi: 10.1007/s40808-017-0293-0. [DOI] [Google Scholar]
- Khalesi B, Daneshvar MRM. Comprehensive temporal analysis of temperature inversions across urban atmospheric boundary layer of Tehran within 2014–2018. Modeling Earth Systems and Environment. 2020;6:967–982. doi: 10.1007/s40808-020-00732-x. [DOI] [Google Scholar]
- De Meester F, Van Dyck D, De Bourdeaudhuij I, Deforche B, Cardon G. Do psychosocial factors moderate the association between neighborhood walk ability and adolescents’ physical activity? Social Science and Medicine. 2013;81:1–9. doi: 10.1016/j.socscimed.2013.01.013. [DOI] [PubMed] [Google Scholar]
- Desai D. Urban densities and the COVID-19 pandemic: Upending the sustainability myth of global megacities. ORF Occasional Paper. 2020;244:1–38. [Google Scholar]
- Dhakal S. GHG emissions from urbanization and opportunities for urban carbon mitigation. Current Opinion in Environmental Sustainability. 2010;2(4):277–283. doi: 10.1016/j.cosust.2010.05.007. [DOI] [Google Scholar]
- EDGAR. (2018). Emission database for global atmospheric research. Joint research center of European Commission. Retrieved 2019, from http://edgar.jrc.ec.europa.eu
- Eid J, Overman HG, Puga D, Turner MA. Fat city: Questioning the relationship between urban sprawl and obesity. Journal of Urban Economics. 2008;63:385–404. doi: 10.1016/j.jue.2007.12.002. [DOI] [Google Scholar]
- Fatmi MR. COVID-19 impact on urban mobility. Journal of Urban Management. 2020;9(3):270–275. doi: 10.1016/j.jum.2020.08.002. [DOI] [Google Scholar]
- Feng J, Glass TA, Curriero FC, Stewart WF, Schwartz BS. The built environment and obesity: A systematic review of the epidemiologic evidence. Health and Place. 2010;16:175–190. doi: 10.1016/j.healthplace.2009.09.008. [DOI] [PubMed] [Google Scholar]
- Feng S, Jiang F, Wang H, Wang H, Ju W, Shen Y, Zheng Y, Wu Z, Ding A. NOx emission changes over China during the COVID-19 epidemic inferred from surface NO2 observations. Geophysical Research Letters. 2020;47(19):e2020GL090080. doi: 10.1029/2020GL090080. [DOI] [PMC free article] [PubMed] [Google Scholar]
- Garrett, T. A. (2007). Economic effects of the 1918 influenza pandemic: Implications for a modern-day pandemic. Working paper CA0721.2007. Federal Reserve Bank of St. Louis. https://www.stlouisfed.org/~/media/files/pdfs/community-development/research-reports/pandemic_flu_report.pdf.
- Gehl, J., Gemzøe, L., Kirknæs, S., & Søndergaard, S. (2006). New city life. Danish Architectural Press.
- Ghanbari S, Daneshvar MRM. Urban and rural contribution to the GHG emissions in the MECA countries. Environment, Development and Sustainability. 2020 doi: 10.1007/s10668-020-00879-8. [DOI] [Google Scholar]
- Girdhar A, Kapur H, Kumar V, Kaur M, Singh D. Effect of COVID-19 outbreak on urban health and environment. Air Quality, Atmosphere and Health, 2020 doi: 10.1007/s11869-020-00944-1. [DOI] [PMC free article] [PubMed] [Google Scholar]
- Hamidi S, Sabouri S, Ewing R. Does density aggravate the COVID-19 pandemic? Early findings and lessons for planners. Journal of the American Planning Association. 2020 doi: 10.1080/01944363.2020.1777891. [DOI] [Google Scholar]
- Hu, R. (2020). Reinventing community in COVID-19: A case in Canberra. Socio-Ecological Practice Research. 10.1007/s42532-020-00055-2 [DOI] [PMC free article] [PubMed]
- IEA (2018). World energy outlook of international energy agency, Paris. Retrieved 2019, from https://webstore.iea.org/statistics-data
- IMF (2017). Regional economic outlook archived by international monetary fund. Retrieved 2018, from https://www.imf.org/en/Publications/REO/MECA/Issues/2016/10/mreo1016
- Jorgenson AK. The sociology of ecologically unequal exchange and carbon dioxide emissions, 1960–2005. Social Science Research. 2012;2:242–252. doi: 10.1016/j.ssresearch.2011.11.011. [DOI] [PubMed] [Google Scholar]
- Knight KW, Rosa EA, Schor JB. Could working less reduce pressures on the environment? A cross-national panel analysis of OECD countries, 1970–2007. Global Environmental Change. 2013;23:691–700. doi: 10.1016/j.gloenvcha.2013.02.017. [DOI] [Google Scholar]
- Liddle B. Consumption-driven environmental impact and age structure change in OECD countries: A cointegration-STIRPAT analysis. Demographic Research. 2011;30:749–770. doi: 10.4054/DemRes.2011.24.30. [DOI] [Google Scholar]
- Mackenbach JD, Rutter H, Compernolle S, Glonti K, Oppert JM, Charreire H, De Bourdeaudhuij I, Brug J, Nijpels G, Lakerveld J. Obesogenic environments: A systematic review of the association between the physical environment and adult weight status, the SPOTLIGHT project. BMC Public Health. 2014;14:233. doi: 10.1186/1471-2458-14-233. [DOI] [PMC free article] [PubMed] [Google Scholar]
- Magazzino C, Mele M, Schneider N. The relationship between air pollution and COVID-19-related deaths: An application to three French cities. Applied Energy. 2020;279:115835. doi: 10.1016/j.apenergy.2020.115835. [DOI] [PMC free article] [PubMed] [Google Scholar]
- Mahmoudzadeh, A., & Daneshvar, M. R. M. (2020). A scenario to predict risk index of Coronavirus contagion based on official statistics in Iran. Technical Report for Shakhes Pajouh Research Institute, Report No.: C-2020-04. 10.13140/RG.2.2.31852.10880. (In Persian).
- Manawadu L, Gunathilaka KL, Wijeratne VP. Urban agglomeration and COVID-19 clusters: Strategies for pandemic free city management. International Journal of Scientific and Research Publications. 2020;10(7):769–775. doi: 10.29322/IJSRP.10.07.2020.p10385. [DOI] [Google Scholar]
- Mazar, Z. A., Sah, R., Rabaan, A., Dhama, K., & Morales, A. J. R. (2020). Mapping the incidence of the COVID-19 hotspot in Iran—implications for travelers. Travel Medicine and Infectious Disease 34(Mar-Apr):101630. [DOI] [PMC free article] [PubMed]
- Mele M, Magazzino C. Pollution, economic growth, and COVID-19 deaths in India: a machine learning evidence. Environmental Science and Pollution Research. 2021;28:2669–2677. doi: 10.1007/s11356-020-10689-0. [DOI] [PMC free article] [PubMed] [Google Scholar]
- Mikhael EM, Al-Jumaili AA. Can developing countries face novel coronavirus outbreak alone? The Iraqi situation. Public Health in Practice. 2020;1:100004. doi: 10.1016/j.puhip.2020.100004. [DOI] [PMC free article] [PubMed] [Google Scholar]
- Mills CE, Robins JM, Lipsitch M. Transmissibility of 1918 pandemic influenza. Nature. 2004;432(7019):904–906. doi: 10.1038/nature03063. [DOI] [PMC free article] [PubMed] [Google Scholar]
- MOE. (2019). The balance sheet of the energy use in Iran archived by Iranian Ministry of Energy. Retrieved 2020, from https://isn.moe.gov.ir/Statistical-Reports
- Nikpouraghdam M, Farahani AJ, Alishiri G, Heydari S, Ebrahimnia M, Samadinia H, Sepandi M, Jafari NJ, Izadi M, Qazvini A, Dorostkar R, Tat M, Shahriary A, Farnoosh G, Zijoud SRH, Taghdir M, Alimohamadi Y, Abbaszadeh A, Ghaleh HEG, Bagheri M. Epidemiological characteristics of coronavirus disease 2019 (COVID-19) patients in IRAN: A single center study. Journal of Clinical Virology. 2020;127:104378. doi: 10.1016/j.jcv.2020.104378. [DOI] [PMC free article] [PubMed] [Google Scholar]
- Ogen Y. Assessing nitrogen dioxide (NO2) levels as a contributing factor to coronavirus (COVID-19) fatality. Science of the Total Environment. 2020;726:138605. doi: 10.1016/j.scitotenv.2020.138605. [DOI] [PMC free article] [PubMed] [Google Scholar]
- OWID (2020). Collection of the COVID-19 data maintained by our world in data. Retrieved 2020, from https://ourworldindata.org/coronavirus-source-data
- RMTO. (2019). The transportation yearbook archived by Iranian Road Maintance and Transportation Organization. Retrieved 2020, from http://rmto.ir/Pages/SalnameAmari.aspx
- Salama AM. Coronavirus questions that will not go away: Interrogating urban and socio-spatial implications of COVID-19 measures [version 1; peer review: 3 approved] Emerald Open Research. 2020;2:14. doi: 10.35241/emeraldopenres.13561.1. [DOI] [Google Scholar]
- Şatir S, Korkmaz E. Urban open spaces with examples & the classification of urban furniture. İTÜ AlZ Journal. 2005;2(1/2):130–141. [Google Scholar]
- SCI (2018). Official report of statistical survey of settlements and populations archived by the Statistical Center of Iran. Retrieved 2019, from http://www.amar.org.ir
- Tavakoli A, Shafie-Pour M, Ashrafi K, Abdoli G. Options for sustainable development planning based on “GHGs emissions reduction allocation (GERA)” from a national perspective. Environment, Development and Sustainability. 2016;18(1):19–35. doi: 10.1007/s10668-015-9619-0. [DOI] [Google Scholar]
- Travaglio M, Yu Y, Popovic R, Selley S, Santos Leal N, Miguel Martins LM. Links between air pollution and COVID-19 in England. Environmental Pollution. 2020;268:115859. doi: 10.1016/j.envpol.2020.115859. [DOI] [PMC free article] [PubMed] [Google Scholar]
- WHO. (2020). Daily/weekly update of COVID-19 in Iran, No. 204, 10 September 2020. World Health Organization archived by Shahid Beheshti University of Medical Sciences. Retrieved 2019, from http://en.sbmu.ac.ir/uploads/COVID_19_Update-200910.pdf
- World Bank. (2020). World development indicators archived by online public web resource of World data bank, Washington. Retrieved 2020, from https://databank.worldbank.org/databases
- WUP. (2018). World urbanization prospects. Population division of the department of economic and social affairs of the United Nations. Retrieved 2019, from https://population.un.org/wup
- Yongjian Z, Jingu X, Fengming H, Liqing C. Association between short-term exposure to air pollution and COVID-19 infection: Evidence from China. Science of the Total Environment. 2020;727:138704. doi: 10.1016/j.scitotenv.2020.138704. [DOI] [PMC free article] [PubMed] [Google Scholar]
- Zali A, Gholamzadeh A, Mohammadi G, Looha MA, Akrami F, Zarean E, Vafaee R, Maher A, Khodadoost M. Baseline characteristics and associated factors of mortality in COVID-19 patients; an analysis of 16000 cases in Tehran, Iran. Archives of Academic Emergency Medicine. 2020;8(1):e70. [PMC free article] [PubMed] [Google Scholar]
- Zarzoso IM, Maruotti A. The impact of urbanization on CO2 emissions: Evidence from developing countries. Ecological Economics. 2011;70:1344–1353. doi: 10.1016/j.ecolecon.2011.02.009. [DOI] [Google Scholar]
- Zhu HM, You WH, Zeng Z. Urbanization and CO2 emissions: A semi-parametric panel data analysis. Economics Letters. 2012;3:848–850. doi: 10.1016/j.econlet.2012.09.001. [DOI] [Google Scholar]
Associated Data
This section collects any data citations, data availability statements, or supplementary materials included in this article.
Data Availability Statement
The data that support the findings of this study are available from the corresponding author upon request.