

Abstract
The present study demonstrates the relationship between conventional and quantum mechanical (QM) NMR spectroscopic analyses, shown here to assist in building a convincingly orthogonal platform for the solution and documentation of demanding structures. Kaempferol-3-O-robinoside-7-O-glucoside, a bisdesmosidic flavonol triglycoside and botanical marker for the aerial parts of Withania somnifera, served as an exemplary case. As demonstrated, QM-based 1H iterative Full Spin Analysis (HiFSA) advances understanding of both individual nuclear resonance spin patterns and the entire 1H NMR spectrum of a molecule and establishes structurally determinant, numerical HiFSA profiles. The combination of HiFSA with regular 1D 1H NMR spectra allows for simplified yet specific identification tests via comparison of high-quality experimental with QM calculated spectra. HiFSA accounts for all features encountered in 1H NMR spectra: non-linear high-order effects, complex multiplets, and their usually overlapped signals. As HiFSA replicates spectrum patterns from field-independent parameters with high accuracy, this methodology can be ported to low-field NMR instruments (40-100 MHz). With its reliance on experimental NMR evidence, the QM approach builds up confidence in structural characterization and potentially reduces identity analyses to simple 1D 1H NMR experiments. This approach may lead to efficient implementation of conclusive identification tests in pharmacopoeial and regulatory analyses: from simple organics to complex natural products.
GRAPHICAL ABSTRAfCT

The use of dietary supplements is rapidly expanding around the world. In the U.S., dietary supplements use remains on the rise among adults.1,2 Safety and quality concerns pertaining to the adulteration3 of these products are increasing. As botanical dietary supplements are particularly complex, setting standards for their quality attributes is most challenging. Ashwagandha, Withania somnifera (L.) Dunal. (Solanaceae) has become an important botanical commodity: its root is widely used in traditional medicine and is thus typically claimed as the source material of dietary supplement products. With the deliberate adulteration of the roots with the aerial parts of the plants being of concern, quality standards are necessary to distinguish these two plant parts reliably.
Botanical extracts present further analytical challenges as they are devoid of plant structural features. Thus, assays aimed at identifying the proper source material, including the appropriate plant part, must rely on chemical analysis. This reflects additional methodologic challenge as the detection of excess quantities of structurally unique flavonoids characteristic of the aerial parts in a product purportedly derived from roots, as is called for in W. somnifera ingredients, is indicative of contamination and inadequate pharmacopeial quality. To guard from intentional admixture of aerial parts to pharmacopeial articles claiming to be derived from roots,4 the U.S. Pharmacopeia (USP) Ashwagandha Root Dry Extract monograph5 has incorporated a limit test on the content of three aerial part chemical markers: quercetin-3-O-robinoside-7-O-glucoside, quercetin-3-O-rutinoside-7-O-glucoside, and kaempferol-3-O-robinoside-7-O-glucoside. The latter have been developed as USP reference standards, and the present study lays the foundation for their unambiguous structural qualification as reference standards.
Advancing Pharmacopoeial Methodology.
In the realm of public health, emerging analytical testing strategies are essential for improving safety nets and ensuring adequate quality of pharmaceuticals, foods, and dietary supplements. The USP continuously assesses the feasibility of incorporating advanced analytical methodologies into its documentary standards. NMR spectroscopy is an established versatile and nondestructive analytical methodology.6 While NMR data have historically been employed for structural analysis, recent advances in instrumentation and data processing have prompted renewed interest in its long-established concurrent qualitative and quantitative capabilities.7–9 Substantial improvement of computer-aided NMR analysis facilitates structure elucidation by supplementing conventional analysis with the calculation of NMR spectra using quantum mechanics (QM) tools.10,11 The QM-based method of 1H iterative Full Spin Analysis (HiFSA) has been demonstrated as a suitable approach to accurately extract chemical shifts and coupling constants using widely available 1D 1H NMR experimental data.12,13 NMR-based QM analysis of organic natural molecules offers significant advantages over conventional quantitative schemes for reference materials, commonly based on chromatographic methodologies, which are time-consuming and require extensive method development and validation. While hyphenated MS methodologies also offer orthogonality for structural verification, complex stereochemical architecture remains inaccessible even for advanced MS methods. In contrast, NMR data can address many of the stereochemical and linkage challenges associated with complex molecules. Moreover, NMR spectroscopy is superior in detecting unexpected unknowns.
Plethora of Structures with “Multiplet” Resonances.
Flavonoid glycosides are commonly utilized as chemical markers for the quality control of botanical dietary supplements in the world pharmacopoeias including USP. In these molecules, the glycosidic moieties are most variable by virtue of the stereoisomerism of the sugars, the sugar-aglycone attachment sites, and the inter-glycosidic linkages. A particular combination of these features makes flavonoid glycosides frequently unique for a particular botanical, justifying their use as identity markers. However, these compounds give rise to complex NMR spectra: particularly in the 1H domain, complex sets of “multiplets” and/or overlapping resonances are prevalent. As the term “multiplet” does not represent interpretable information that ultimately leads to the full structure of a molecule, the observed prominence of reported “multiplets” hampers the understanding of structural information. While it is difficult to assess the frequency of incorrectly deduced structures, surveying the relevant literature makes it evident that many published NMR spectra are generally under-interpreted. Incomplete analysis via the designation of “multiplets” and neglecting the underlying J-couplings introduces a degree of ambiguity that frequently renders published data inadequate for reference purposes.
Transformation of Reference Standards by QM-based Resolution of “Multiplets”.
The present study attempts to demonstrate a procedure for NMR-based structural analysis of a marker compound, kaempferol-3-O-robinoside-7-O-glusoside (1), using a combination of methodologies including conventional 1D/2D NMR and QM-based HiFSA. The outcomes demonstrate that a HiFSA profile (numerical) and fingerprint (spectrum), derived from an experimental 1D 1H NMR spectrum, can impart sufficient certainty to the structural analysis of a relatively complex, bisdesmosidic flavonol glycoside (1) to reliably distinguish it from congeneric triglycosides such as quercetin-3-O-robinoside-7-O-glucoside (2). This means that, once its HiFSA profile has been established, the identification and the quantitative assay of the chemical marker can be reduced to a single 1D 1H NMR experiment. The present study outlines the prospective pathway for establishing reference standards with unambiguous structural assignment and interoperability for potential use in pharmacopeial context and quality control of botanical dietary supplements.
RESULTS AND DISCUSSION
Deuterated NMR Solvent Selection.
Initially, the 1H and 13C 1D NMR data of kaempferol-3-O-robinoside-7-O-glucoside (1, Figure 1) were acquired in DMSO-d6, to account for all resonances including the exchangeable hydrogens. However, in aprotic DMSO-d6, the numerous HO-CHn moieties in 1 complicate the interpretation of the 1D 1H NMR spectra due to the coupling patterns of the unexchanged OH hydrogens. To simplify the spectra, deuterium exchange experiments with solvents such as D2O and methanol-d4 were undertaken. Concurrently, because most flavonol oligoglycosides may have only limited solubility in water and MeOH, mixtures of these solvents with DMSO-d6 were evaluated.
Figure 1.

(A) Structure of kaempferol-3-O-robinoside-7-O-glucoside (1); (B) Determination of the planar structure of 1 (DMSO-d6 and D2O) based on the 2D NMR experiments, COSY and HMBC correlations and quantum mechanics-based HiFSA, see also Figures S3 and S5, Supporting Information.
Moreover, binary mixtures of DMSO-d6 with methanol-d4 and D2O were investigated as more appropriate NMR solvents. The elimination of the couplings from the exchangeable 1H of the OH groups is clearly demonstrated in Figures 2a/b. This allowed for the analysis of the more explicit constitutionally relevant J-coupling patterns and facilitated structure elucidation. Because of solvent effects,14 observed variations between the spectra acquired in the following three solvent systems were to be expected: a mixture of DMSO-d6 and D2O (1:1, v/v, Figure 2a), a mixture of DMSO-d6 and methanol-d4 (7:3, v/v, Figure 2b), and neat DMSO-d6 (Figure 2c). To overcome signal overlap caused by the residual solvent resonances themselves, the following approaches were used (data not shown): (i) variation of the deuterated solvent ratios in solvent mixtures; (ii) resolution-enhancing window functions during post-acquisition processing; and (iii) the use of ultra-high magnetic field strength. While 900 MHz offers additional signal dispersion (Figure S1, Supporting Information), the HiFSA profiles are identical at both magnetic field strengths, and the NMR information required for structural validation is fully accessible at 600 MHz (and below).
Figure 2.

1H NMR spectra of 1 in the solvent mixtures of DMSO-d6 and 50% of D2O (a), DMSO-d6 and 30% of methanol-d4 (b), compared to neat DMSO-d6 (c). (A) shows the entire spectrum of 1; (B) and (C) show expanded regions. Significantly different chemical environments resulting from various combinations of deuterated solvents result in distinct NMR fingerprints of 1, including chemical shifts and J-coupling patterns.
Interpretation of the 1D NMR Spectra of 1.
While during the course of the study, two solvent mixtures (DMSO-d6 + D2O and DMSO-d6 + methanol-d4) were used to acquire 1D and 2D NMR spectra, the data used for the full structural assignments of 1 in this section only stem from the sample dissolved in DMSO-d6 + D2O, as shown in Figures S1-S5, Supporting Information. The spectrum in DMSO-d6 + D2O exhibited typical aromatic signatures of an AX system (δH 6.773 ppm, 1H, d, J = 2.15 Hz and 6.443 ppm, 1H, d, J = 2.15 Hz) from the flavonol A-ring, and an AA′XX′ pattern with the four aromatic hydrogens (δH 8.067 ppm, 2H, ddd/pseudo dt, J = 8.68, 2.52, 0.36 Hz and 6.872 ppm, 2H, ddd/pseudo quartet, J = 8.68, 2.52, 0.36 Hz) from the B-ring. The presence of anomeric hydrogen resonances (δH range from 4.400 to 5.500 ppm, as shown in Figure S1A, Supporting Information) allowed the use of the sugar “structural reporter” concept: resonances outside the strongly signal-overlapped region (δH range from 3.000 to 4.000 ppm; Figure S1B, Supporting Information) were used to approach the interpretation of the 1H NMR spectrum. All single 1H-1H bond correlations were determined via a 2D 1H,1H-gradient-enhanced homonuclear correlation spectroscopy (COSY; Figure S3, Supporting Information). Subsequently, 1H spectral QM analysis, including spectral prediction and calculation, was conducted via HiFSA.15,16 This procedure achieved a comprehensive interpretation of the complex 1H NMR resonances (aka “multiplets”) typically found in aromatic rings, sugars, and flavonoid aglycone moieties, as shown in Table 1. For example, matching the patterns of each resonance can be achieved via iterative calculation (see example in Figure 3D), which eventually leads to the calculated spectrum matching the experimental data exactly (see example in Figure 3E). See further discussion in the Section on Quantum Mechanical Analysis of the 1H NMR Spectrum of 1.
Table 1.
The 1D NMR (600 MHz for 1H, 150 MHz for 13C) Data for Kaempferol-3-O-robinoside-7-O-glucoside (1) in DMSO-d6 with 50% of D2O.
| annotation | δH (ppm) a | multiplicity (J in Hz [coupled nucleus])a | δC (ppm) | |
|---|---|---|---|---|
| C-2 | 157.63 | |||
| C-3 | 134.04 | |||
| C-4 | 177.96 | |||
| C-5 | 160.95 | |||
| CH-6 | 6.443 | d (2.15[H-8]) | 99.73 | |
| C-7 | 163.23 | |||
| CH-8 | 6.773 | d (2.15[H-6]) | 95.06 | |
| C-9 | 156.50 | |||
| C-10 | 106.03 | |||
| C-1′ | 160.43 | |||
| CH-2′ | 8.067 | ddd (8.68 [H-3′], 2.52 [H-6′], 0.36 [H-5′]) | 131.28 | |
| CH-3′ | 6.872 | ddd (8.68 [H-2′], 2.57 [H-5′], 0.36 [H-6′]) | 115.23 | |
| C-4′ | 121.14 | |||
| CH-5′ | 6.872 | ddd (8.68 [H-6′], 2.57 [H-5′], 0.36 [H-2′]) | 115.23 | |
| CH-6′ | 8.067 | ddd (8.68 [H-5′], 2.52 [H-2′], 0.36 [H-3′]) | 131.28 | |
| CH-1″ | 5.291 | dd (7.73 [H-2″], −0.11 [H-5″]) | 102.23 | |
| CH-2″ | 3.528 | dd (9.57 [H-3″], 7.73 [H-2″]) | 71.327 | |
| CH-3″ | 3.381 | dd (9.57 [H-2″], 3.39 [H-4″]) | 73.159 | |
| CH-4″ | 3.590 | dddd (3.39 [H-3″], 0.08 [H-5″], −0.08 [H-6″a], −0.09 [H-6″b]) | 68.29 | |
| CH-5′ | 3.541 | dddd (6.89 [H-6″b], 5.68 [H-6″a], 0.08 [H-4″], −0.11 [H-1″]) | 74.00 | |
| CH2-6′ | a | 3.554 | ddd (−10.72 [H-6″a], 5.68 [H-5″], −0.08 [H-4″]) | 65.90 |
| b | 3.251 | ddd (−10.72 [H-6″b], 6.89 [H-5″], −0.09 [H-4″]) | ||
| CH-1″′ | 4.369 | dd (1.62 [H-2″′], −0.64 [H-5″′]) | 100.41 | |
| CH-2″′ | 3.355 | dd (3.39 [H-3″′], 1.62 [H-1″′]) | 70.59 | |
| CH-3″′ | 3.270 | dd (9.42 [H-4″′], 3.39 [H-2″′]) | 70.73 | |
| CH-4″′ | 3.067 | ddd (9.42 [H-3″′], 9.42 [H-5″′], −0.05[H-6″′]) | 72.10 | |
| CH-5″′ | 3.336 | ddd (9.42, [H-4″′] 6.20 [H-6″′], −0.64 [H-1″′]) | 68.57 | |
| CH3- 6″′ | 1.029 | dd (6.20 [H-5″′], −0.05[H-4″′]) | 18.17 | |
| CH-1″″ | 5.036 | d (7.80 [H-2″″]) | 100.16 | |
| CH-2″″ | 3.253 | dd (9.12 [H-3″″], 7.80 [H-1″″]) | 73.29 | |
| CH-3″″ | 3.299 | dd (9.12 [H-2″″], 9.01 [H-4″″]) | 76.42 | |
| CH-4″″ | 3.152 | dddd (9.65 [H-5″″], 9.01 [H-3″″], −0.21 [H-6″″b], −0.01[H-6″″a]) | 69.83 | |
| CH-5″″ | 3.434 | ddd (9.65 [H-4″″], 6.09 [H-6″″a], 2.23 [H-6″″b]) | 77.35 | |
| CH2-6″″ | a | 3.687 | ddd (−12.00 [H-6″″b], 6.09 [H-5″″], −0.01 [H-4″″]) | 60.86 |
| b | 3.444 | ddd (−12.00 [H-6″″a], 2.23 [H-5″″], −0.21 [H-4″″]) | ||
The δH (ppm) and J (Hz) values were determined by quantum mechanical spectrum analysis (1H iterative full spin analysis, HiFSA). The difference in calculated values of each chemical shift between PERCH and CT software packages was less than 0.000 ppm (or 0.07 Hz, see Figure S7, Supporting Information).
Figure 3.
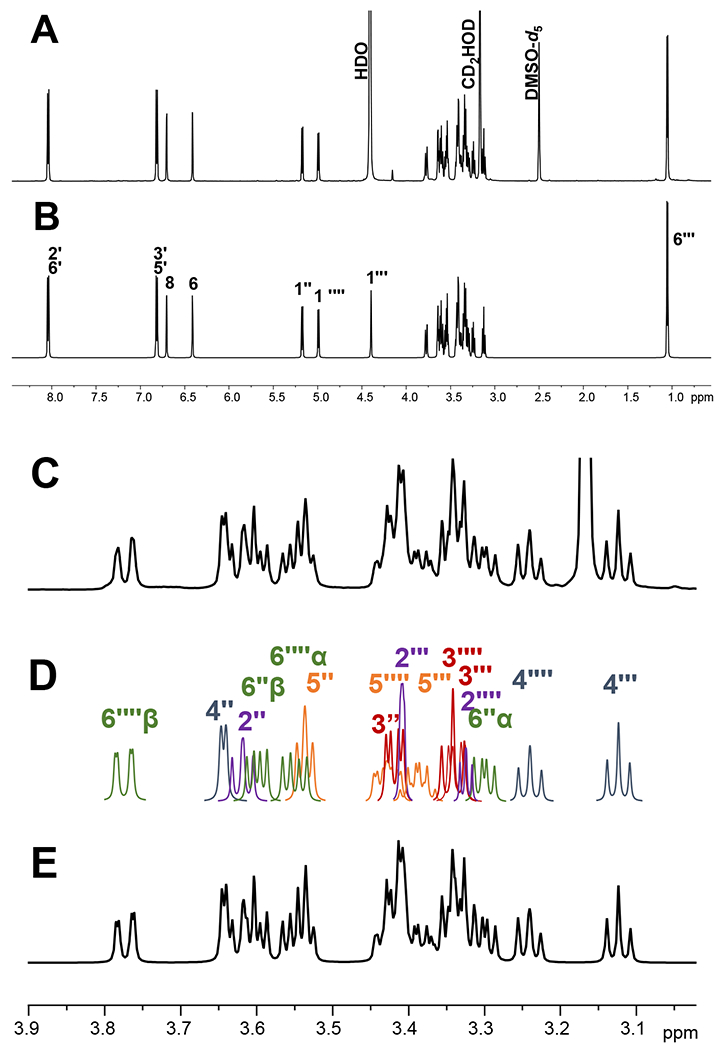
A comparison of the experimental 1H spectrum of 1 (A and C) and calculated 1H spectrum (B, D, and E) from 1H iterative full spin analysis of 1 at 600 MHz. A and B represent full spectra; C and E are zoomed-in regions from 3.0 ppm to 3.9 ppm; D represents the overlaid signal patterns deduced from the HiFSA calculation.
Interpretation of the 2D NMR spectra of 1.
All single 1H-13C bond correlations were assigned (Table 1) by analysis of the 2D gradient-selected heteronuclear single quantum coherence spectroscopy (gHSQC) NMR spectrum. The 1D 13C (Figure S2, Supporting Information) and 2D gHSQC (Figure S4, Supporting Information) NMR data showed the following characteristic 13C chemical shifts and shift regions: a methyl group resonance at 18.21 ppm, sugar “structural reporter” resonances in the region 60 – 80 ppm, and linked anomeric carbon resonance in the region 95 – 105 ppm.17 All resonance information matched the observation as shown in Figure S2B, Supporting Information. In addition, the 13C resonances from the glycosyl acceptor, i.e., kaempferol, were at no less than 90 ppm. Interpretation of the COSY (Figure S3, Supporting Information) and 1H,13C-heteronuclear multiple bond correlation (HMBC; Figure S5, Supporting Information) data established key linkages between the spin systems of compound 1. Together with such evidence, the linkages between the resonances in 1 were confirmed as shown in Figure 1B. The 1D and 2D NMR spectra and the 1H NMR QM analysis of 1 were used to confirm the NMR assignments and deduce all chemical information of 1, including the 1H and 13C chemical shifts (δ) as well as the 1H-1H coupling constants (J), as shown in Table 1.
Quantum Mechanical (QM) Analysis of the 1H NMR Spectrum of 1.
The aim of a QM analysis of NMR spectra is to understand all relevant NMR parameters of a molecule (or sample) and to extract them accurately, by means of QM calculations, such that they resemble the experimental data in as much detail as possible. In this process, starting parameters for all δ and J values are iteratively optimized by minimizing the difference between the quantum mechanically calculated NMR spectrum and the experimental data. For a comprehensive description of the HiFSA concept, the available computational tools, and a general overview of the process and effort, the reader is referred to reference 13 and references therein. QM analysis of NMR spectra includes solving the often obscure multiplicities of resonances that otherwise are designated as “multiplets”, and resolving non-linear non first order (i.e., higher-order) effects by applying the classical quantum mechanical approach and solving the spin Hamiltonian.14,18,19 Because a high-resolution 1H NMR spectrum provides an absolute 1H fingerprint of a chemical structure, all 1H chemical information can be obtained via QM-based HiFSA. The bisdesmosidic flavonol glycoside, 1, is a prototypical case of a molecule that gives rise to higher-order resonances (e.g., the AA′XX′ pattern in the B-ring) and exhibits significant resonance overlap (e.g., from the sugars’ CHOD moieties). To resolve these issues, QM-based HiFSA was used in the structure elucidation of 1.
Factors Affecting the QM-HiFSA Workflow.
Both sample preparation and spectrum quality affect the QM-HiFSA practical workflow. The additional couplings from exchangeable resonances are typically more confusing than helpful. In aprotic solvents such as DMSO, the spectra are even more complex than in methanol-d4 because of at least two factors: signal broadening (solvent viscosity effect) and additional J-coupling with the hydroxy hydrogens. This leads to overly complicated spectra and makes HiFSA analysis unnecessarily challenging due to the additional and often dynamically broadened J-coupling patterns.
As part of HiFSA, all features of a spectrum can either be computed manually20 or by using a computer-aided iterative method.16,21,22 The process requires a high-resolution 1D 1H NMR spectrum, preferably with fully relaxed nuclei if strictly quantitative conditions are desired for highly accurate quantitation. Details on how to perform these experiments to obtain high quality spectra accounting for good quantitative signal integration were reported previously.7,8 The role of the acquisition time (AQ) is discussed here to showcase the importance of a high-resolution 1H NMR spectrum and accurate integration. Compared to the calculated spectrum with 64k digital datapoints (Figure 4A), the spectrum with 32k datapoints (Figure 4B) has lost some of the resolution around 3.240 and 3.410 ppm. For a calculated spectrum with 16k datapoints (Figure 4C), pattern mismatching at 3.400 – 3.420 ppm occurs to a larger extent. Visual distinctions can be recognized in both spectra, even at 8k (Figure 4D) and 4k datapoints (Figure 4E). These observations are consistent with those made previously (data not shown). Spectra with lower digital resolution generate inaccurate signal patterns and can, therefore, contribute to further ambiguity in structure confirmation and QM analysis. In general, the data point resolution of the 1H 1D NMR spectrum used for HiFSA processing should be no more than 1/10 of the full line width at half height.
Figure 4.

Comparison of HiFSA-calculated 1H spectra of 1 with different number of digital data points: (A) 64k, (B) 32k, (C) 16k, (D) 8k, and (E) 4k. All calculated spectra have a window of 13,202 Hz, equivalent to 22 ppm for 1H at 600 MHz.
(Hyper-)Complex Signals Encode Valuable Information.
The outcomes of QM-based HiFSA demonstrate that 1D 1H spectra encode all the key structural information of a flavonol bisdesmoside such as 1: its structure is encoded in the many details of the numerous “multiplets” that can be decoded using HiFSA. A hypercomplex set of “overlapping multiplet” signals that would be otherwise conventionally ignored can be translated into the full molecular identity. This involves finding a solution for the “multiplet puzzle” arising from the resonances of the three sugar moieties, for which full δ and J patterns could be derived. While the flavonol part of the spectrum is rather straightforward, the resolved signal complexity yields a wealth of information. For example, HiFSA demonstrated that the rhamnopyranosyl (Rhap) hydrogen atoms 1″′ and 2″′ indeed exhibit the expected small J-coupling constant of 1.62 Hz. Furthermore, all high-order effect signals and multiplets that are significantly superimposed over each other in 1 could be resolved as shown in Table 1. The outcomes were identical with discussions in the section Interpretation of the 1D NMR Spectra of 1. As long as 1D 1H NMR acquisition follows the basic guidelines of high-resolution and quantitative conditions, the presented HiFSA profile can be successfully employed in structural analysis of 1 at any magnetic field strength.
Moreover, the HiFSA fingerprint of 1 facilitates its distinction from structurally similar bisdesmosidic flavonol triglycosides such as 2, which are near identical molecules that could potentially be disregarded from considering. Comparing the HMBC fingerprint of 2 (Figure S6, Supporting Information) with that of 1, the 1H resonances of the sugar closer to the aglycone are indeed highly similar – but not identical. QM-based HiFSA can recognize even such minor but consequential differences between 1 and 2, as shown in Table 2. This led to the identification of H-atoms 4″ and 5″ as well as 4″″ and 5″″ as characteristic for each of the two structures. This shows that, once the HiFSA profiles have been established, differentiation between such closely relates but distinct flavonol triglycosides, and other congeneric molecules, can be simplified to a 1D 1H NMR experiment.
Table 2.
HiFSA Fingerprint Difference of Multiples (J in Hz) between the Glycosidic Moieties of Kaempferol-3-O-robinoside-7-O-glucoside (1) and Quercetin-3-O-robinoside-7-O-glucoside (2), Differing only in Their Aglycones.
 |
Determination of Relative and Absolute Configuration by 1H NMR Spectroscopy.
The relative configuration of the anomeric position in sugars as being α vs β is typically derived from the J pattern of the anomeric hydrogens. Flavonols such as 1 and 2 may form different diastereomers around the anomeric linkages of the sugars with the aglycones. Assignment of the anomeric configuration of the sugar moiety is needed to establish the relative stereochemistry of the entire sugar molecule unambiguously. This is a domain of NMR spectroscopy (or chemical hydrolysis), as mass spectrometry does not generally provide such stereochemical information. In addition, the MS fragmentation patterns of bisdesmosides are typically inconclusive unless many reference analogues of the same series are available, which is rarely the case.
The general Karplus Altona relationship23 describes the correlation between the conformationally averaged dihedral angles between adjacent nuclei and their coupling constants. For example, in a solution of glucose, where the α anomer has a vicinal angle of near 60°, its J-coupling should be about 5 Hz smaller than the one from the β anomer with a dihedral angle of about 180°.24 The results summarized in Table 1 show that the J-coupling of hydrogens 1″ and 2″ was 7.73 Hz; that of hydrogens 1″′ and 2″′ was 1.62 Hz; and that of hydrogens 1″″ and 2″″ was 7.80 Hz. Accordingly, the vicinal angle of hydrogens 1″′ and 2″′ is near 60°, indicating that Rhap is present in its α form. The vicinal angles of hydrogens 1″ and 2″ vs. 1″″ and 2″″ are both about 180°, indicating that both the galactopyranosyloxy (Galp) and glucopyranosyloxy (Glcp) moieties are present in their β forms. In accordance with the Karplus relationship, the anomeric 1H, e.g., H-1″″, can be referenced as the starting point to infer the information of relative configuration in order. This leads to the following hydrogen J-coupling sequence: H-1″″ and H-2″″ coupled by 7.80 Hz; H-2″″ and H-3″″ by 9.12 Hz; H-3″″ and H-4″″ by 9.01 Hz; and H-4″″ and H-5″″ by 9.65 Hz. These consistently large J values indicate that the vicinal angles of all the hydrogens in this sequence are about 180°. Therefore, their all-trans relative configuration can be deduced.
In addition to providing interpretable relative configuration information via J-pattern analysis, NMR spectra also contain subtle but definitive chemical shift information that encodes absolute configuration, as demonstrated for the stereochemically demanding proanthocyanidins.25,26 This valuable information tends to be overlooked, but is accessible, provided that high-accuracy and high-precision 1H NMR reference data are available (HiFSA-like data being most desirable). The use of such definitive 1H NMR reference data makes the determination of absolute configuration feasible. However, it should be pointed out that this capability does not conflict with the general rule that NMR data acquired in achiral solvents/media cannot establish absolute configuration per se.27 Ab initio determination of absolute configuration typically requires hydrolysis of (oligo)glycosides into monosaccharides, followed by chiral-phase chromatography28 or chiral electrophoresis20 with mass spectrometric detection,28 and/or chiro-optical spectroscopies such as circular dichroism.29 However, recent studies25,26 have shown the utility of highly accurate and precise 1H and 13C chemical shifts in determination of absolute configuration. This more definitive and highly reproducible chemical shift information, including the J-couplings, can be obtained via QM-based HiFSA.
Thus, the methodology presented here has the intrinsic capability of distinguishing (not determining ab initio) between absolute configurations, as demonstrated for these sugar moieties. This is possible by virtue of the diastereomeric relationship of enantiomeric moieties in hybrid molecules, such as the sugar moieties in flavonoid glycosides, or monomeric catechin units in oligomeric proanthocyanidins.25,26 Thus, it is reasonable to hypothesize that, once a certified reference material of 1 has been established, future identity assays for the same compound can glean precise chemical information from the straightforward comparison of NMR experimental data. It should be pointed out that this advancement still cannot void the need for chiroptical confirmation, as under non-chiral conditions, NMR data cannot distinguish the enantiomeric forms of the entire(!) molecule (as opposed to enantiomeric moieties contained in it, even when lacking coupling). The occurrence of enantiomers of molecules with as many stereogenic centers as the flavonoid-triglycosides might be an exceedingly rare possibility in nature, but cannot be assumed and has to be ruled out individually.
Overall Conclusions.
The present study details an NMR spectroscopic investigation of 1, a plant part specific marker for Ashwagandha aerial parts, that led to the following conclusions.
(i) Proper solvent selection is key to enabling structural elucidation and dereplication, as shown for the investigated flavonoid glycoside. When removing the resonances of exchangeable hydrogens via the use of a deuterated protic solvent, such as D2O or methanol-d4, the gain from reduced signal overlap and multiplicity complexity outweighs the (theoretical) information loss from chemical exchange. To overcome solubility issues, mixtures of deuterated NMR solvents were employed. While the reproducibility of solvent mixtures is a frequently raised concern, the outcomes show that the J values are essentially unaffected. While minor deviations in solvent mixture preparation may result in minor chemical shift differences, they are unlikely to have detrimental effects beyond common experimental variability. Importantly, chemical shift alterations are readily captured by the HiFSA iteration. Therefore, unavoidable variations in solvent mixture composition are not anticipated to have negative impact on practical applications.
(ii) To facilitate HiFSA processing, the experimental spectrum should be of high quality, which involves proper shimming, leading to clean signal lineshapes, as well as adequate digitization and data point resolution. Furthermore, the use of NMR instrumentation with different magnetic field strengths provides an experimental means of validating HiFSA profiles as being field-independent.
(iii) Fully assigned sets of 1H and 13C resonances were obtained, with all 1H multiplicities, capturing even higher-order effects. A detailed 1D and 2D NMR analysis confirmed the structure of the flavonol triglycoside, 1, unambiguously. Insights gained from HiFSA advanced the understanding of the structural information contained in the 1D 1H NMR spectrum of 1. The linkages and relative configuration of the sugar moieties were defined, and all the “multiplets” in the crowded regions explained in detail. This study yielded conclusive structural confirmation of 1 and further demonstrated the utility of an advanced methodology in structure elucidation and reference material validation for discovery and industrial production settings.
(iv) The demonstrated structural validity of 1 and suitability as a reference standard can serve as a foundation to establish reference standards of congeneric molecules, such as 2 and other, closely related bis- and mono-desmosidic flavonoid glycosides. In fact, the comprehensive and orthogonal foundation of 1 establishes all its NMR data sets as reference points, from which congeners can be assigned with a high level of confidence. Figure S6, Supporting Information, exemplifies this for the pair of 1 vs. 2, which differ by only the additional phenolic group in the flavonoid B-ring of 2, while exhibiting “near identical” HMBC spectra that attest to high congruence of their glycosidic moieties.
From a more general point-of-view, the use of QM-based HiFSA definitive structure elucidation of natural products holds several potential promises, summarized below.
(a) Computer-aided structural assignment may be accomplished in the pharmacopeial context, with HiFSA profiles potentially becoming the basis of pharmacopeial reference standards. They encapsulate the complete interpretation of an NMR spectrum including chemical shifts, coupling constants, and intensities of each resonance within the complicatedly overlapped molecular fingerprints. This permits reliable replication of the NMR spectrum at any field strength, as well as offer means of deconstruction of signals originating from complex mixtures, including impurities. In contrast to the experimental data, the HiFSA-encoded spectrum contains only chemical information of the target molecule, e.g., 1 as shown in Figure 3 (B), free from residual solvents and/or impurities, as well as free from noise. This enables advanced quantum mechanical analysis and facilitates accurate quantitative measurements.16,30
(b) HiFSA profiles can serve as foundation for quantitative NMR (qNMR) measurements. Most widely used at present is conventional integration qHNMR (INT-qHNMR), measuring the area under the curve of a target signal. The disadvantage of INT-qHNMR is that it cannot recognize a resonance overlay, making the judgement of signal area more subjective than desirable. Furthermore, integration may introduce bias from impurities if the signal chosen for measurement is not “pure”. To overcome this issue, deconvolution algorithms have been introduced that typically rely on peak- or line-fitting.31 However, deconvolution-based integration cannot fit a non-linear correlation pattern (or a signal exhibiting higher-order effects) and/or complex overlapped signals, thereby leading to erroneous integration. In contrast, the QM-based quantification can readily accommodate higher-order effects and achieve accurate results in such cases.
(c) HiFSA profiles are universal in that they can be scaled to different field strengths. As nuclear resonance frequencies are magnetic field independent (i.e., resonance frequency (Hz) = chemical shift (δ, ppm) × spectroscopy frequency [MHz]), calculated spectra derived from QM-based HiFSA profiles match experimental data acquired at any magnetic field strengths, as shown in Figure 5. Accordingly, HiFSA profiles are inherently portable, in that they enable users of low-field benchtop NMR instrumentation to take advantage of the HiFSA profiles derived from measurements at higher magnetic fields. Assuming proper NMR acquisition and processing methodologies, HiFSA-based measurements impart elements of dependability and orthogonality, as they manifest the fundamental principles of QM. One additional advantage of HiFSA-based quantitation is its ability to utilize the inherent correlations between NMR spins and the resulting lines in the spectrum to derive quantitative measures (both populations and integrals),16 while remaining sensitive to even small deviations from the QM model. This enables a higher degree of automation and reduces the risk of missing unknown and/or unexpected impurities.
(d) HiFSA provides additional, otherwise missing elements to the data evaluation process: HiFSA extracts all relevant chemical shifts and all coupling constants, even in the presence of signal overlap, and despite the presence of non-first order/higher order effects. As such, HiFSA makes NMR analysis more independent from human (visual) data interpretation. Such an approach streamlines and enhances the characterization of pharmacopeial articles and offers a pathway for introduction of affordable benchtop NMR instrumentation into pharmaceutical and dietary supplement manufacturing and quality operations. This will serve to enhance and/or supplant currently more prevalent and well-established, but often less-efficient mainstay analytical methodologies.
Figure 5.

Experimental (″expt″) and HiFSA-calculated (″calc″) spectra of 1H spin system fit of 1 in the mixture of DMSO-d6 and methanol-d4 at (A) 300 MHz and (B) 60 MHz.
EXPERIMENTAL SECTION
Materials and Reagents.
Kaempferol-3-O-robinoside-7-O-glucoside (Lot No.: F054H0) was obtained from USP (Rockville, MD, USA). The sample was stored at 4°C until analyzed. Deuterated solvents, DMSO-d6 (99.9 atom % D), methanol-d4 (99.9 atom % D), and D2O (99.8 atom % D), were obtained from Cambridge Isotope Laboratories Inc. (Andover, MA, USA).
Sample Preparation.
The analytes were prepared at temperatures between 15°C and 30°C and at 20% to 60% relative humidity. The weighed amounts of sample were at least twice the minimum weight of the ultra-micro balance (Mettler Toledo, Columbus, OH, USA) used (not less than 4 mg). Analytes were weighed directly into a tared HPLC vial, diluted with the appropriate solvent, capped and vortexed until full dissolution could be visually confirmed.
General Instrumentation.
1H NMR experiments were performed on Bruker Ascend-600 (Billerica, MA, USA), JEOL Eclipse+ 300 (Tokyo, Japan), and Magritek Spinsolve 60 (Malvern, PA, USA) spectrometers in 5-mm NMR tubes (Norell, Landisville, NJ, USA). A Bruker AVANCE AVII 900 MHz (1H) spectrometer equipped with 5-mm TCI and TXI inverse detection cryoprobes (Billerica, MA, USA) was used for HiFSA profile development. All other NMR measurements were acquired on a Bruker Ascend-600 spectrometer using Bruker standard pulse sequences. The samples were dissolved in 600 μL of neat NMR solvent, or NMR solvent mixture, dispensed by an analytical syringe (Valco Instruments, Baton Rouge, LA, USA).
NMR Acquisition Parameters.
Acquisition of 1H NMR spectra was as follows: 16 scans (NS), 0.12 s acquisition time (AQ), collecting 64k of time domain (TD) data, and a relaxation delay (D1) of 2 s. Acquisition of quantitative 1H NMR (qHNMR) spectra was as follows: 64 scans (NS), 4 dummy scans (DS), 4 s acquisition time (AQ), collecting 64k of time domain (TD) data, 90° excitation pulse, and a relaxation delay (D1) of 60 s. Acquisition of 13C NMR spectra was as follows: 2048 scans (NS), collecting 32k of time domain (TD) data, and using a relaxation delay (D1) of 2 s. Acquisition of 13C APT NMR spectra was as follows: 16384 scans (NS), collecting 65k of time domain (TD) data, and a relaxation delay (D1) of 2 s. Acquisition of 1H-1H gradient-enhanced homonuclear correlation spectroscopy (COSY) 2D spectra: 2k data points in F2 and 256 increments in F1, using a spectrum width (SW) of 8400 Hz in each dimension. A total of 8 scans were collected using a 90° excitation pulse, acquisition time (AQ) of 0.25 s, and a relaxation delay (D1) of 60 s. Acquisition of 1H-13C Heteronuclear Single-Quantum Correlation (HSQC) 2D spectra: SW and transmitter frequency offset for channel F2 were the middle and the occupied width of the 1H spectrum, respectively; the analogous center and total width settings were used in the F1 13C dimension; the F1 T2 value (CNST2) was 145 Hz; 16 scans (NS) were collected per increment. Acquisition of 1H,13C-heteronuclear multiple bond correlation (HMBC): SW and transmitter frequency offset for channel F2 were the middle and the occupied width of the 1H spectrum, respectively; the analogous center and total width settings were used in the F1 13C dimension; the CNST13 value was 8 Hz; 16 scans (NS) were collected per increment. Receiver gain (RG) settings were adjusted automatically (RGA command) for all spectra.
NMR Data Processing.
The spectra were processed and analyzed using MestReNova software (v12.0.4-22023, Mestrelab Research, Santiago de Compostela, Spain) and referenced to the central line of the residual DMSO signal (2.5000 ppm). For 1D NMR spectra, line resolution was improved by applying a Gaussian-Lorentzian window functions (GB 1 and LB −0.3) and four times zero-filling prior to Fourier transformation of the FID. Baseline correction using a 5th order polynomial function and phase correction were performed manually. For COSY and HMBC experiments, line resolution was improved by applying a sine (0) window function and proper zero-filling plus linear prediction. Baseline correction using a 3rd order polynomial function and no phase correction were performed. For HSQC experiments, line resolution was improved by applying a 90° shifted sine window function and proper zero-filling plus linear prediction. Baseline correction used a 3rd order polynomial function, and phase correction was performed automatically.
Quantum Mechanical Analysis.
The 1H iterative full spin analysis (HiFSA) was conducted using PERCH NMR software (v.2013.1) from PERCH Solutions Ltd. (Kuopio, Finland). The PMS test files were converted to XML files. A spin system calculation (“simulation”) feature in MestReNova software was used to generate 1H NMR spectra from the XML files at different magnetic field strengths.
With PERCH NMR software discontinued as a commercial product, the QM analysis was also reproduced using the pre-release version of Cosmic Truth (CT; ct.nmrsolutions.io), a web-based, client/server software for automatic and semi-automatic spectrum analysis from NMR Solutions Ltd. (Kuopio, Finland). Similar to PERCH, CT requires at least one 1H 1D NMR spectrum in JCAMP format and the corresponding structure in MOL or SDF formats as inputs. While the general workflow of the analysis in CT is analogous to that in PERCH, the CT’s automated assignment procedure is more advanced and the overall process considerably faster due to CT taking advantage of recent hardware and programming developments for optimized calculations.
A detailed numerical comparison of the HiFSA profiles obtained with PERCH and CT (Figure S7, Supporting Information) shows that the largest differences in the chemical shifts between these software packages are about 3 times the digital point resolution of the measurement (below 0.05 Hz). The standard deviation for the chemical shifts is within 0.02 Hz, i.e., well below the point resolution; and the standard deviation for the coupling constants is within 0.17 Hz, i.e., about 1/8 of the average line width of 1.4 Hz. Notably, the biggest deviations relate to H-5, H-6a, and H-6b of the glucose in the rutinose moiety, which also produce the signals with the broadest line widths. This indicates that dynamic effects such as intrasaccharide rotation within the robinose moiety are the main cause of these uncertainties. The chemical shifts and the coupling constants for the rest of the molecule were in excellent agreement when determined by the two software tools.
These results also provide evidence for the estimation of a minimum coupling constant that can be determined by HiFSA. For the present 1H NMR spectra measured in DMSO-d6, with natural line widths in the 1-2 Hz range, and considering that the median of between the observed Δδ (0.02 Hz) and the ΔJ (0.17 Hz) standard deviation values is, 0.09 Hz, only J values ≥ 0.10 Hz should be regarded as significant and reportable coupling constants, for this class of compounds, and analyzed in the chosen solvents.
Other software capable of performing HiFSA has been reviewed previously.12,13
Formula Confirmation of 1 via Mass Spectrometric Analysis.
The single peak was detected using a Q-TOF Mass Spectrometer (G6540B), equipped with Dual-Spray Agilent Jet Stream (AJS) source (Agilent Technologies, Santa Clara, CA, USA). The acquisition mode range was 50 −1000 (m/z). The gas temperature was 300°C; gas flow was 8 1/min; nebulizer was under 35 psi. In a positive mode, the flow was 1.5 mL/min; nozzle voltage was 1000 V. The protonated mass of 1 was determined to be 757.2196 [M + H]+ m/z (calculated for the formula is C33H40O20), confirming the molecular mass of protonated kaempferol-3-O-robinoside-7-O-glucoside.
Supplementary Material
ACKNOWLEDGEMENTS
The authors gratefully acknowledge partial support of this study through grant U41 AT008706 from the Office of Dietary Supplements (ODS) and National Center for Complementary and Integrative Health (NCCIH) of the National Institutes of Health (NIH). Furthermore, support from the Research and Innovation team at the U.S. Pharmacopeial Convention (USP) is gratefully acknowledged. In particular, we would like to recognize the collegial support from Dr. Jaap Venema, Mr. Michael Levy, and Dr. Michael Ambrose. The authors are also grateful to Dr. Amit Agarwal of Natural Remedies Pvt. Ltd. (Bengaluru, Karnataka, India) for providing inspiration and extending generous support. Finally, we would like to recognize Drs. Michael Nelson and Aaron Urbas from the National Institute of Standards and Technology (NIST) for granting access to the Magritek Spinsolve 80 instrument.
DEDICATION
This article is dedicated to Dr. A. Douglas Kinghorn for his pioneering work on bioactive natural products, his exemplary editorial leadership, and his devoted scholarship in pharmacognosy.
Footnotes
Notes
Matthias Niemitz is the founder and president of NMR Solutions Ltd., and the founder and former CEO of PERCH Solutions Ltd. The other authors declare no competing financial interests.
Supporting Information
NMR spectra (1D 1H and 13C NMR, and 2D 1H,1H-COSY, 1H,13C-HSQC, and 1H,13C-HMBC) for kaempferol-3-O-robinoside-7-O-glucoside (1) in solvent mixture of DMSO-d6 and D2O. 1H,13C-HMBC NMR spectrum for quercetin-3-O-robinoside-7-O-glucoside (2) in mixture of DMSO-d6 and D2O, and comparison of the HiFSA profiles of 1 obtained with PERCH and CT software.
NMR FIDs and other raw data are available free-of-charge at the Harvard Dataverse at https://doi.org/10.7910/DVN/SMSUCM.
Contributor Information
Sitaram Bhavaraju, United States Pharmacopeial Convention, Rockville, Maryland 20852, United States.
David Taylor, United States Pharmacopeial Convention, Rockville, Maryland 20852, United States.
Matthias Niemitz, NMR Solutions Oy, Kuopio, Northern Savonia 70110, Finland.
David C. Lankin, Department of Pharmaceutical Sciences, University of Illinois at Chicago, Chicago, Illinois 60612, United States.
Anton Bzhelyansky, United States Pharmacopeial Convention, Rockville, Maryland 20852, United States.
Gabriel I. Giancaspro, United States Pharmacopeial Convention, Rockville, Maryland 20852, United States.
Yang Liu, United States Pharmacopeial Convention, Rockville, Maryland 20852, United States.
Guido F. Pauli, Department of Pharmaceutical Sciences, University of Illinois at Chicago, Chicago, Illinois 60612, United States.
REFERENCES
- (1).Briefel RR; Johnson CL Ann. Rev. Nutr. 2004, 24, 401–431. [DOI] [PubMed] [Google Scholar]
- (2).Potischman N; Gahche JJ; Dwyer JT; Bailey RL J. Nutr. 2017, 147, 1968–1976. [DOI] [PMC free article] [PubMed] [Google Scholar]
- (3).Glisson JK; Minor DS; Walker LA; Gurley BJ Archiv. Internal Med. 2011, 171, 476–477. [DOI] [PubMed] [Google Scholar]
- (4).Mundkinajeddu D; Sawant LP; Koshy R; Akunuri P; Singh VK; Mayachari A; Sharaf MHM; Balasubramanian M; Agarwal A ISRN Anal. Chem. 2014, 2014, 351547. [Google Scholar]
- (5).The United States Pharmacopoiea (USP). Ashwagandha Root Dry Extract. In: USP–NF. Rockville, MD: USP; 1 May 2020. [Google Scholar]
- (6).Liu Y; Chen S-N; McAlpine JB; Klein LL; Friesen JB; Lankin DC; Pauli GF J. Nat, Prod. 2014, 77, 611–617. [DOI] [PubMed] [Google Scholar]
- (7).Pauli GF; Jaki BU; Lankin DC J. Nat, Prod. 2005, 68, 133–149. [DOI] [PubMed] [Google Scholar]
- (8).Pauli GF; Gödecke T; Jaki BU; Lankin DC J. Nat, Prod. 2012, 75, 834–851. [DOI] [PMC free article] [PubMed] [Google Scholar]
- (9).Jaki BU; Bzhelyansky A; Pauli GF Magn. Reson. Chem. 2021, 59, in press.( 10.1002/mrc.5099) [DOI] [PubMed] [Google Scholar]
- (10).Dias DA; Jones OAH; Beale DJ; Boughton BA; Benheim D; Kouremenos KA; Wolfender J-L; Wishart DS Metabolites 2016, 6, 46. [DOI] [PMC free article] [PubMed] [Google Scholar]
- (11).Bisson J; Simmler C; Chen S-N; Friesen JB; Lankin DC; McAlpine JB; Pauli GF Nat. Prod. Rep. 2016, 33, 1028–1033. [DOI] [PMC free article] [PubMed] [Google Scholar]
- (12).Choules MP; Bisson J; Gao W; Lankin DC; McAlpine JB; Niemitz M; Jaki BU; Franzblau SG; Pauli GF J. Org. Chem. 2019, 84, 3055–3073. [DOI] [PMC free article] [PubMed] [Google Scholar]
- (13).Achanta PS; Jaki BU; McAlpine JB; Friesen JB; Niemitz M; Chen S-N; Pauli GF J. Pharm. Biomed. Anal. 2021, 192, 113601. [DOI] [PMC free article] [PubMed] [Google Scholar]
- (14).Laatikainen R; Hassinen T; Lehtivarjo J; Tiainen M; Jungman J; Tynkkynen T; Korhonen S-P; Niemitz M; Poutiainen P; Jääskeläinen O; Väisänen T; Weisell J; Soininen P; Laatikainen P; Martonen H; Tuppurainen KJ Chem. Inform. Modeling 2014, 54, 419–430. [DOI] [PubMed] [Google Scholar]
- (15).Napolitano JG; Lankin DC; Graf TN; Friesen JB; Chen S-N; McAlpine JB; Oberlies NH; Pauli GF J. Org. Chem. 2013, 78, 2827–2839. [DOI] [PMC free article] [PubMed] [Google Scholar]
- (16).Phansalkar RS; Simmler C; Bisson J; Chen S-N; Lankin DC; McAlpine JB; Niemitz M; Pauli GF J. Nat. Prod. 2017, 80, 634–647. [DOI] [PMC free article] [PubMed] [Google Scholar]
- (17).Roslund MU; Tähtinen P; Niemitz M; Sjöholm R Carbohydr. Res. 2008, 343, 101–112. [DOI] [PubMed] [Google Scholar]
- (18).Laatikainen R; Niemitz M; Malaisse WJ; Biesemans M; Willem R Magn. Res. Med. 1996, 36, 359–365. [DOI] [PubMed] [Google Scholar]
- (19).Laatikainen R; Tiainen M; Korhonen S-P; Niemitz M In Encyclopedia of Magnetic Resonance; Harris RK; Wasylishen RE, Eds.; John Wiley & Sons, Ltd: Chicester, 2011. [Google Scholar]
- (20).Pauli GF J. Nat. Prod. 2000, 63, 834–838. [DOI] [PubMed] [Google Scholar]
- (21).Napolitano JG; Lankin DC; Chen S-N; Pauli GF Magn. Reson. Chem. 2012, 50, 569–575. [DOI] [PMC free article] [PubMed] [Google Scholar]
- (22).Dashti H; Wedell JR; Westler WM; Tonelli M; Aceti D; Amarasinghe GK; Markley JL; Eghbalnia HR Anal, Chem. 2018, 90, 10646–10649. [DOI] [PMC free article] [PubMed] [Google Scholar]
- (23).Haasnoot CAG; de Leeuw FAAM; Altona C Tetrahedron 1980, 36, 2783–2792. [Google Scholar]
- (24).Falk M; Smith DG; McLachlan J; McInnes AG Canad. J. Chem. 1966, 44, 2269–2281. [Google Scholar]
- (25).Nam J-W; Phansalkar RS; Lankin DC; McAlpine JB; Leme-Kraus AA; Vidal CMP; Gan L-S; Bedran-Russo A; Chen S-N; Pauli GF J. Org. Chem. 2017, 82, 1316–1329. [DOI] [PMC free article] [PubMed] [Google Scholar]
- (26).Zhou B; Alania Y; Reis M; Phansalkar R; Nam J-W; McAlpine JB, Chen S-N, Bedran-Russo A; Pauli GF J. Org. Chem. 2020, 85, 8462–8479. [DOI] [PMC free article] [PubMed] [Google Scholar]
- (27).Bubb WA Concepts Magn. Res. A 2003, 19A, 1–19. [Google Scholar]
- (28).Wang Y-H; Avula B; Fu X; Wang M; Khan IA Planta Med 2012, 78, 834–837. [DOI] [PubMed] [Google Scholar]
- (29).Quesada-Moreno MM; Virgili A; Monteagudo E; Claramunt RM; Avilés-Moreno JR; López-González JJ; Alkorta I; Elguero J Analyst 2018, 143, 1406–1416. [DOI] [PubMed] [Google Scholar]
- (30).Tiainen M; Soininen P; Laatikainen RJ Magn. Reson. 2014, 242, 67–78. [DOI] [PubMed] [Google Scholar]
- (31).Hughes TS; Wilson HD; de Vera IMS; Kojetin DJ PLoS One 2015, 10, e0134474–e0134474. [DOI] [PMC free article] [PubMed] [Google Scholar]
Associated Data
This section collects any data citations, data availability statements, or supplementary materials included in this article.