

Abstract
Objectives
The aim of this analysis was to characterize transmitted drug resistance (TDR) in Strategic Timing of Antiretroviral Treatment (START) study participants by next-generation sequencing (NGS), a sensitive assay capable of detecting low-frequency variants.
Methods
Stored plasma from participants with entry HIV RNA > 1000 copies/mL were analysed by NGS (Illumina MiSeq). TDR was based on the WHO 2009 surveillance definition with the addition of reverse transcriptase (RT) mutations T215N and E138K, and integrase strand transfer inhibitor (INSTI) surveillance mutations (Stanford HIVdb). Drug resistance mutations (DRMs) detected at three thresholds are reported: > 2%, 5% and 20% of the viral population.
Results
Between 2009 and 2013, START enrolled 4684 antiretroviral therapy (ART)-naïve individuals in 35 countries. Baseline NGS data at study entry were available for 2902 participants. Overall prevalence rates of TDR using a detection threshold of 2%/5%/20% were 9.2%/5.6%/3.2% for nucleoside reverse transcriptase inhibitors (NRTIs), 9.2%/6.6%/4.9% for non-NRTIs, 11.4%/5.5%/2.4% for protease inhibitors (PIs) and 3.5%/1.6%/0.1% for INSTI DRMs and varied by geographic region. Using the 2% detection threshold, individual DRMs with the highest prevalence were: PI M46IL (5.5%), RT K103NS (3.5%), RT G190ASE (3.1%), T215ISCDVEN (2.5%), RT M41L (2.2%), RT K219QENR (1.7%) and PI D30N (1.6%). INSTI DRMs were detected almost exclusively below the 20% detection threshold, most commonly Y143H (0.4%), Q148R (0.4%) and T66I (0.4%).
Conclusions
Use of NGS in this study population resulted in the detection of a large proportion of low-level variants which would not have been detected by traditional Sanger sequencing. Global surveillance studies utilizing NGS should provide a more comprehensive assessment of TDR prevalence in different regions of the world.
Keywords: antiretroviral therapy, HIV drug resistance, HIV, next-generation sequencing
Introduction
Transmitted drug resistance (TDR) refers to the presence of one or more HIV-1 drug resistance mutations (DRMs) in individuals with no prior history of antiretroviral drug exposure. TDR has been associated with reduced susceptibility to antiretroviral agents and increases the risk of a suboptimal virological response to initial antiretroviral therapy (ART) [1,2]. Multiple studies from the US and Europe have described the prevalence of TDR in treatment-naïve individuals, which typically ranges from 5% to 15% [3–8]. Available data from resource limited countries have shown that TDR is becoming an emerging health issue, with increasing prevalence rates being reported, particularly for nonnucleoside reverse transcriptase inhibitors (NNRTIs) [3,9].
Global surveillance studies of TDR have primarily used standard Sanger sequencing looking for reverse transcriptase (RT) and protease inhibitor (PI) DRMs, with prevalence rates varying by geographic region [3,9]. There are limited data on global TDR using next-generation sequencing (NGS), which is a highly sensitive assay capable of detecting low-frequency (minor) variants [10–12]. NGS can identify the prevalence of DRMs associated with TDR in a population of individuals while allowing for the detection of low-frequency drug-resistant related variants which may have reduced viral fitness.
The Strategic Timing of Antiretroviral Treatment (START) study is an international trial of immediate vs. deferred ART initiation among treatment-naïve HIV-positive individuals with CD4 counts > 500 cells/μL. Participants were enrolled from 215 sites in 35 countries, representing both resource-rich and resource-limited regions of the world and included North America, Europe, Australia, Latin America, Africa and Asia. A study of TDR in a subset of START study participants was previously described using locally performed Sanger sequencing available almost exclusively in resource-rich regions [13]. In this analysis, we applied a more sensitive assay for detection of drug resistance using NGS to determine TDR prevalence rates from stored specimens for nucleoside reverse transcriptase inhibitor (NRTI), NNRTI, PI and integrase strand transfer inhibitor (INSTI) DRMs at study entry in the entire START study population.
Methods
Study population
The START trial, conducted by the International Network for Strategic Initiatives in Global HIV Trials (INSIGHT), enrolled participants between April 2009 and December 2013. The study design and data collection plan have previously been reported [14]. A plasma sample, taken up to 60 days prior to enrolment, was obtained from participants consenting to the storage of specimens. Samples were stored centrally at the INSIGHT laboratory repository in Cinnaminson, New Jersey, prior to shipment to the Centre for Genomic Medicine, Rigshospitalet, Copenhagen, for NGS analysis. NGS was attempted on all samples with HIV RNA > 1000 copies/mL at study entry.
Sample preparation, amplification of viral RNA and sequencing
The plasma samples were thawed from −80°C freezers at room temperature. Plasma (500 μL) was transferred to new RNAse-free tubes and centrifuged at 2000 g for 15 min. The supernatant was extracted and centrifuged at 21 000 g for 75 min and 360 μL of the top supernatant was discarded. Viral RNA was extracted using QIAamp viral RNA extraction kit (Qiagen, Hilden, Germany) on a QIAcube robot using the manufacturer’s guidelines. Reverse transcription polymerase chain reaction (RT-PCR) was used to amplify two amplicons from the viral RNA. The primer sequences (available in Table S5) were designed by Gall et al. [15]. The reverse transcription and amplification were performed using SuperScript III One-Step RT-PCR System with Platinum Taq High Fidelity (Thermo Fisher Scientific, Waltham, MA, USA) according to the manufacturer’s instructions with 10 μL viral RNA used for each amplicon. The PCR products were purified using Ampure XP (Agen-court, Beckman Coulter, Brea, CA, USA) PCR purification according to the manufacturer’s instructions.
The two amplicons were pooled for each sample prior to library preparation. Libraries were prepared using Nextera XT (Illumina) according to manufacturer’s protocol, except that 1.5 × the library normalization beads was used in the final normalization step. DNA libraries were sequenced on an Illumina MiSeq machine using a MiSeq 150-cycle V3 reagent kit (Illumina, San Diego, CA, USA).
HIV-1 subtyping
Subtypes were assigned to samples for which the consensus sequence information was available for at least 90% of either of the two amplicons, or at least 50% of both. The consensus sequence was analysed with REGA HIV-1 Subtyping Tool version 3 [16]. Output was manually inspected to check for the presence of subtype specific sequences within the given consensus sequence. Samples were assigned to be either a pure subtype (A–D, F, G) or a recombinant subtype in cases where the genome showed presence of sequences specific to more than one pure subtype.
Identification of drug resistance mutations with Virvarseq
Sequence reads (FASTQ files) were analysed with VirVarSeq v.20140929, which calls variants at the codon level [17]. VirVarSeq was run with HIV-1 HXB2 as reference and with default settings, except that soft-clipping as defined by the aligner were ignored and without the mixture model step (as recommended by Huber et al. [18]). From the output, we extracted amino acid frequencies in the pol gene from amino acid position 1 to 935 where positions 1–99 encode protease (PR) protein, positions 100–659 encode RT protein, and positions 660–935 partially encode integrase (IN) protein (our amplicon did not cover position 936–947).
Definition of transmitted drug resistance and phenotypic drug susceptibility
As in a previous paper from START reporting the results of locally performed Sanger sequencing, TDR was based on the WHO 2009 surveillance list with the addition of RT mutations T215N and E138K [13,19]. INSTI mutations, which are not included on this list, were defined as those on the Stanford HIVdb surveillance DRM list, namely T66AIK, E92Q, F121Y, G140ACS, Y143CHR, S147G, Q148HKR and N155HS [20]. Interpretation of phenotypic drug susceptibility was standardized using the Stanford HIVdb algorithm v.8.6 which defines drug resistance as none, potential low level, low level, intermediate or high [21]. To achieve consistency with WHO resistance reports, predicted potential low level is not reported. It is noted that the Stanford HIVdb algorithm considers a much wider range of mutations than considered by the WHO 2009 surveillance list (including the integrase gene) and these additional TDR DRMs detected by NGS were included for predicted phenotypic drug susceptibility.
Sequencing depth and thresholds for calling DRMs
Sequence read coverage depth varied markedly across the sequenced amplicons (highest in PR, intermediate in RT, lowest in IN). We stipulated a minimum read depth of 200 across the region spanning all relevant mutations within each gene. For WHO surveillance mutations this comprised codons 23–90 of PR, codons 41–230 of RT, and codons 66–155 of IN; for Stanford predicted phenotypic drug susceptibility this comprised codons 10–90 of PR, codons 41–348 of RT and codons 51–263 of IN. This resulted in different denominators for different drug classes, which were therefore analysed separately. DRMs detected at three thresholds by NGS are reported: > 2%, 5% and 20% of the viral population (the latter comparable to the detection threshold for Sanger sequencing).[11,18]
Statistical methods
If two or more mutations were present in the analysis of drug class-specific TDR by detection threshold (Fig. 1), the highest frequency was used in the analysis. Fisher’s exact test (two-sided) was used to test the association between geographical region and whether TDR variants were observed at 2–5%, 5–20% or > 20%. Logistic regression analysis was used to examine predictors of drug class-specific TDR. Odds ratios were adjusted a priori for the effects of geographical region, calendar year of enrolment and age. Subtype was not included in these models, as independent effects of subtype and geographical region could not be estimated due to the very strong association between these two variables. All statistical analyses were conducted using STATA v.15 (StataCorp, Houston, TX, USA). A P-value < 0.05 was deemed significant.
Fig. 1.

Prevalence of transmitted drug resistance by detection threshold and geographical region. Data also shown in tabular form in Table S1. WHO, World Health Organization; DRM, drug resistance mutation; NRTI, nucleoside reverse transcriptase inhibitor; NNRTI, non-NRTI; PI, protease inhibitor; INSTI, integrase strand transfer inhibitor.
Results
Study participant baseline characteristics
The START study enrolled 4684 ART-naïve individuals from 35 countries between April 2009 and December 2013 [14]. Europe had the highest number of participants (1539), followed by Latin America (1174), Africa (999), USA (507), Asia (356) and Australia (109). Of the 4072 individuals with viral load > 1000 copies/mL (and thus eligible for this study), 3785 (93%) had a baseline specimen analysed by NGS. Baseline characteristics of these individuals (see Table 1) showed a median CD4 count of 643 cells/μL, median HIV RNA of 18 105 copies/mL, and median time since diagnosis of 0.96 years. Using the criteria described in the Methods section, 2901 (77%) specimens produced an evaluable result for the assessment of protease TDR, 2180 (58%) for NRTI/NNRTI TDR, and 1338 (35%) for integrase TDR. Median (IQR) read depth was 13 134 (5644–26 671) in protease, 6891 (3078–14 194) in RT, and 2240 (987–5213) in IN. Subtype B was the most common subtype, followed by subtype C (Table 1).
Table 1.
Baseline characteristics
| Factor | Individuals enrolled in START (%) | Individuals with sample for NGS (%) | Individuals with evaluable NGS data* | ||
|---|---|---|---|---|---|
| PR (%) | RT (%) | IN (%) | |||
| Total | 4684 | 3785 | 2901 | 2180 | 1338 |
| Age (years) | |||||
| 18–29 | 1322 (28) | 1089 (29) | 841 (29) | 648 (30) | 403 (30) |
| 30–39 | 1593 (34) | 1289 (34) | 991 (34) | 740 (34) | 449 (34) |
| 40–49 | 1216 (26) | 971 (26) | 737 (25) | 545 (25) | 326 (24) |
| ≥50 | 553 (12) | 436 (12) | 332 (11) | 247 (11) | 160 (12) |
| Gender | |||||
| Male | 3427 (73) | 2891 (76) | 2282 (79) | 1744 (80) | 1108 (83) |
| Female | 1257 (27) | 894 (24) | 619 (21) | 436 (20) | 230 (17) |
| Ethnicity | |||||
| Black | 1408 (30) | 1051 (28) | 699 (24) | 496 (23) | 252 (19) |
| Hispanic | 637 (14) | 499 (13) | 393 (14) | 305 (14) | 219 (16) |
| Asian | 388 (8) | 325 (9) | 259 (9) | 190 (9) | 105 (8) |
| White | 2087 (45) | 1780 (47) | 1457 (50) | 1121 (51) | 714 (53) |
| Other | 164 (4) | 130 (3) | 93 (3) | 68 (3) | 48 (4) |
| Acquisition mode | |||||
| IDU | 64 (1) | 47 (1) | 37 (1) | 648 (30) | 15 (1) |
| MSM | 2587 (55) | 2216 (59) | 1776 (61) | 740 (34) | 922 (69) |
| Heterosexual | 1788 (38) | 1340 (35) | 951 (33) | 545 (25) | 348 (26) |
| Other | 245 (5) | 182 (5) | 137 (5) | 247 (11) | 53 (4) |
| CD4 | |||||
| 500–599 | 1474 (31) | 1263 (33) | 982 (34) | 741 (34) | 447 (33) |
| 600–699 | 1461 (31) | 1240 (33) | 960 (33) | 730 (33) | 462 (35) |
| ≥700 | 1749 (37) | 1282 (34) | 959 (33) | 709 (33) | 429 (32) |
| Viral load (copies/mL) | |||||
| 0–999 | 603 (13) | N/A | - | - | - |
| 1000–9999 | 1494 (32) | 1386 (37) | 868 (30) | 607 (28) | 360 (27) |
| 10 000–99 999 | 2091 (45) | 1950 (52) | 1635 (56) | 1249 (57) | 775 (58) |
| ≥ 100 000 | 487 (10) | 449 (12) | 398 (14) | 324 (15) | 203 (15) |
| Unknown | 9 (0) | N/A | - | - | - |
| Region | |||||
| Europe | 1539 (33) | 1353 (36) | 1117 (39) | 869 (40) | 541 (40) |
| USA | 507 (11) | 397 (10) | 304 (10) | 226 (10) | 146 (11) |
| Latin America | 1174 (25) | 911 (24) | 699 (24) | 538 (25) | 374 (28) |
| Asia | 356 (8) | 298 (8) | 239 (8) | 174 (8) | 97 (7) |
| Africa | 999 (21) | 731 (19) | 467 (16) | 317 (15) | 145 (11) |
| Australia | 109 (2) | 95 (3) | 75 (3) | 56 (3) | 35 (3) |
| Year of enrolment | |||||
| 2009/10 | 1001 (21) | 852 (23) | 611 (21) | 475 (22) | 335 (25) |
| 2011 | 890 (19) | 757 (20) | 567 (20) | 448 (21) | 314 (23) |
| 2012 | 1544 (33) | 1187 (31) | 989 (34) | 755 (35) | 431 (32) |
| 2013 | 1249 (27) | 989 (26) | 734 (25) | 502 (23) | 258 (19) |
| Time from diagnosis to enrolment | |||||
| < 6 months | 1540 (33) | 1257 (33) | 977 (34) | 757 (35) | 471 (35) |
| 6 months to < 1 year | 767 (16) | 645 (17) | 515 (18) | 374 (17) | 229 (17) |
| 1 to < 2 years | 772 (16) | 640 (17) | 494 (17) | 373 (17) | 227 (17) |
| ≥ 2 years | 1605 (34) | 1243 (33) | 915 (32) | 676 (31) | 411 (31) |
| Subtype | |||||
| B | - | 1959 (52) | 1658 (57) | 1659 (76) | 928 (69) |
| C | - | 229 (6) | 204 (7) | 204 (9) | 104 (8) |
| BF | - | 159 (4) | 140 (5) | 140 (6) | 72 (5) |
| AE | - | 147 (4) | 144 (5) | 144 (7) | 73 (5) |
| Other | - | 703 (19) | 599 (21) | 599 (27) | 160 (12) |
| Unknown | - | 588 (16) | 156 (5) | 156 (7) | 1 (0) |
START, Strategic Timing of Antiretroviral Treatment; NGS, next-generation sequencing; PR, protease; RT, reverse transcriptase; IN, integrase. Countries with ≥ 50 participants enrolled. Europe: UK (339), Germany (312), Spain (234), France (111), Belgium (102), Greece (101); Africa: South Africa (518), Uganda (348); Latin America: Brazil (619), Argentina (216), Peru (215); USA (507); Asia: Thailand (247), India (91); Australia (109).
Minimum 200 reads across all WHO surveillance resistance positions within gene.
Prevalence of transmitted drug resistance
Figure 1 shows the prevalence of TDR, overall and by geographical region, at different detection thresholds. Overall, at the 2% threshold, TDR prevalence was 9.2% for NRTI DRMs, 9.2% for NNRTI DRMs, 11.4% for PI DRMs, and 3.5% for INSTI DRMs. Using a 5% threshold, the respective values were 5.6%, 6.6%, 5.5% and 1.6%; and using a 20% threshold the respective values were 3.2%, 4.9%, 2.4% and 0.1%. Comparing the 2% and 20% thresholds of detection for TDR DRMs by drug class, there was a 4.8 (11.4%/2.4%) and 35-fold (3.5% vs. 0.1%) greater proportion of viruses with PI and INSTI minor variants, respectively, whereas this ratio was 2.9 and 1.9 for TDR DRMs in the NRTI and NNRTI drug classes, respectively.
A comparatively high prevalence of NNRTI DRMs was observed in the USA (mainly mutations above the 20% threshold), as was a comparatively high prevalence of NRTI DRMs in Australia (mainly mutations above the 5% threshold). Otherwise, there was no clear geographical variation in the prevalence of DRMs for any drug class, with the apparent variation in integrase TDR probably due to the small number of cases. Nevertheless, there was some evidence of geographical variability in the level of DRM variants, conditional on being above the 2% threshold: P = 0.05 for NRTI TDR; P = 0.007 for NNRTI; P = 0.11 for PI TDR. The NRTI effect was mainly driven by a relative deficit of variants at 5–20% in Europe, and the NNRTI effect by a relative excess of variants at 2–5% in Asia and Europe, and a relative excess at 5–20% in Africa. There also was some evidence that TDR prevalence differed by HIV-1 subtype (data not shown), but these were reflective of the geographical distribution of different subtypes.
Table 2 shows the results of a logistic regression analysis of selected predictors for drug class-specific DRMs (2% detection threshold). This confirmed the visual impression of regional variability in the prevalence NRTI DRMs (P = 0.002) and NNRTI DRMs (P = 0.02) that was observed in Fig. 1. The prevalence of PI DRMs was strongly associated with age (although lacking a clear trend) and weakly associated with gender; however, these associations were not observed in sensitivity analyses limited to mutant variants detected above the 5% or 20% threshold (results not shown). There was a weak suggestion of an overall increase in the prevalence of NNRTI DRMs (but not NRTI DRMs or PI DRMs) over the 4.5-year recruitment period to START. Calendar time trends stratified by geographical region were also examined but revealed no notable findings.
Table 2.
Logistic regression analysis of predictors of drug-class specific transmitted drug resistance (TDR) (2% threshold)
| Factor | PI (n = 2901) | NRTI (n = 2180) | NNRTI (n = 2180) | INSTI (n = 1338) | ||||||||
|---|---|---|---|---|---|---|---|---|---|---|---|---|
| TDR (%) | aOR (95% Cl) | P-value | TDR (%) | aOR (95% Cl) | P-value | TDR (%) | aOR (95% Cl) | P-value | TDR (%) | aOR (95% Cl) | P-value | |
| Age (years) | 0.002 | 0.25 | 0.85 | 0.62 | ||||||||
| 18–29 | 9.5 | 0.70 (0.52–0.94) | 7.9 | 0.75 (0.51–1.09) | 9.7 | 1.06 (0.74—1.54) | 3.7 | 1.17 (0.56–2.47) | ||||
| 30–39 | 12.8 | 1 | 10 | 1 | 8.8 | 1 | 3.1 | 1 | ||||
| 40–49 | 9.6 | 0.74 (0.54–1.01) | 8.4 | 0.78 (0.53–1.16) | 8.4 | 0.96 (0.64—1.43) | 4.3 | 1.57 (0.72–3.39) | ||||
| ≥ 50 | 16 | 1.32 (0.93–1.88) | 11.7 | 1.10 (0.69–1.76) | 10.9 | 1.19 (0.73–1.92) | 2.5 | 0.86 (0.28–2.70) | ||||
| Gender | 0.08 | 0.89 | 0.95 | 0.33 | ||||||||
| Male | 12.1 | 1 | 9.5 | 1 | 9.4 | 1 | 3.4 | 1 | ||||
| Female | 8.9 | 0.73 (0.52–1.04) | 8.0 | 0.97 (0.63–1.50) | 8.5 | 0.99 (0.65–1.50) | 3.9 | 1.52 (0.65–3.53) | ||||
| Ethnicity | 0.78 | 0.73 | 0.86 | 0.52 | ||||||||
| White | 12.4 | 1 | 10.2 | 1 | 9.6 | 1 | 3.8 | 1 | ||||
| Black | 9.2 | 0.78 (0.49–1.24) | 8.1 | 0.87 (0.51–1.47) | 8.5 | 0.81 (0.49–1.36) | 2.4 | 0.71 (0.21–2.34) | ||||
| Hispanic | 12.7 | 0.98 (0.67–1.44) | 8.5 | 0.86 (0.52–1.43) | 10.5 | 0.95 (0.59–1.53) | 3.2 | 0.64 (0.25–1.65) | ||||
| Asian | 10.4 | 1.41 (0.43–4.61) | 8.4 | 1.81 (0.51–6.51) | 7.4 | 0.64 (0.10–4.06) | 5.7 | 4.14 (0.48–35.8) | ||||
| Other | 10.8 | 0.81 (0.40–1.62) | 5.9 | 0.62 (0.22–1.78) | 7.4 | 0.68 (0.26–1.76) | 2.1 | 0.42 (0.05–3.30) | ||||
| Acquisition mode | 0.44 | 0.63 | 0.65 | 0.33 | ||||||||
| MSM | 12.2 | 1 | 18.6 | 1 | 18.0 | 1 | 3.6 | 1 | ||||
| IDU | 10.8 | 0.98 (0.34–2.82) | 0.3 | 0.59 (0.13–2.54) | 0.3 | 0.60 (0.14–2.59) | 0 | 0.00 (NE) | ||||
| Heterosexual | 10.6 | 0.88 (0.64–1.20) | 9.7 | 0.87 (0.58–1.32) | 11.0 | 1.04 (0.70–1.53) | 4.0 | 1.46 (0.69–3.09) | ||||
| Other | 7.3 | 0.59 (0.30–1.15) | 2.8 | 0.66 (0.29–1.47) | 2.4 | 0.64 (0.27–1.51) | 0 | 0.00 (NE) | ||||
| CD4 count (eells/μL) | 0.9 | 0.29 | 0.71 | 0.53 | ||||||||
| 500–599 | 11.2 | 1 | 9.2 | 1 | 8.6 | 1 | 4.3 | 1.20 (0.61–2.38) | ||||
| 600–699 | 11.5 | 1.05 (0.79–1.39) | 10.4 | 1.15 (0.81–1.62) | 9.0 | 1.04 (0.72–1.50) | 3.5 | 1 | ||||
| ≥700 | 11.6 | 1.06 (0.80–1.41) | 7.9 | 0.85 (0.59–1.24) | 10.0 | 1.16 (0.81–1.66) | 2.8 | 0.78 (0.36–1.69) | ||||
| Viral load (copies/mL) | 0.33 | 0.84 | 0.85 | 0.43 | ||||||||
| 1000–9999 | 10.9 | 0.90 (0.69–1.16) | 9.4 | 1.00 (0.72–1.41) | 9.2 | 0.93 (0.66–1.31) | 3.6 | 0.96 (0.49–1.89) | ||||
| 10 000–99 999 | 12.1 | 1 | 9.4 | 1 | 9.4 | 1 | 3.9 | 1 | ||||
| ≥ 100 000 | 9.5 | 0.77 (0.53–1.11) | 8.0 | 0.88 (0.56–1.38) | 8.3 | 0.89 (0.57–1.39) | 2.0 | 0.50 (0.17–1.44) | ||||
| World region | 0.17 | 0.002 | 0.02 | 0.59 | ||||||||
| Europe | 12.3 | 1 | 8.9 | 1 | 8.9 | 1 | 3.7 | 1 | ||||
| USA | 9.2 | 0.72 (0.47–1.11) | 12.8 | 1.53 (0.97–2.41) | 15.0 | 1.79 (1.15–2.77) | 2.1 | 0.58 (0.17–2.00) | ||||
| Latin America | 13.2 | 1.11 (0.82–1.49) | 8.4 | 1.01 (0.68–1.52) | 9.7 | 1.04 (0.71–1.53) | 4.3 | 1.08 (0.53–2.18) | ||||
| Asia | 10.0 | 0.81 (0.51–1.30) | 7.5 | 0.96 (0.51–1.81) | 7.5 | 0.73 (0.39–1.37) | 5.2 | 1.29 (0.45–3.70) | ||||
| Africa | 9.2 | 0.72 (0.49–1.05) | 6.9 | 0.88 (0.53–1.47) | 6.6 | 0.65 (0.39–1.08) | 2.1 | 0.47 (0.13–1.65) | ||||
| Australia | 9.3 | 0.77 (0.34–1.71) | 25 | 3.61 (1.88–6.95) | 7.1 | 0.76 (0.27–2.17) | 0 | 0.00 (NE) | ||||
| Year of enrolment | 0.55 | 0.25 | 0.07 | 0.50 | ||||||||
| 2009/2010 | 10.5 | 0.83 (0.59–1.16) | 11.4 | 1.41 (0.94–2.11) | 8.0 | 0.63 (0.41–0.95) | 2.1 | 0.55 (0.22–1.40) | ||||
| 2011 | 12.5 | 1.00 (0.73–1.38) | 10.5 | 1.39 (0.92–2.10) | 8.0 | 0.64 (0.42–0.97) | 4.1 | 1.07 (0.50–2.31) | ||||
| 2012 | 11.8 | 1 | 7.8 | 1 | 11 | 1 | 3.7 | 1 | ||||
| 2013 | 10.8 | 0.85 (0.63–1.16) | 8.0 | 1.05 (0.68–1.60) | 8.8 | 0.81 (0.55–1.20) | 4.3 | 1.13 (0.51–2.51) | ||||
| Diagnosis to enrolment | 0.37 | 0.43 | 0.38 | 0.18 | ||||||||
| < 6 m | 11.4 | 1 | 9.1 | 1 | 10.4 | 1 | 2.5 | 1 | ||||
| 6 m to < 1 year | 10.5 | 0.90 (0.63–1.28) | 11.2 | 1.16 (0.77–1.76) | 10.4 | 1.03 (0.68–1.56) | 3.5 | 1.62 (0.64–4.10) | ||||
| 1 year to < 2 years | 13.2 | 0.24 (0.89–1.74) | 9.1 | 0.92 (0.59–1.43) | 8.3 | 0.82 (0.52–1.28) | 3.5 | 0.90 (0.74–4.88) | ||||
| ≥ 2 years | 11 | 0.98 (0.72–1.32) | 8.1 | 0.81 (0.55–1.20) | 7.7 | 0.75 (0.51–1.10) | 4.6 | 2.44 (1.10–5.38) | ||||
Adjustment for geographical region, year of enrolment, and age. P-values are tests of heterogeneity. No adjustments made for multiple comparisons. aOR, adjusted odds ratio; NE, not estimated; CI, confidence interval; PI, protease inhibitor; NRTI, nucleoside reverse transcriptase inhibitor; NNRTI, non-NRTI; INSTI, integrase strand transfer inhibitor.
Specific DRMs observed in at least 0.5% of samples (at the 2% detection threshold) are shown in Table 3. The most common NRTI DRMs were T215 revertants (2.5%), M41L (2.2%), and K219QENR (1.7%). The T215 revertants and, to a lesser extent, M41L were mostly high-level variants representing the majority of the quasispecies (i.e. occurring in > 80% of the viral population), whereas a wider range of variant frequency was observed for K219QENR. Notably, the K65R mutation was not observed in any sample, even at the 2% threshold. M184V and M184I were detected in seven and 18 samples respectively, the latter generally as a low-level variant (2–5%). The most common NNRTI DRMs – K103NS (3.5%), G190ASE (3.1%), and E138K (1.6%) – showed diverse patterns. K103NS variants were mainly observed (60/77, 78%) in > 80% of the viral quasispecies, E138K mainly (20/34, 59%) in < 5%, and G190ASE displayed a more uniform spread. Estimates of PI TDR are strongly influenced by the M46IL mutation, which was observed in 5.5% of all samples, mostly as low-level variants (Table 3). Excluding M46IL variants would reduce estimated PI TDR (at the 2% threshold) from 11.4% to 6.6%. The D30N mutation was mainly (41/46, 89%) present as a low-level variant below 20%, whereas most (12/18, 67%) L90M were detected in > 80% of the viral quasispecies. All individual INSTI DRMs were observed below the 20% threshold, with the exception of G140S (detected at the 25% level, sample from Spain collected in 2012) and G140A (21%, sample from Peru in 2011).
Table 3.
Individual drug resistance mutations (prevalence ≥ 0.5%)
| Mutation | Variant frequency | Total | Total (%) | |||
|---|---|---|---|---|---|---|
| > 2%–5% | > 5%–20% | > 20%–80% | > 80% | |||
| NRTI | ||||||
| M41L | 6 | 10 | 7 | 24 | 47 | 2.2 |
| D67NGE | 14 | 4 | 0 | 5 | 23 | 1.1 |
| K70RE | 7 | 12 | 0 | 1 | 20 | 0.9 |
| M184VI | 15 | 6 | 2 | 2 | 25 | 1.1 |
| M184V | 3 | 1 | 1 | 2 | 7 | 0.3 |
| M184I | 12 | 5 | 1 | 0 | 18 | 0.8 |
| T215FYISCDVEN | 9 | 3 | 1 | 41 | 54 | 2.5 |
| K219QENR | 15 | 10 | 3 | 10 | 38 | 1.7 |
| NNRTI | ||||||
| K103NS | 1 | 4 | 12 | 60 | 77 | 3.5 |
| E138K | 20 | 10 | 1 | 3 | 34 | 1.6 |
| Y181CIV | 3 | 4 | 1 | 9 | 17 | 0.8 |
| Y188LHC | 8 | 2 | 0 | 2 | 12 | 0.6 |
| G190ASE | 28 | 17 | 8 | 14 | 67 | 3.1 |
| PI | ||||||
| D30N | 24 | 17 | 3 | 2 | 46 | 1.6 |
| M46IL | 91 | 36 | 16 | 17 | 160 | 5.5 |
| F53LY | 11 | 9 | 3 | 0 | 23 | 0.8 |
| I54VLMATS | 10 | 3 | 3 | 2 | 18 | 0.6 |
| V82ATFSCML | 11 | 6 | 1 | 4 | 22 | 0.8 |
| I85V | 3 | 6 | 5 | 7 | 21 | 0.7 |
| L90M | 2 | 3 | 1 | 12 | 18 | 0.6 |
| INSTI | ||||||
| T66AIK | 4 | 5 | 0 | 0 | 9 | 0.7 |
| G140ACS | 3 | 4 | 2 | 0 | 9 | 0.7 |
| Y143CHR | 5 | 6 | 0 | 0 | 11 | 0.8 |
| Q148HKR | 6 | 4 | 0 | 0 | 10 | 0.7 |
NRTI, nucleoside reverse transcriptase inhibitor; NNRTI, non-NRTI; PI, protease inhibitor; INSTI, integrase strand transfer inhibitor.
Reverse transcriptase (RT) T215FY variants were not observed in any sample. Separately categorized amino acids also shown at codon 184 in RT as position of special interest. Full listing of mutations given in Table S3.
The majority of DRMs detected at each threshold occurred as solitary mutations in a single drug class for individual participant samples. There were a relatively small number of samples that had more than one DRM within a drug class or mutations present in multiple drug classes. For individual samples where TDR DRMs were detected at the 2% threshold, multiple within-class DRMs occurred in 18.5% of those with NRTI DRMs, 13.4% with NNRTI DRMs, 13.5% with PI DRMs, and 4.3% with INSTI DRMs. Of those with TDR DRMs detected at the 2% threshold in both RT and PR, multi-class resistance with at least one NRTI, NNRTI and PI DRM occurred in only three participant samples.
We further examined (but did not formally analyse) specific DRMs by geographical region, which indicated marked variability (Table S4). For example, K103NS was the most common NNRTI mutation in the USA and Latin America, whereas G190ASE was the most common NNRTI mutation in Europe, Africa and Asia. This would appear to be the main explanation for the geographical variability in the level of DRM variants that was observed in Fig. 1.
Predicted phenotypic drug susceptibility
Analysis of predicted phenotypic resistance (low level, intermediate, and high level) for selected antiretroviral agents according to threshold of detection (Fig. 2) resulted in several important findings. First, for certain drugs, particularly nelfinavir and raltegravir, using a 2% rather than a 20% variant threshold dramatically increases estimates of predicted phenotypic resistance (much more than drug class-specific TDR estimates). This is due to the wider range of mutations incorporated in the Stanford HIVdb algorithm than in the WHO or Stanford drug mutation surveillance lists. For example, the IN mutations 92G, 138K, and 163R, which were generally observed at the 2–5% variant level by NGS, individually predict low-level resistance to raltegravir, but are not counted on the Stanford drug mutation surveillance list. Conversely, resistance to efavirenz is mainly predicted by the K103NS mutations. As these mainly occur at high variant levels (Table 3), the frequency of predicted resistance is largely unaffected by the variant threshold that is used. Second, there was minimal predicted resistance to darunavir and dolutegravir regardless of the detection threshold.
Fig. 2.
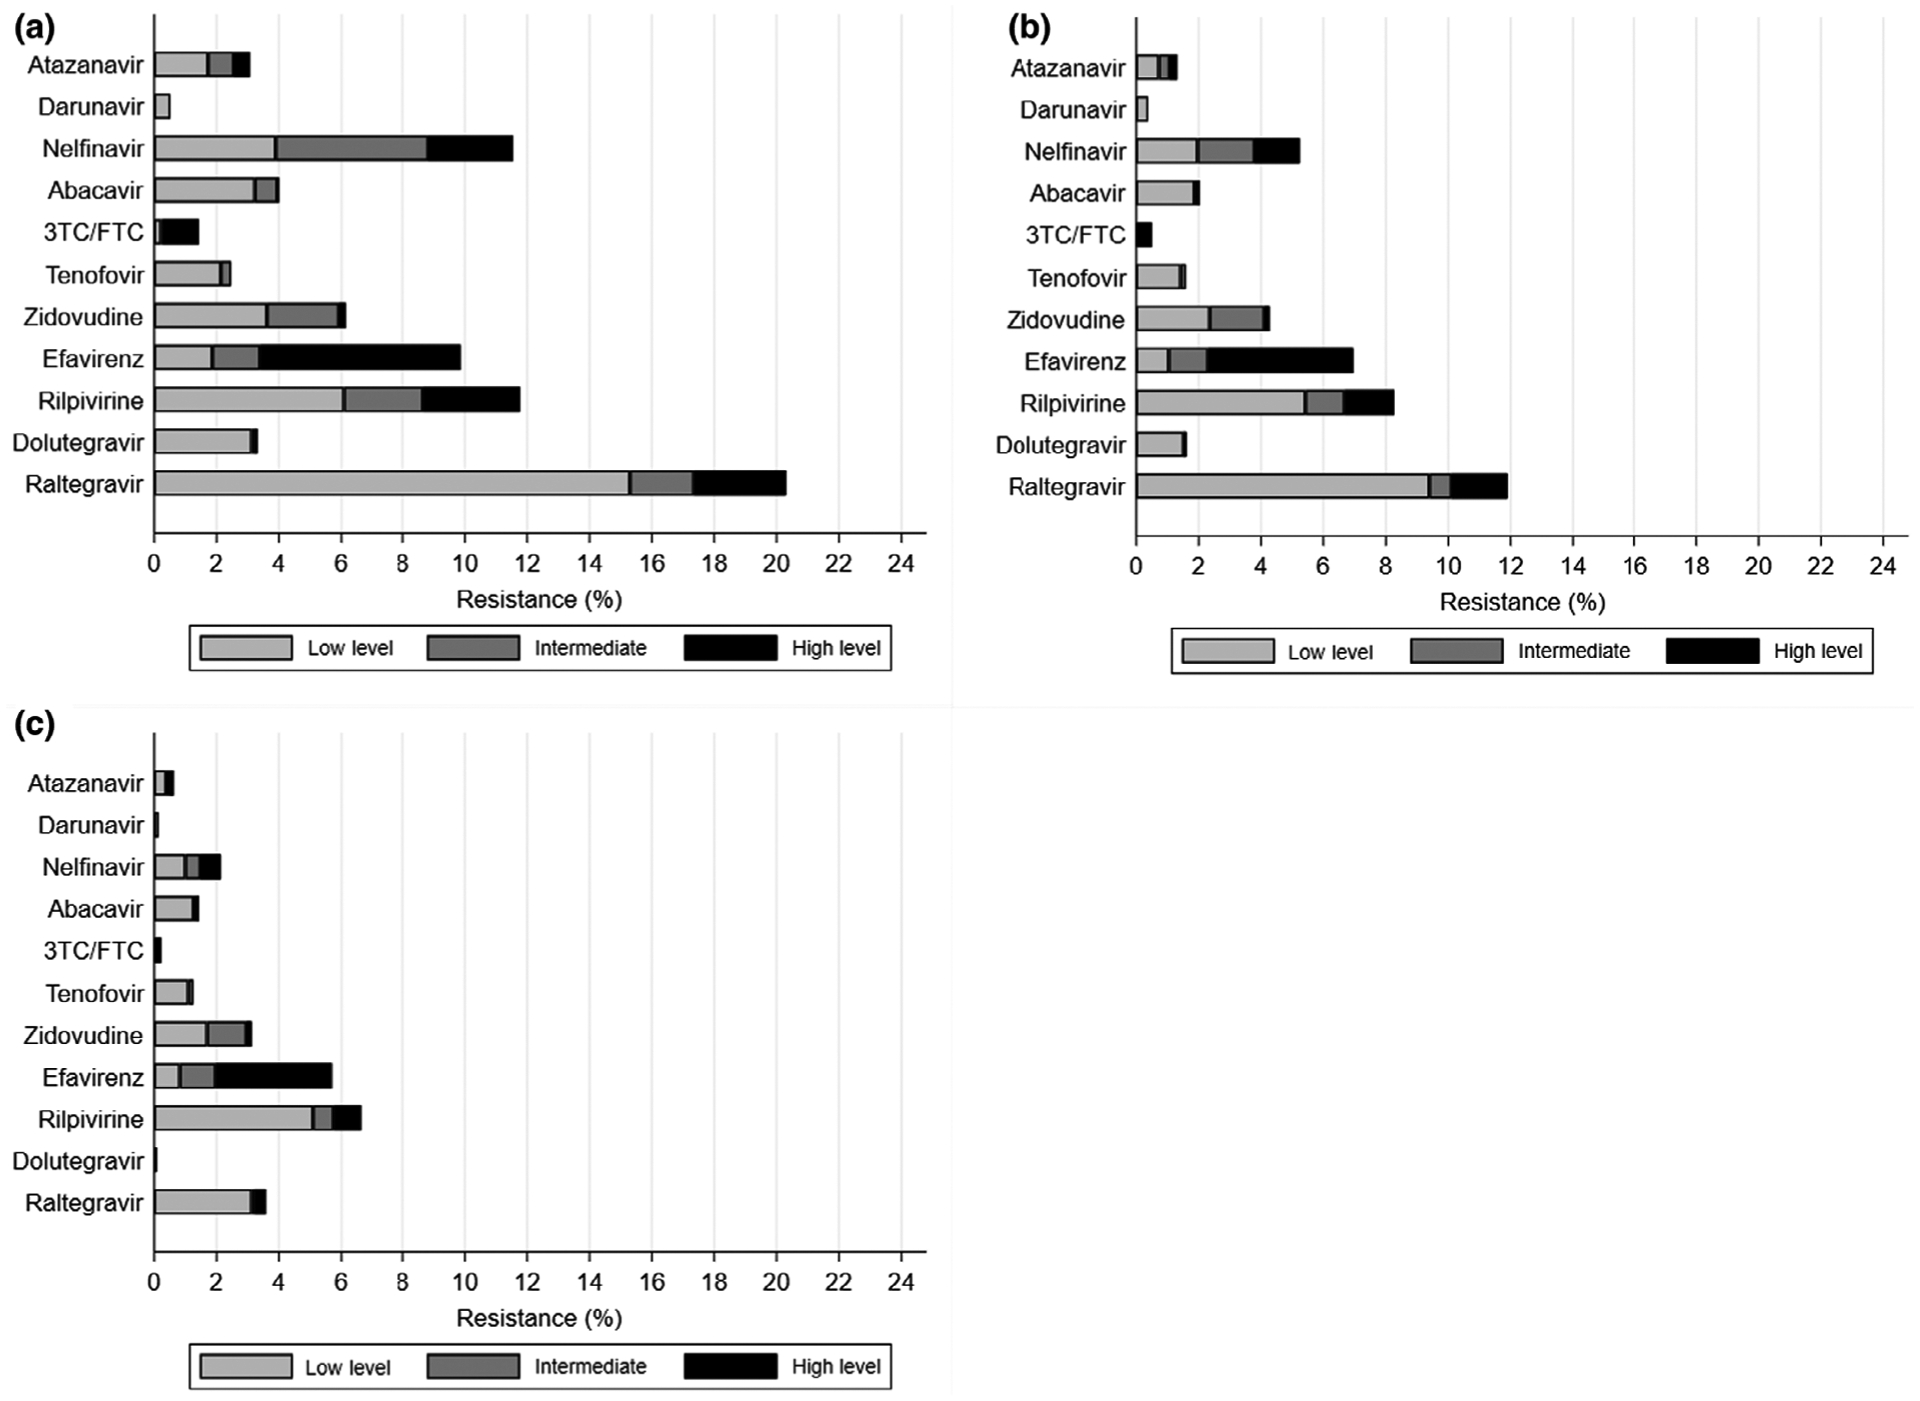
Predicted phenotypic drug susceptibility by detection threshold. (a) Above 2% detection threshold; (b) above 5% threshold; (c) above 20% threshold. Predicted susceptibility is based on Stanford HIVdb algorithm v.8.6. Data are also shown in tabular form in Table S2. 3TC, lamivudine; FTC, emtricitabine.
Finally, the frequency of tenofovir resistance was estimated to be 1.3% at the 20% threshold, 1.6% at the 5% threshold, and 2.4% at the 2% threshold, despite the complete absence of the K65R mutation. This is explained by the contribution of thymidine analogue mutations to predicted tenofovir resistance.
Discussion
The START trial represents one of the largest global cohorts with NGS characterization of TDR. The prevalence of TDR overall and by drug class was highest using the 2% detection threshold as a significant number of mutations identified were minor variants. At the 2% threshold, the highest TDR prevalence was observed for PI DRMs (11.4%) while at the 20% threshold the highest TDR prevalence occurred with NNRTI DRMs (4.9%). Within drug classes, a greater proportion of participants harboured PI and INSTI minor variants compared with the NRTI- and NNRTI-associated DRMs. As such, Sanger sequencing, which is comparable to NGS at the 20% threshold of detection, would be expected to underestimate TDR prevalence markedly, particularly for the PI and INSTI drug classes.
As described in this study, a higher proportion of PI minor variants identified when using NGS for detection of TDR was also reported in a UK surveillance study in recently infected MSMs.[11] Cunningham et al. [11] found that the majority of low-frequency variants (62%) detected were PI DRMs, despite these mutations rarely being observed by traditional Sanger sequencing in treatment-experienced patients failing therapy in the UK.
Unlike most other studies of global TDR, our data also included NGS for surveillance INSTI DRMs. The INSTI DRMs identified were almost exclusively minor variants which occurred mostly between the 2% and 5% thresholds. The most commonly detected surveillance INSTI DRMs were G143CHR, associated with high-level resistance to raltegravir, but these were only detected as minor variants. The only INSTI DRMs detected above the 20% threshold were G140S and G140A, which are associated with intermediate resistance to raltegravir and elvitegravir [21,22]. Given the time period in which these samples were collected, there would have been limited prior population exposure to integrase inhibitors, particularly in regions such as Africa and Asia, therefore the majority of these mutations probably represent naturally occurring low-level variants rather than actual DRMs selected under drug pressure and then transmitted. However, their significance remains uncertain and it is unknown if these low-level INSTI variants could potentially compromise efficacy of integrase-based regimens. INSTI DRMs have been reported to occur as natural polymorphisms and can be detected in samples from individuals obtained prior to the advent of the integrase inhibitors [23]. Further research in understanding their potential clinical significance is warranted given the widespread use of integrase-based regimens for initial therapy. In a recent analysis of data from INTEGRATE, a retrospective study from nine European HIV cohorts, baseline INSTI DRMs were found in one of 512 (0.2%) antiretroviral-naïve individuals by Sanger sequencing, suggesting that INSTI TDR is uncommon and unlikely to be detected with this methodology [24].
Variability of TDR by geographic region was observed in the START study population. By drug class, the highest prevalence of NNRTI DRMs was seen in the USA while the highest prevalence of NRTI DRMs occurred in Australia. Previous studies have shown that the prevalence of transmitted NNRTI resistance has historically been higher in North America than in Europe [3,4,6]. The number of samples from participants included in this analysis was more limited from Australia, but the relatively high prevalence of NRTI TDR has previously been observed with Sanger sequencing [4,13]. This is probably due to extensive prior exposure of viruses to NRTIs in the pool of individuals transmitting HIV-1 in this region.
Geographic variability was also seen in the level of DRM variants detected at different thresholds, particularly for NNRTI TDR. Overall NNRTI TDR was lowest in Africa, occurring in 6.6% of study participants; however, unlike the USA and South America, the majority of NNRTI DRMs occurred as minor variants (mostly in 5–20% of the quasispecies). Similarly, the prevalence of NNRTI TDR in Asia was 7.5%, mostly in 2–5% of the quasispecies. This would suggest that most NNRTI DRMs associated with TDR in these regions may be occurring as minor variants and would not be detected by traditional Sanger sequencing.
The clinical relevance of minor HIV-1 drug-resistant variants remains controversial. Transmission of minor variants associated with resistance to different drug classes has been documented in acutely infected individuals, although these are probably rare events [25]. A recent review of 103 studies of low-abundance drug-resistant variants found that it is difficult to evaluate the clinical impact of minor variants on first-line ART regimens given the heterogeneity of study designs and different laboratory methods used [26]. However, multiple studies assessing the impact of NNRTI minor variants have shown that the presence of these low-level DRMs prior to initiation of treatment may reduce the virological response and increase the likelihood of failure with first-line NNRTI-based regimens [3,27–30].
More recent global TDR surveillance data using Sanger sequencing in treatment-naïve individuals have demonstrated significantly increasing prevalence rates of NNRTI TDR in Africa and Asia, reaching levels of > 10% in some countries [9]. WHO guidelines have suggested that if the prevalence of pre-treatment drug resistance (which includes treatment-naïve people and those with previous ART exposure starting first-line therapy) exceeds 10% in a country, then use of non-NNRTI-based first-line regimens should be considered [31]. Because of this, a number of countries in Africa and Asia have revised national treatment guidelines to INSTI-based regimens as preferred initial therapy [9]. Furthermore, if non-NNRTI alternatives are unaffordable then pre-treatment drug resistance testing is recommended [32]. Assuming low-level NNRTI variants are clinically important, our data would suggest that the prevalence of NNRTI TDR is being underestimated in many regions of the world where previous surveillance efforts have been based on traditional sequencing methods.
In this diverse population of study participants, we found no clear baseline participant demographic predictors for the presence of drug class-specific TDR other than an association between PI DRMs and age. This association appears to have been largely due to the presence of low-level PI variants and was not observed above the 5% detection threshold. There was also a weak trend of increasing NNRTI TDR over the time of study enrolment from 2009 to 2013.
When examining individual mutations by variant threshold, different patterns of DRM detection by drug class were observed. Some DRMs tended to occur almost exclusively or predominantly as low-level variants and this was observed in each drug class. The most commonly detected NRTI DRMs, K219QENR and M184VI, occurred predominately as minor variants while the majority of patients with T215 revertants had the mutation in > 80% of the quasispecies. Of the most frequent NNRTI DRMs, G190ASE occurred predominately as minor variants while K103NS was dominant in the quasispecies. Within the PI-related DRMs, the same picture emerged, with M46IL and D30N predominately seen as minor variants, whereas L90M (associated with saquinavir resistance), if present, dominated the quasispecies. Although smaller numbers of individuals were included in the Cunningham et al. study [11], a similar pattern was observed, with the M46IL and D30N detected predominately as minor variants while the majority of L90M mutations occurred above the 20% threshold.
The detection of some DRMs predominately at low levels is likely due to impaired viral fitness, which has been described for mutations such as M184VI and D30N [3,5,33–36]. The M184VI may also be linked with other DRMs and tends to wane over time due to overgrowth of more replication competent wild-type virus [37]. However, mutations like the RT K103NS, the T215 revertants and the PI L90M appear to have little effect on viral fitness and may persist for prolonged periods in individuals with TDR [3,8,28,36,38,39].
Predicted phenotypic susceptibility was based on an expanded list of mutations which had been detected by NGS and results varied by threshold of detection. Given that certain mutations occurred more frequently as minor variants, some agents had a greater degree of predicted phenotypic resistance, such as nelfinavir and raltegravir, when using the 2% threshold of detection. At the 20% threshold, predicted resistance to these agents was significantly diminished and remained mostly low or intermediate. By contrast, efavirenz and lamivudine/emtricitabine had mostly high-level predicted resistance at all thresholds. This is due to single mutations causing high-level resistance to these agents, which were detected at all thresholds, although the 184VI was less frequently detected above the 20% threshold. Overall, the first-generation NNRTIs efavirenz and nevirapine (which has a similar resistance profile) would be predicted as the least active agents in those initiating therapy in this population. Although there was a moderate amount of reduced susceptibility to rilpivirine observed at all thresholds, this was mostly intermediate- and low-level resistance. Rilpivirine is a second-generation NNRTI which usually requires multiple mutations to cause high-level resistance. Of note, there was very little predicted phenotypic resistance to darunavir and dolutegravir. These agents would probably be highly active in this population, as well as the newer second-generation integrase inhibitor bictegravir.
Potential limitations of this study include the threshold of detection for minor variants, as well as the ability to reliably sequence participant samples. NGS is a highly sensitive assay and there is the possibility of low-level variants occurring as laboratory artefacts or sequencing errors, but prior studies have demonstrated that most discrepancies in variant calls occur below the 2% threshold [11,18,40,41]. We were limited by our ability to produce an evaluable result by NGS from all available samples, particularly for RT and IN DRMs. Another limitation of our study was that we did not assess TDR in those individuals with low-level viraemia, as NGS was only attempted in those participants with baseline HIV RNA levels > 1000 copies/mL. Furthermore, although the average time from diagnosis of the participants was 1 year prior to study enrolment and all had early-stage HIV disease with CD4 counts > 500 cells/μL, this cohort probably represents a mix of those with more recent infection and others with a significantly longer duration of infection.
In summary, using NGS in the START population revealed significant geographic diversity in prevalence of TDR. Our study resulted in detection of a large proportion of low-level variants which would not have been detected by traditional Sanger sequencing, the method commonly used to assess individual pre-treatment drug resistance and for population TDR surveillance. Further studies will be needed to assess the potential clinical impact of transmitted minority variants on treatment response. Given that TDR continues to occur in most regions of the world and prevalence has been increasing to certain agents at an alarming rate in some countries, it will be important to continue surveillance efforts and consider the use of more sensitive drug resistance assays.
Supplementary Material
Table S1 Frequency of TDR by detection threshold and geographical region.
Table S2 Predicted phenotypic drug susceptibility by detection threshold.
Table S3 Individual DRMs (any frequency).
Table S4 Individual DRMs by geographical region.
Table S5 Primer sequences.
Acknowledgements
We wish to thank the study participants and clinical staff of the START trial (see Initiation of antiretroviral therapy in early asymptomatic individuals, New England Journal of Medicine 2015:373:794-807 for a complete list of START investigators [14]).
Financial disclosure: The study was supported in part by the National Institute of Allergy and Infectious Diseases (NIAID), National Institute of Health (NIH, grants UM1-AI068641, UM1-AI120197 and 1U01-AI36780), National Institutes of Health Clinical Center, National Cancer Institute, National Heart, Lung, and Blood Institute, Eunice Kennedy Shriver National Institute of Child Health and Human Development, National Institute of Mental Health, National Institute of Neurological Disorders and Stroke, National Institute of Arthritis and Musculoskeletal and Skin Diseases, Agence Nationale de Recherches sur le SIDA et les Hépatites Virales (France), National Health and Medical Research Council (Australia), National Research Foundation (Denmark), Bundes ministerium für Bildung und Forschung (Germany), European AIDS Treatment Network, Medical Research Council (UK), National Institute for Health Research, National Health Service (UK), and University of Minnesota. Antiretroviral drugs were donated to the central drug repository by AbbVie, Bristol-Myers Squibb, Gilead Sciences, GlaxoSmithKline/ViiV Healthcare, Janssen Scientific Affairs, and Merck.
Footnotes
Conflict of interest: JDB serves as a consultant for Quest Diagnostics. Yale University receives grants from Gilead and ViiV for which MJK serves as the Principal Investigator.
Supporting Information
Additional supporting information may be found online in the Supporting Information section at the end of the article.
References
- 1.Pillay D, Bhaskaran K, Jurriaans S et al. The impact of transmitted drug resistance on the natural history of HIV infection and response to first-line therapy. Aids 2006; 20: 21–8. [DOI] [PubMed] [Google Scholar]
- 2.Little SJ, Holte S, Routy JP et al. Antiretroviral-drug resistance among patients recently infected with HIV. N Engl J Med 2002; 347: 385–94. [DOI] [PubMed] [Google Scholar]
- 3.Günthard HF, Calvez V, Paredes R et al. Human immunodeficiency virus drug resistance: 2018 recommendations of the international antiviral society–USA panel. Clin Infect Dis 2018; 68: 177–87. [DOI] [PMC free article] [PubMed] [Google Scholar]
- 4.Frentz D, Boucher C, Van De Vijver D. Temporal changes in the epidemiology of transmission of drug-resistant HIV-1 across the world. AIDS Rev 2012; 14: 17–27. [PubMed] [Google Scholar]
- 5.Geretti AM. Epidemiology of antiretroviral drug resistance in drug-naive persons. Curr Opin Infect Dis 2007; 20: 22–32. [DOI] [PubMed] [Google Scholar]
- 6.Wheeler WH, Ziebell RA, Zabina H et al. Prevalence of transmitted drug resistance associated mutations and HIV-1 subtypes in new HIV-1 diagnoses, U.S.−2006. Aids 2010; 24: 1203–12. [DOI] [PubMed] [Google Scholar]
- 7.Ross L, Lim ML, Liao Q et al. Prevalence of antiretroviral drug resistance and resistance-associated mutations in antiretroviral therapy-naive HIV-infected individuals from 40 United States cities. HIV Clin Trials 2007; 8: 1–8. [DOI] [PubMed] [Google Scholar]
- 8.Novak RM, Chen L, MacArthur RD et al. Prevalence of antiretroviral drug resistance mutations in chronically HIV– infected, treatment-naive patients: implications for routine resistance screening before initiation of antiretroviral therapy. Clin Infect Dis 2005; 40: 468–74. [DOI] [PubMed] [Google Scholar]
- 9.Organization WH. HIV Drug Resistance Report 2019. Geneva, Switzerland, 2019. [Google Scholar]
- 10.Derache A, Iwuji CC, Baisley K et al. Impact of Next-generation Sequencing Defined Human Immunodeficiency Virus Pretreatment Drug Resistance on Virological Outcomes in the ANRS 12249 Treatment-as-Prevention Trial. Clin Infect Dis 2018;69: 207–214. [DOI] [PMC free article] [PubMed] [Google Scholar]
- 11.Cunningham E, Chan Y-T, Aghaizu A et al. Enhanced surveillance of HIV-1 drug resistance in recently infected MSM in the UK. J Antimicrob Chemother 2016;72: 227–234. [DOI] [PubMed] [Google Scholar]
- 12.Moscona R, Ram D, Wax M et al. Comparison between next-generation and Sanger-based sequencing for the detection of transmitted drug-resistance mutations among recently infected HIV-1 patients in Israel, 2000–2014. J Int AIDS Soc 2017; 20: 21846. [DOI] [PMC free article] [PubMed] [Google Scholar]
- 13.Baxter J, Dunn D, White E et al. Global HIV-1 transmitted drug resistance in the INSIGHT S trategic T iming of A nti R etroviral T reatment (START) trial. HIV Med 2015; 16: 77–87. [DOI] [PMC free article] [PubMed] [Google Scholar]
- 14.Group ISS, Lundgren JD, Babiker AG et al. Initiation of antiretroviral therapy in early asymptomatic HIV infection. N Engl J Med 2015; 373: 795–807. [DOI] [PMC free article] [PubMed] [Google Scholar]
- 15.Gall A, Ferns B, Morris C et al. Universal amplification, next-generation sequencing, and assembly of HIV-1 genomes. J Clin Microbiol 2012; 50: 3838–44. [DOI] [PMC free article] [PubMed] [Google Scholar]
- 16.Pineda-Peña A-C, Faria NR, Imbrechts S et al. Automated subtyping of HIV-1 genetic sequences for clinical and surveillance purposes: performance evaluation of the new REGA version 3 and seven other tools. Infect Genet Evol 2013; 19: 337–48. [DOI] [PubMed] [Google Scholar]
- 17.Verbist B, Thys K, Reumers J et al. VirVarSeq: a low-frequency virus variant detection pipeline for Illumina sequencing using adaptive base-calling accuracy filtering. Bioinformatics (Oxford, England) 2015; 31: 94. [DOI] [PubMed] [Google Scholar]
- 18.Huber M, Metzner KJ, Geissberger FD et al. MinVar: A rapid and versatile tool for HIV-1 drug resistance genotyping by deep sequencing. J Virol Methods 2017; 240: 7–13. [DOI] [PubMed] [Google Scholar]
- 19.Bennett DE, Camacho RJ, Otelea D et al. Drug resistance mutations for surveillance of transmitted HIV-1 drug-resistance: 2009 update. PLoS One 2009; 4: e4724. [DOI] [PMC free article] [PubMed] [Google Scholar]
- 20.Database SUHDR. 2016. Surveillance drug resistance mutation (SDRM) worksheet: INIs.
- 21.Liu TF, Shafer RW. Web resources for HIV type 1 genotypic-resistance test interpretation. Clin Infect Dis 2006; 42: 1608–18. [DOI] [PMC free article] [PubMed] [Google Scholar]
- 22.Wensing AM, Calvez V, Ceccherini-Silberstein F et al. 2019 update of the drug resistance mutations in HIV-1. Top Antivir Med 2019; 27: 111–21. [PMC free article] [PubMed] [Google Scholar]
- 23.Lataillade M, Chiarella J, Kozal M. Natural polymorphism of the HIV-1 integrase gene and mutations associated with integrase inhibitor resistance. Antivir Ther. INT MEDICAL PRESS LTD 2–4 IDOL LANE, LONDON EC3R 5DD, ENGLAND, 2006: 11: S28–S. [PubMed] [Google Scholar]
- 24.Rossetti B, Fabbiani M, Di Carlo D et al. Prevalence of InSTI resistance and effectiveness of InSTI-based regimens in HIV- infected patients: results from a European cohort study. HIV Med. WILEY 111 RIVER ST, HOBOKEN 07030–5774, NJ USA, 2019: 20: 16–7. [Google Scholar]
- 25.Metzner KJ, Scherrer AU, Preiswerk B et al. Origin of minority drug-resistant HIV-1 variants in primary HIV-1 infection. J Infect Dis 2013; 208: 1102–12. [DOI] [PubMed] [Google Scholar]
- 26.Mbunkah HA, Bertagnolio S, Hamers RL et al. Low-abundance drug-resistant HIV-1 variants in antiretroviral drug-naive individuals: a systematic review of detection methods, prevalence, and clinical impact. J Infect Dis 2020; 221: 1584–97. [DOI] [PMC free article] [PubMed] [Google Scholar]
- 27.Li JZ, Paredes R, Ribaudo HJ et al. Low-frequency HIV-1 drug resistance mutations and risk of NNRTI-based antiretroviral treatment failure: a systematic review and pooled analysis. JAMA 2011; 305: 1327–35. [DOI] [PMC free article] [PubMed] [Google Scholar]
- 28.Simen BB, Simons JF, Hullsiek KH et al. Low-abundance drug-resistant viral variants in chronically HIV-infected, antiretroviral treatment-naive patients significantly impact treatment outcomes. J Infect Dis 2009; 199: 693–701. [DOI] [PubMed] [Google Scholar]
- 29.Johnson JA, Li JF, Wei X et al. Minority HIV-1 drug resistance mutations are present in antiretroviral treatment-naive populations and associate with reduced treatment efficacy. PLoS Med 2008; 5: e158. [DOI] [PMC free article] [PubMed] [Google Scholar]
- 30.Cozzi-Lepri A, Noguera-Julian M, Di Giallonardo F et al. Low-frequency drug-resistant HIV-1 and risk of virological failure to first-line NNRTI-based ART: a multicohort European case–control study using centralized ultrasensitive 454 pyrosequencing. J Antimicrob Chemother 2014; 70: 930–40. [DOI] [PMC free article] [PubMed] [Google Scholar]
- 31.Organization WH. Consolidated guidelines on the use of antiretroviral drugs for treating and preventing HIV infection: recommendations for a public health approach. Geneva, Switzerland: World Health Organization; 2016. [PubMed] [Google Scholar]
- 32.Organization WH. Guidelines on the public health response to pretreatment HIV drug resistance: July 2017. 2017.
- 33.Gupta S, Lataillade M, Kyriakides T et al. Low-frequency NNRTI-resistant HIV-1 variants and relationship to mutational load in antiretroviral-naive subjects. Viruses 2014; 6: 3428–37. [DOI] [PMC free article] [PubMed] [Google Scholar]
- 34.Yanik EL, Napravnik S, Christopher B et al. Prevalence of transmitted antiretroviral drug resistance differs between acutely and chronically HIV-infected patients. J Acquir Immune Defic Syndr (1999) 2012; 61: 258. [DOI] [PMC free article] [PubMed] [Google Scholar]
- 35.Cong M-e, Heneine W, García-Lerma JG. The fitness cost of mutations associated with human immunodeficiency virus type 1 drug resistance is modulated by mutational interactions. J Virol 2007; 81: 3037–41. [DOI] [PMC free article] [PubMed] [Google Scholar]
- 36.Wensing AM, van Maarseveen NM, Nijhuis M. Fifteen years of HIV Protease Inhibitors: raising the barrier to resistance. Antivir Res 2010; 85: 59–74. [DOI] [PubMed] [Google Scholar]
- 37.Wainberg MA, Moisi D, Oliveira M, Toni TDA, Brenner BG. Transmission dynamics of the M184V drug resistance mutation in primary HIV infection. J Antimicrob Chemother 2011; 66: 2346–9. [DOI] [PubMed] [Google Scholar]
- 38.Castro H, Pillay D, Cane P et al. Persistence of HIV-1 transmitted drug resistance mutations. J Infect Dis 2013; 208: 1459–63. [DOI] [PMC free article] [PubMed] [Google Scholar]
- 39.Little SJ, Frost SD, Wong JK et al. Persistence of transmitted drug resistance among subjects with primary human immunodeficiency virus infection. J Virol 2008; 82: 5510–8. [DOI] [PMC free article] [PubMed] [Google Scholar]
- 40.Archer J, Baillie G, Watson SJ, Kellam P, Rambaut A, Robertson DL. Analysis of high-depth sequence data for studying viral diversity: a comparison of next generation sequencing platforms using Segminator II. BMC Bioinform 2012; 13: 47. [DOI] [PMC free article] [PubMed] [Google Scholar]
- 41.Orton RJ, Wright CF, Morelli MJ et al. Distinguishing low frequency mutations from RT-PCR and sequence errors in viral deep sequencing data. BMC Genom 2015; 16: 229. [DOI] [PMC free article] [PubMed] [Google Scholar]
Associated Data
This section collects any data citations, data availability statements, or supplementary materials included in this article.
Supplementary Materials
Table S1 Frequency of TDR by detection threshold and geographical region.
Table S2 Predicted phenotypic drug susceptibility by detection threshold.
Table S3 Individual DRMs (any frequency).
Table S4 Individual DRMs by geographical region.
Table S5 Primer sequences.