Abstract
The clinical demand for low image noise often limits the slice thickness used in many CT applications. However, a thick-slice image is more susceptible to longitudinal partial volume effects, which can blur key anatomic structures and pathologies of interest. In this work, we develop a prior-knowledge-aware iterative denoising (PKAID) framework that utilizes spatial data redundancy in the slice increment direction to generate low-noise, thin-slice images, and demonstrate its application in non-contrast head CT exams. The proposed technique takes advantage of the low-noise of thicker images and exploits the structural similarity between the thick- and thin-slice images to reduce noise in the thin-slice image. Phantom data and patient cases (n=3) of head CT were used to assess performance of this method. Images were reconstructed at clinically-utilized slice thickness (5 mm) and thinner slice thickness (2 mm). PKAID was used to reduce image noise in 2 mm images using the 5 mm images as low-noise prior. Noise amplitude, noise power spectra (NPS), modulation transfer function (MTF), and slice sensitivity profiles (SSP) of images before/after denoising were analyzed. The NPS and MTF analysis showed that PKAID preserved noise texture and resolution of the original thin-slice image, while reducing noise to the level of thick-slice image. The SSP analysis showed that the slice thickness of the original thin-slice image was retained. Patient examples demonstrated that PKAID-processed, thin-slice images better delineated brain structures and key pathologies such as subdural hematoma compared to the clinical 5 mm images, while additionally reducing image noise. To test an alternative PKAID utilization for dose reduction, a head exam with 40% dose reduction was simulated using projection-domain noise insertion. The image of 5 mm slice thickness was then denoised using PKAID. The results showed that the PKAID-processed reduced-dose images maintained similar noise and image quality compared to the full-dose images.
Keywords: computed tomography, noise reduction, slice thickness, denoising, head CT
1. Introduction
X-ray CT is widely used in various clinical applications with over 80 million exams performed in the United States in 2018 (OECD, 2019). Due to its fast scanning speed, high spatial resolution, high reliability, and broad availability, CT remains the imaging modality of choice in many areas such as brain imaging in emergency department for the evaluation of trauma and other acute neurological disorders (Larson et al., 2011; Jagoda et al., 2008; Kocher et al., 2011).
There exists an intrinsic trade-off between image noise and slice thickness in clinical CT imaging. A thicker slice is reconstructed using more x-ray photons and therefore has lower image noise compared to a thin-slice image. To meet the clinical demand for low image noise in many CT applications such as non-contrast head CT, images are often reconstructed at a larger slice thickness (e.g., 5 mm) (Maetani et al., 2016). However, thicker slices are more susceptible to longitudinal partial volume effect, which occurs when a small object partially occupies a slice (Kalisz et al., 2016). Note that the partial volume effect in this work is referring to linear partial volume effect, instead of non-linear partial volume effect which produces shading in a thick-slice CT images.
The detection of low contrast objects is crucial in various CT applications including head CT as the image contrast between adjacent soft structures, e.g., gray and white brain matters, is small (von Kummer et al., 2001). Many types of pathology such as tumor, edema and small hemorrhagic contusions can be difficult to distinguish from neighboring tissues due to their low contrast level relative to background parenchyma. However, partial volume effect can cause these key anatomical structures and pathologies to blend with background tissues, reducing the conspicuity of these important image features.
In this work, we describe a prior knowledge aware iterative denoising (PKAID) technique, which exploits the spatial data redundancy in the slice increment direction to reduce image noise while preserving the intrinsic spatial resolution, noise texture, and slice sensitivity profile of the original images. It utilizes a prior image at the same location but with a larger slice thickness to reduce the noise in a thin-slice image. Utilization of data redundancy in CT images to improve image quality has been successfully demonstrated for various applications (Chen et al., 2009; Chen et al., 2008; Leng et al., 2011; Yu et al., 2016; Lauzier and Chen, 2013; Lauzier et al., 2012). In the case of contrast-enhanced acquisition, the dynamic vessel enhancement at different time points after contrast injection has been used to reconstruct the entire CT time-enhancement series from undersampled projections data (Chen et al., 2009; Chen et al., 2008). Similarly, the use of spatio-spectral data redundancy can be used in reconstruction to reduce image noise in narrow energy bin images acquired on photon-counting-detector CT (Leng et al., 2011; Yu et al., 2016). Recently, we have demonstrated the use of spatio-spectral data correlation within multi-energy CT data to perform quantitative material decomposition (MD-PKAID) and to denoise virtual monoenergetic images (Mono-PKAID) at a distinct energy level (Tao et al., 2018; Tao et al., 2019). The current method is an extension of these techniques, with the key difference that the current method does not limit itself to multi-energy CT acquisition but can be applied to both single-energy and multi-energy CT scans. Unlike the other noise reduction techniques utilizing spatial filtering or iterative image reconstruction, the proposed method does not cause loss of resolution and can preserve the noise power spectra of the original image (Diwakar and Kumar, 2018; Ehman et al., 2014). As will be demonstrated, the proposed technique can produce thin-slice images with comparable noise level as that of a thicker slice image, while taking advantage of reduced partial volume effect of a thin-slice image. It therefore simultaneously satisfies the clinical demands for low image noise and reduced partial volume effect, potentially improving the diagnostic value of clinical CT images (Riedel et al., 2012). Alternatively, the proposed approach can also be used to denoise images acquired with lower radiation exposure to achieve dose reduction for clinical exams, while reducing image noise to the level of full-dose scan and maintaining image quality.
The paper is organized as follows: we first describe the PKAID framework, and then perform a series of phantom experiments to quantitatively evaluate the performance of this technique. Next, we demonstrate the efficacy of this method in denoising non-contrast head CT images using in vivo examples from clinical exams. To evaluate the alternative utilization of PKAID for dose reduction, a clinical head exam with dose reduction was simulated using projection-domain noise insertion and processed using PKAID.
2. Materials and methods
2.1. Prior Knowledge Aware Iterative Denoising (PKAID)
The PKAID technique described here is inspired by a CT image reconstruction method named prior image constrained compressed sensing (PICCS) (Chen et al., 2008; Lauzier et al., 2012). Different from PICCS, which utilizes the temporal data redundancy existing within a dynamic CT series to reconstruct artifact-free images from undersampled projection data acquired at different time points, the proposed PKAID technique utilizes the spatial data redundancy in the slice increment direction to denoise thin-slice images. In addition, PKAID is implemented in image-domain and therefore does not require access to projection data like PICCS. The proposed technique seeks to obtain the denoised thin-slice image () by minimizing the following objective functions of image matrix, x:
where x0 and xthick represent images reconstructed at the same location in the slice increment direction, but with a thin and thick slice, respectively. Here, x0 is the input thin-slice image to be denoised, while xthick serves as a prior image in the PKAID algorithm. All images (x, x0, and xthick) are expressed in linear attenuation coefficients, although they could also be expressed in CT numbers. Typically, xthick contains lower image noise than x0, but suffers more from partial volume effect. The term c‖x‖TV + (1 − c)‖ x − xthick‖TV is a regularization term that simultaneously penalizes the total variation (‖·‖TV) of the thin-slice image of interest (‖x‖TV) and the total variation of the difference image (‖x − xthick‖TV) between the thick-slice prior image (xthick) and the target thin-slice image (x). Since the thin and thick slice images share redundant data and structural similarity between each other, their difference image will be sparse. By incorporating this term into regularization, the proposed framework explicitly makes use of the image data redundancy in the slice increment direction to perform denoising. The parameter c (0 ≤ c ≤1) determines the relative contribution between the two terms. represents the data fidelity term which penalizes the derivative of the denoised thin-slice image from the original input image, with a parameter λ that controls its contribution to the objective function. The parameters λ and c can be empirically determined based on the desired image appearance and noise level. We set λ = 5000 and c = 0.1 for all cases used in this work, which were found to yield satisfactory performance. The optimization problem in Eq. 1 was solved iteratively using gradient descent method. The step size of the gradient descent was calculated using a backtracking line search algorithm (Nocedal and Wright, 2006).
2.2. Phantom Experiments
Phantom experiments were performed on a clinical CT system (Somatom Definition Flash, Siemens Healthcare GmbH, Forchheim, Germany) to assess the performance of the proposed method. The phantom used in this experiment is a head-sized phantom containing a 10-cm diameter soft tissue equivalent phantom module (QRM GmbH, Germany) inserted into a 20-cm extension ring made from water equivalent material (Figure 1). The phantom contains a cylindrical water insert and a hydroxyapatite (HA) insert of 200 mg/mL HA concentration, both with a diameter of 20 mm (Figure 1a). The longitudinal extent (i.e., z dimension) of the two inserts is shorter than the soft tissue phantom module, therefore creating a “step function” along the longitudinal direction with a contrast of 200 and 36 HU for the HA and water inserts, respectively, which can be used for slice sensitivity profile evaluation (Figure 1c). The phantom was scanned using a clinical non-contrast head routine protocol in our institution, with 120 kV tube potential, 250 effective mAs, helical pitch of 0.6, longitudinal collimation of 128×0.6 mm, and rotation time of 1 sec. Although clinical head exams are the main focus of this work, the proposed technique can be applied to other acquisition protocols as well. Images were then reconstructed using a soft tissue reconstruction kernel (J40) using Sinogram AFfirmed Iterative REconstruction (SAFIRE) technique (Siemens Healthcare) with a matrix size of 512 by 512 (Winklehner et al., 2011). Images were reconstructed with 5 mm and 2 mm slice thicknesses at the same locations. The 5 mm slice thickness is typically used for non-contrast head CT exams in our institution. The 5 mm thick-slice images were then used by PKAID to denoise the 2 mm thin-slice images.
Figure 1:

CT images of the phantom used in this study. The ROI shown in (b) and (c) are used in the noise power spectra and slice profile analysis.
We first examine the noise power spectra (NPS) of images after PKAID denoising. To estimate the NPS, a total of 21 square-shaped image patches of 8 by 8 mm2 were placed symmetrically along a circle of 40 mm in the uniform region of the phantom (Figure 1b). The NPS was then estimated following the method described by Siewerdsen et al. (Siewerdsen et al., 2002), and averaged radially. To test the effect of prior image thickness on the NPS after PKAID denoising, the prior images were also reconstructed at slice thicknesses of 10 and 8 mm, and used by PKAID to denoise the 2 mm thin-slice images. The NPS curves of images processed with different prior image thicknesses were then compared with the original 2 mm images before denoising. In addition, the magnitude of noise was also measured from each image using a circular ROI of 80 mm diameter placed around the center of the uniform region.
Next, we compare the resolution performance of images before and after PKAID denoising using modulation transfer function (MTF) derived from edge spread function. To obtain the edge spread function, a series of line profiles were extracted along the boundary of the water cylindrical insert. These line profiles were then averaged to yield the line spread function and then differentiated to generate the point spread function. The MTF was then performed by applying Fourier transform to the point spread function.
The slice sensitivity profile of the images after PKAID denoising was estimated by plotting the line profile across the boundary between the water insert and soft tissue background along the z axis. The slice sensitivity profile across the boundary between the HA insert and soft tissue background was also plotted. The HA and water inserts have a CT number difference of 200 and 36 HU compared to the background tissue, representing a strong and weak image contrast. To generate the slice sensitivity profile, a series of circular ROIs with a diameter of 6 mm was placed at the center of each insert in images at different z locations (0.1 mm increment in z) (Figure 1c). The mean values of ROIs in each image were then measured and plotted as a function of z locations to yield the slice sensitivity profile.
2.3. In Vivo Cases
Clinical CT scans from three patients referred to non-contrast head CT exams were used in our study following IRB approval and consent from patients. The same imaging and reconstruction parameters as those in the phantom experiment were used. The 5 mm slice images were then used as prior by PKAID to denoise the 2 mm images. The 2 mm images before and after PKAID denoising, as well as the clinically-used 5-mm slice images were then compared for qualitative evaluation.
2.4. Evaluation of potential dose reduction
In addition to the application of generating low noise thin slice images (e.g. 2 mm) from routine thick slice images (e.g. 5 mm), the proposed PKAID method can also be used to reduce image noise at the routine slice images (e.g. 5 mm), yielding radiation dose reduction. To test this, a non-contrast head CT exam was performed with the same technique as the previous exams with routine radiation dose of CTDIvol = 38.25 mGy. A previously validated noise insertion tool (Yu et al., 2012) was used to simulate a CT exam with 60% of the full radiation dose (CTDIvol = 22.95 mGy). The dose reduction factor was empirically determined based on initial phantom results. The full dose and reduced dose images were reconstructed with the clinically-used 5 mm slice thickness, J40 kernel, and matrix size = 512× 512. The reduced dose images were then denoised using PKAID with 10 mm images as low-noise prior images. For comparison, the reduced dose images were also processed with a state-of-the-art image-domain nonlocal mean (NLM) denoising technique (kernel = 11×11×3, search range = 19×19×5, denoising strength = 0.9) (Li et al., 2014; Li et al., 2017). The filtering parameters were optimized to provide a similar noise level compared to the full-dose images.
3. Results
The image noise levels measured from phantom images with 5 mm slice thickness, 2 mm thickness before and after PKAID denoising using 5, 8, and 10 mm prior images are summarized in Table 1. Also shown are the relative changes (in percentage) of noise amplitude compared to the clinically used 5 mm image. As expected, thin slice image (2 mm) exhibited 37% higher image noise. The use of PKAID with 5 mm image as prior reduces the image noise of 2 mm image to a similar level as a 5 mm image. The noise level is further reduced when a thicker prior image is used. Figure 2 shows the NPS estimated from the original 2 mm image, and the image after PKAID denoising using different prior images. It can be seen that the use of 5 mm prior image for PKAID can preserve the shape of the NPS curve in relative to the original 2 mm image. A thicker prior image (e.g., 10 mm) shifts the NPS curve towards the low frequency direction, therefore can slightly modify the noise texture. We therefore used 5 mm prior image for the rest of this work.
Table 1:
Image noise measured from 2 mm and 5 mm image before PKAID denoising, and from images after PKAID denoising using a prior image with slice thicknesses of 5, 8 and 10 mm, and relative change of noise (“+” indicates increase of noise) compared to the clinically used 5 mm image.
| 5 mm | Original 2 mm | 2 mm + PKAID (5 mm prior) | 2 mm + PKAID (8 mm prior) | 2 mm + PKAID (10 mm prior) | |
|---|---|---|---|---|---|
| Noise(HU) | 4.40 | 5.85 | 4.50 | 3.95 | 3.74 |
| Relative Change | - | +36.6% | +2.5% | −11.4% | −16.7% |
Figure 2:

Noise power spectra (NPS) of the original 2 mm image before denoising, the 5 mm prior image, and images after PKAID denoising using a prior image with thicknesses of 5, 8 and 10 mm. A prior image with thicker slice thickness (e.g., 10 mm) can further reduce image noise, but also shift the NPS toward the lower frequency. A prior image of 5 mm slice thickness preserves the NPS in relative to the original image while reducing image noise.
Figure 3 shows the MTF curves for the original 2 mm image and the 2 mm image after PKAID processing. The shape of the MTF was not changed with PKAID, which suggests that the proposed method can preserve the in-plane spatial resolution of the original images. Figure 4 shows the slice sensitivity profiles estimated from 2 mm images before and after PKAID using two phantom inserts with different image contrast levels. The slice sensitive profiles of the 5 mm image are also shown for reference. The slice sensitive profile of PKAID processed images follows closely that of the original 2 mm images for both contrast levels, suggesting that the slice thickness of the original images were retained.
Figure 3:

Modulation transfer function (MTF) of images before and after PKAID denoising. The MTF curves are similar between the original and PKAID-processed images, demonstrating preservation of in-plane spatial resolution.
Figure 4:
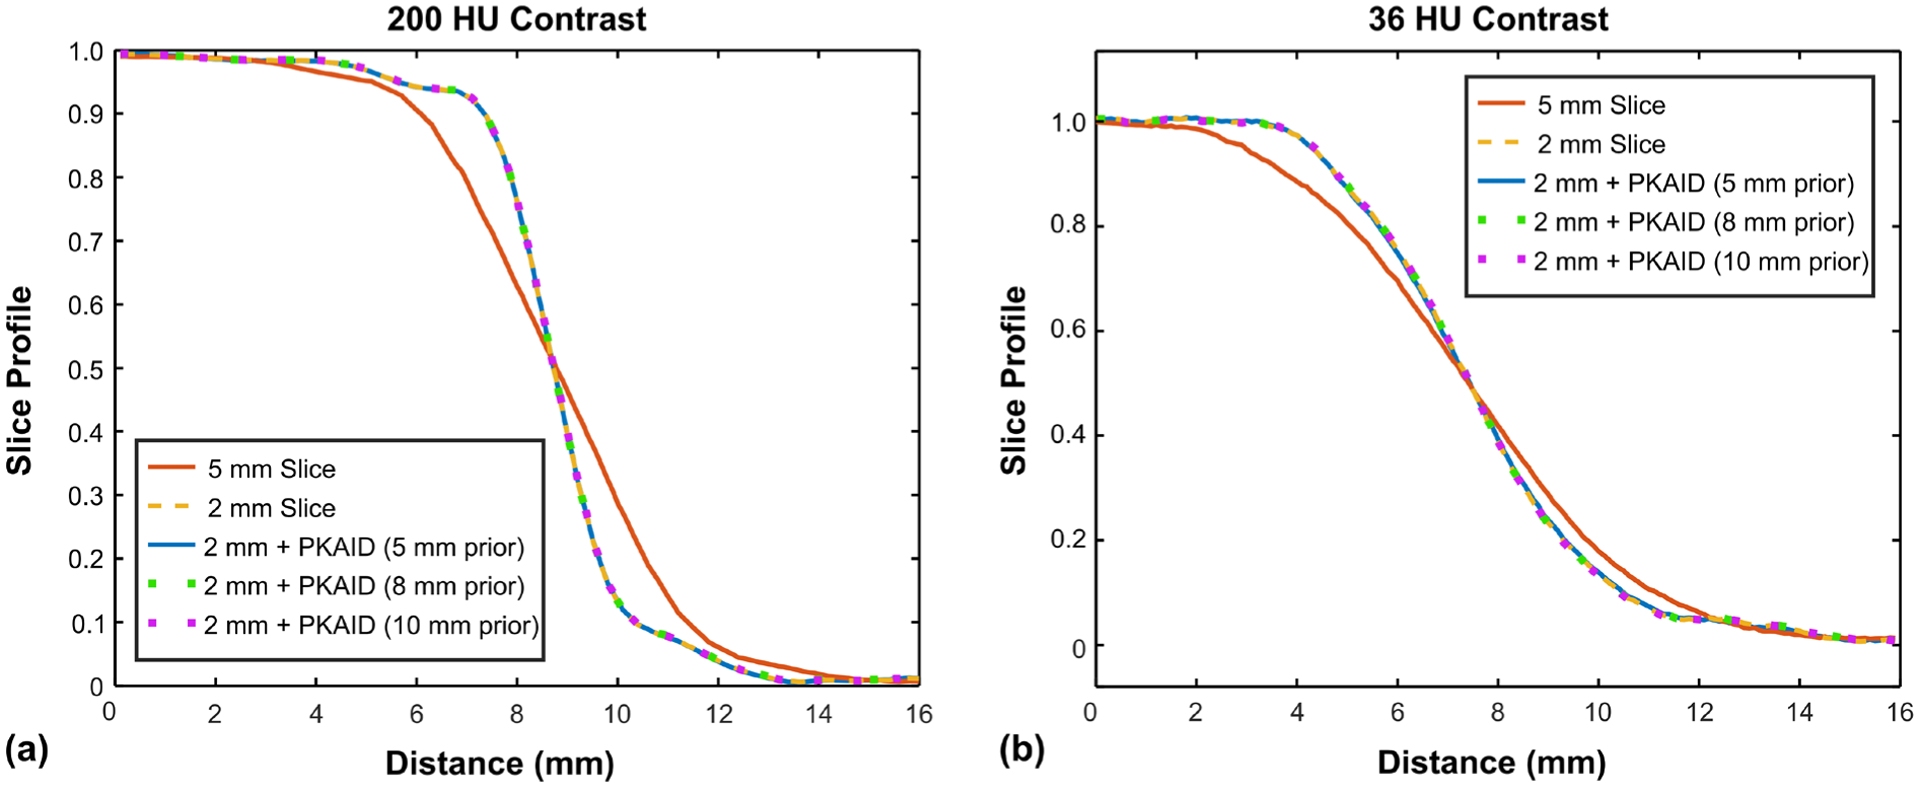
Slice sensitivity profiles (normalized) of images before and after PKAID denoising. (a): slice sensitive profile across the boundary between a hydroxyapatite (HA) insert and soft tissue background which gives about 200 HU image contrast level; (b): slice sensitive profile across solid water insert with 36 HU image contrast level compared to the background tissue.
Figure 5 shows examples of images acquired on the first patient reconstructed with the standard 5 mm slice thickness (a,e) and the thin 2 mm slice thickness (b,f). The conspicuity of cerebellar fissure (arrowhead, a-c) and a cerebral sulcus (arrowhead, e-g) is reduced in the 5 mm due to partial volume averaging with the adjacent tentorium cerebelli and brain. The 2 mm slice images can reduce this effect but also has elevated image noise (b,f). The image noise levels were measured from a circular ROI marked in Figure 5e, and were 3.0 and 4.4 HU for the 5 and 2 mm images, respectively, showing a 47% increase of noise with a thin image slice. The use of PKAID can reduce image noise to 3.1 HU, similar to that of the 5 mm images, while preserving the key anatomical features in the original 2 mm images. Figures 5d and h are the difference images before and after PKAID which show few anatomical structure especially in the brain parenchyma regions where important anatomy and pathology are located. Figure 6 shows the line profiles in each case (locations marked in Figure 5a–c) across the boundary of cerebellar tissue. It is demonstrated that the PKAID processed 2 mm image preserves cerebellar boundary compared to the original 2 mm images.
Figure 5:
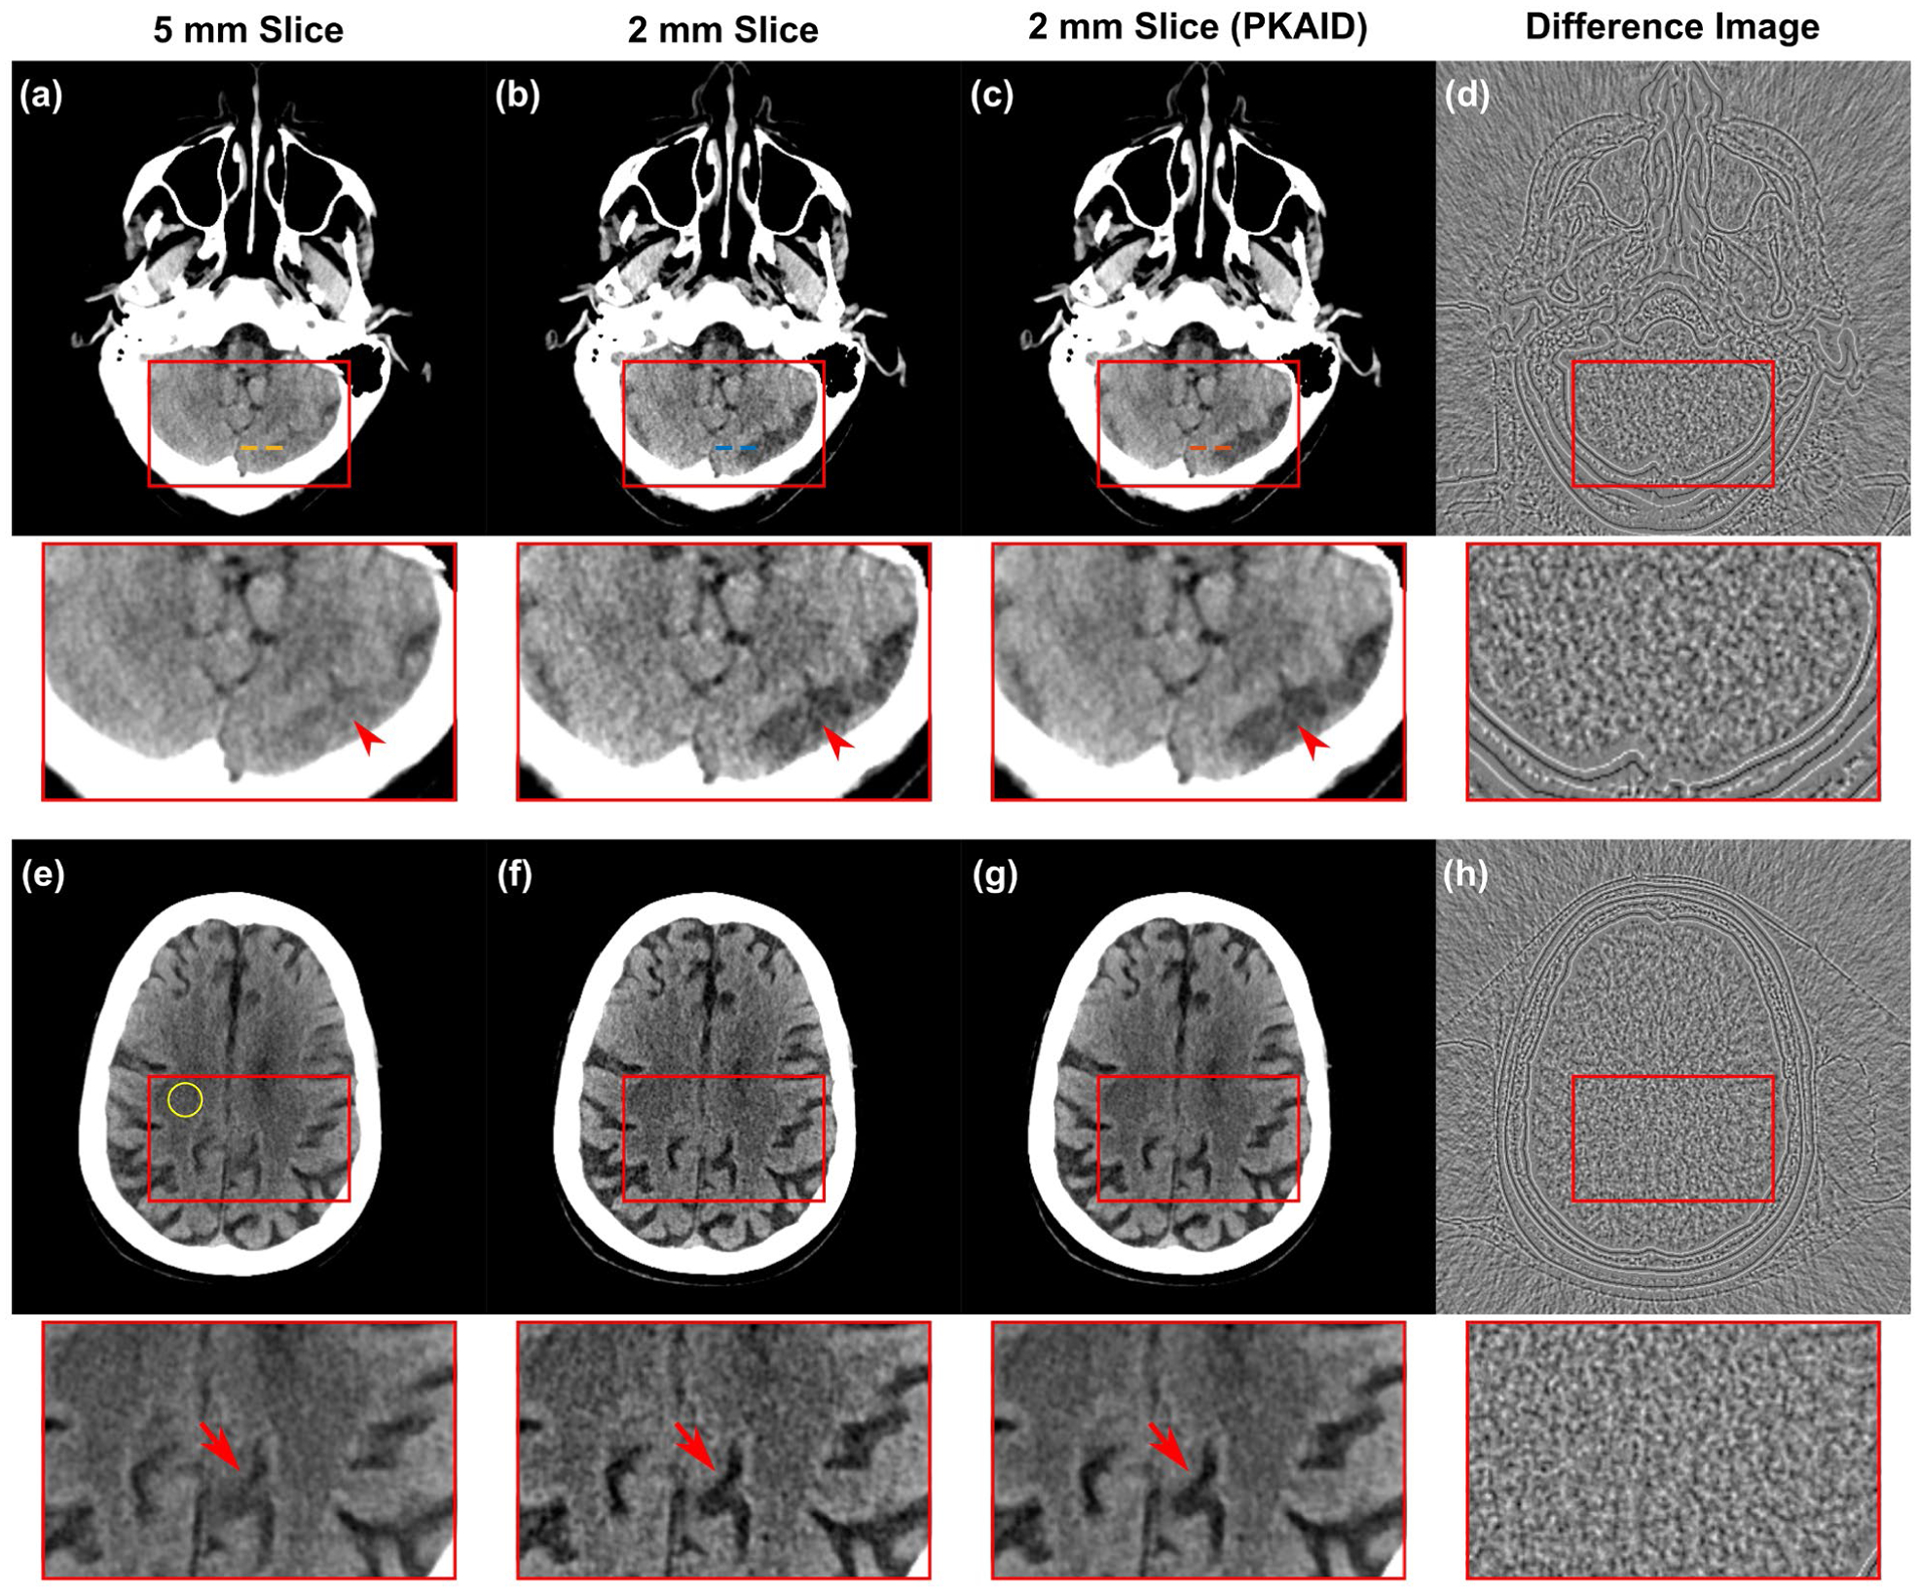
Example of non-contrast head CT images acquired on patient 1. (a,e): images reconstructed with clinically used 5 mm slice thickness; (b,f): thin slice images with 2 mm slice thickness before denoising; (c,g): 2 mm slice thickness after PKAID. (d,h): the difference images between the 2 mm images before and after denoising. Dashed circle in (d) shows the location of ROI used for noise evaluation. Dashed lines in (a-c) show the locations of line profiles in Figure 6. Window width/level (WW/WL) = 80/40 HU for the anatomical images, 20/0 HU for the difference image.
Figure 6:
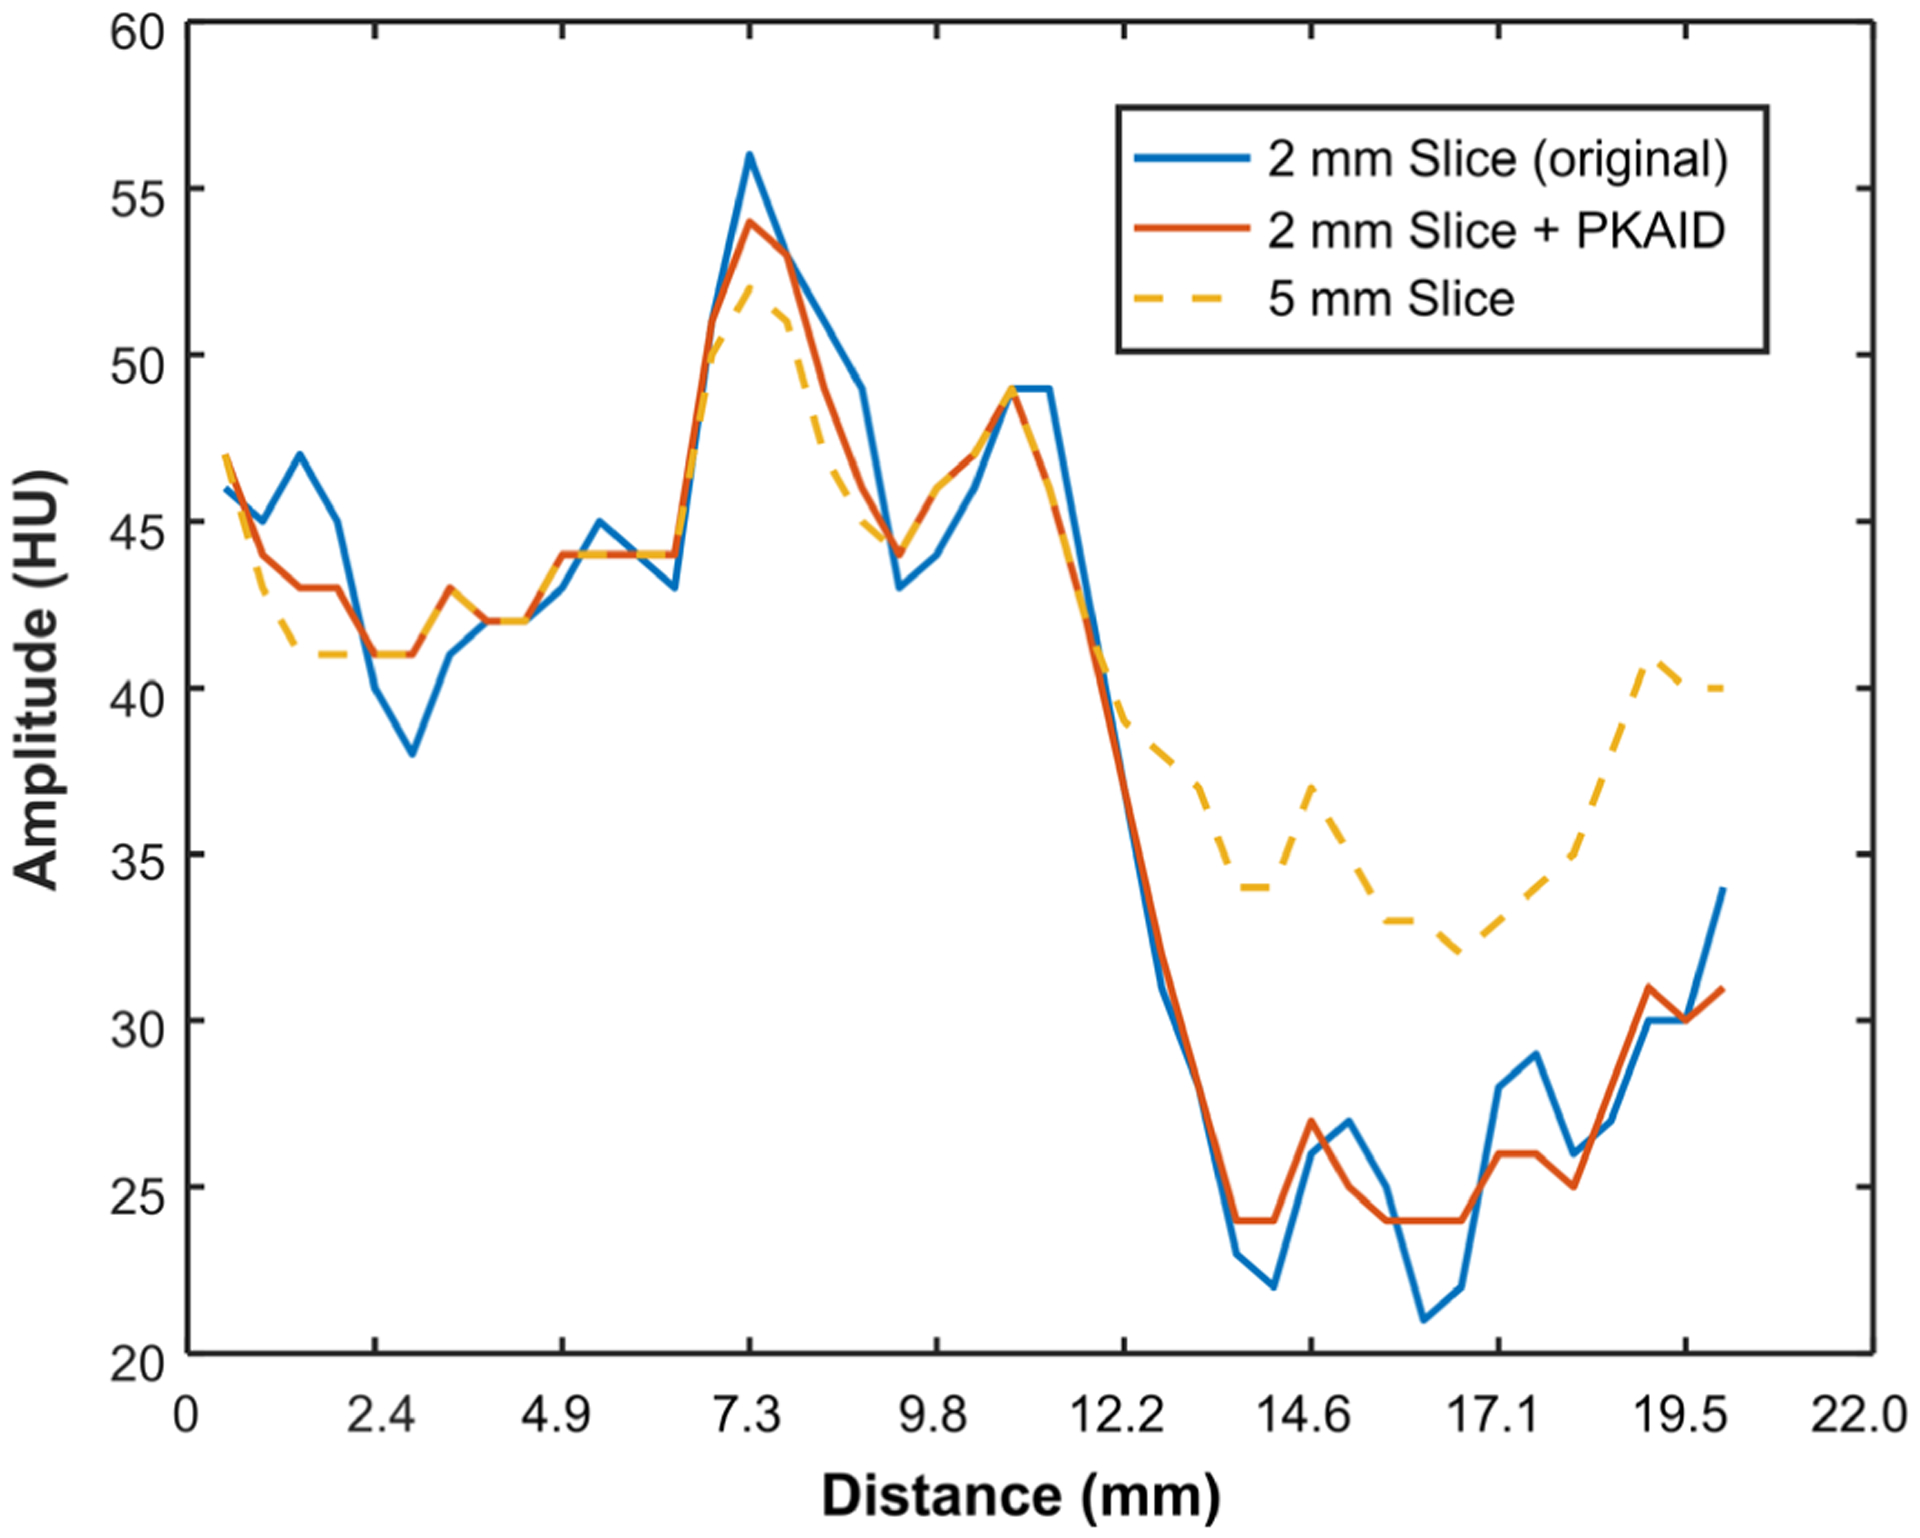
Line profiles in the 5 mm image, 2 mm image before and after PKAID processing. The line profiles were drawn across the boundary of cerebellar tissue as shown in Figure 5a–c.
Figure 7 shows the second patient case reconstructed with different slice thicknesses, and before/after PKAID processing. Compared to the standard 5 mm image (a), the 2 mm image in (b) better depicts the right-sided subdural hematoma (arrows) and its boundary with adjacent brain, but suffered from excessive image noise making visualization of the grey-white junction challenging. The PKAID processed 2 mm (shown in c) reduces image noise to a similar level as the 5 mm, while better depicting the subdural collection and grey-white junction. The noise levels were measured (circular ROI shown in 7a) to be 3.1 HU for 5 mm image, 4.6 HU for the original 2 mm image, and 3.1 HU for 2 mm image with PKAID. The difference image before and after PKAID (Figure 7d) shows minimal anatomical structure in soft tissue. Figure 8 shows the line profiles across the frontal lobe brain tissue with fluid space in-between. The decrease of pixel value due to the presence of surrounding liquid is less prominent in 2 mm than 5 mm image. This image feature is preserved with PKAID.
Figure 7:
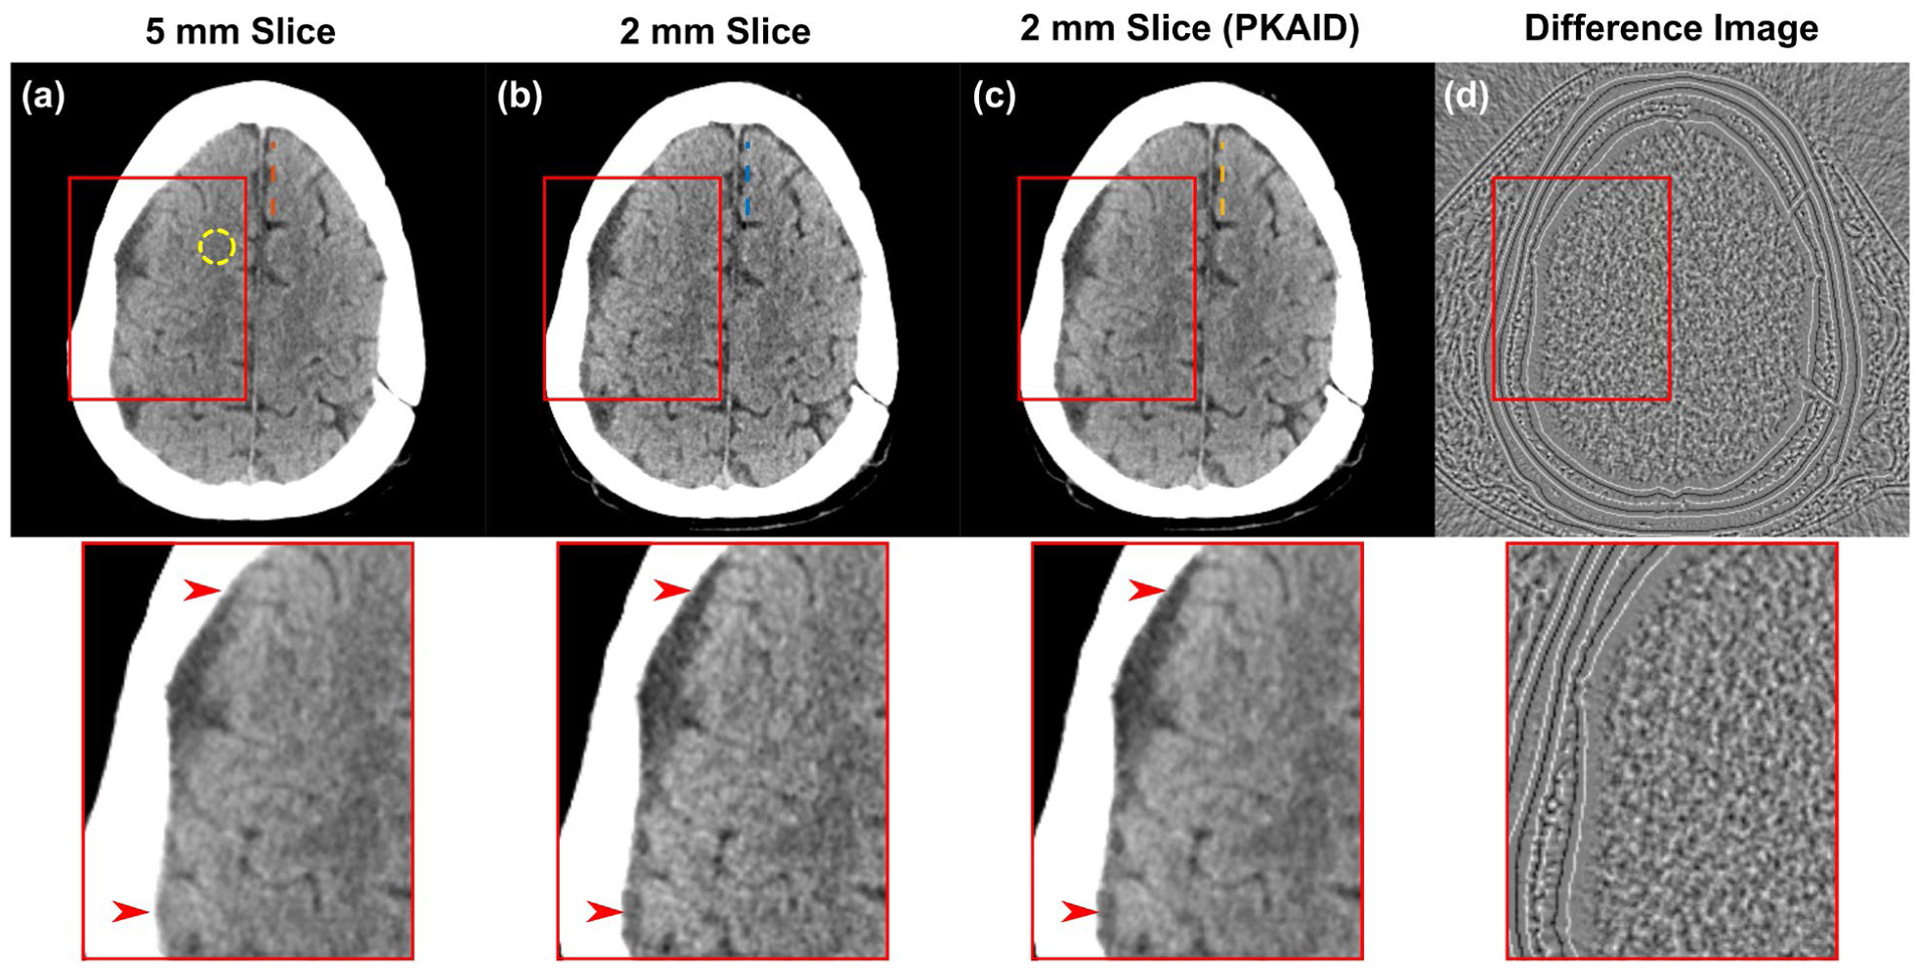
Example of non-contrast head CT images acquired on patient 2. (a): images reconstructed with clinically used 5 mm slice thickness; (b): thin slice images with 2 mm thickness before denoising; (c): 2 mm thickness after PKAID; (d): difference image between the 2 mm images before and after denoising. Dashed circle in (a) shows the location of ROI used for noise evaluation. Dashed lines show the locations of line profiles in Figure 8. Window width/level (WW/WL) = 80/40 HU for the anatomical images, 20/0 HU for the difference image.
Figure 8:
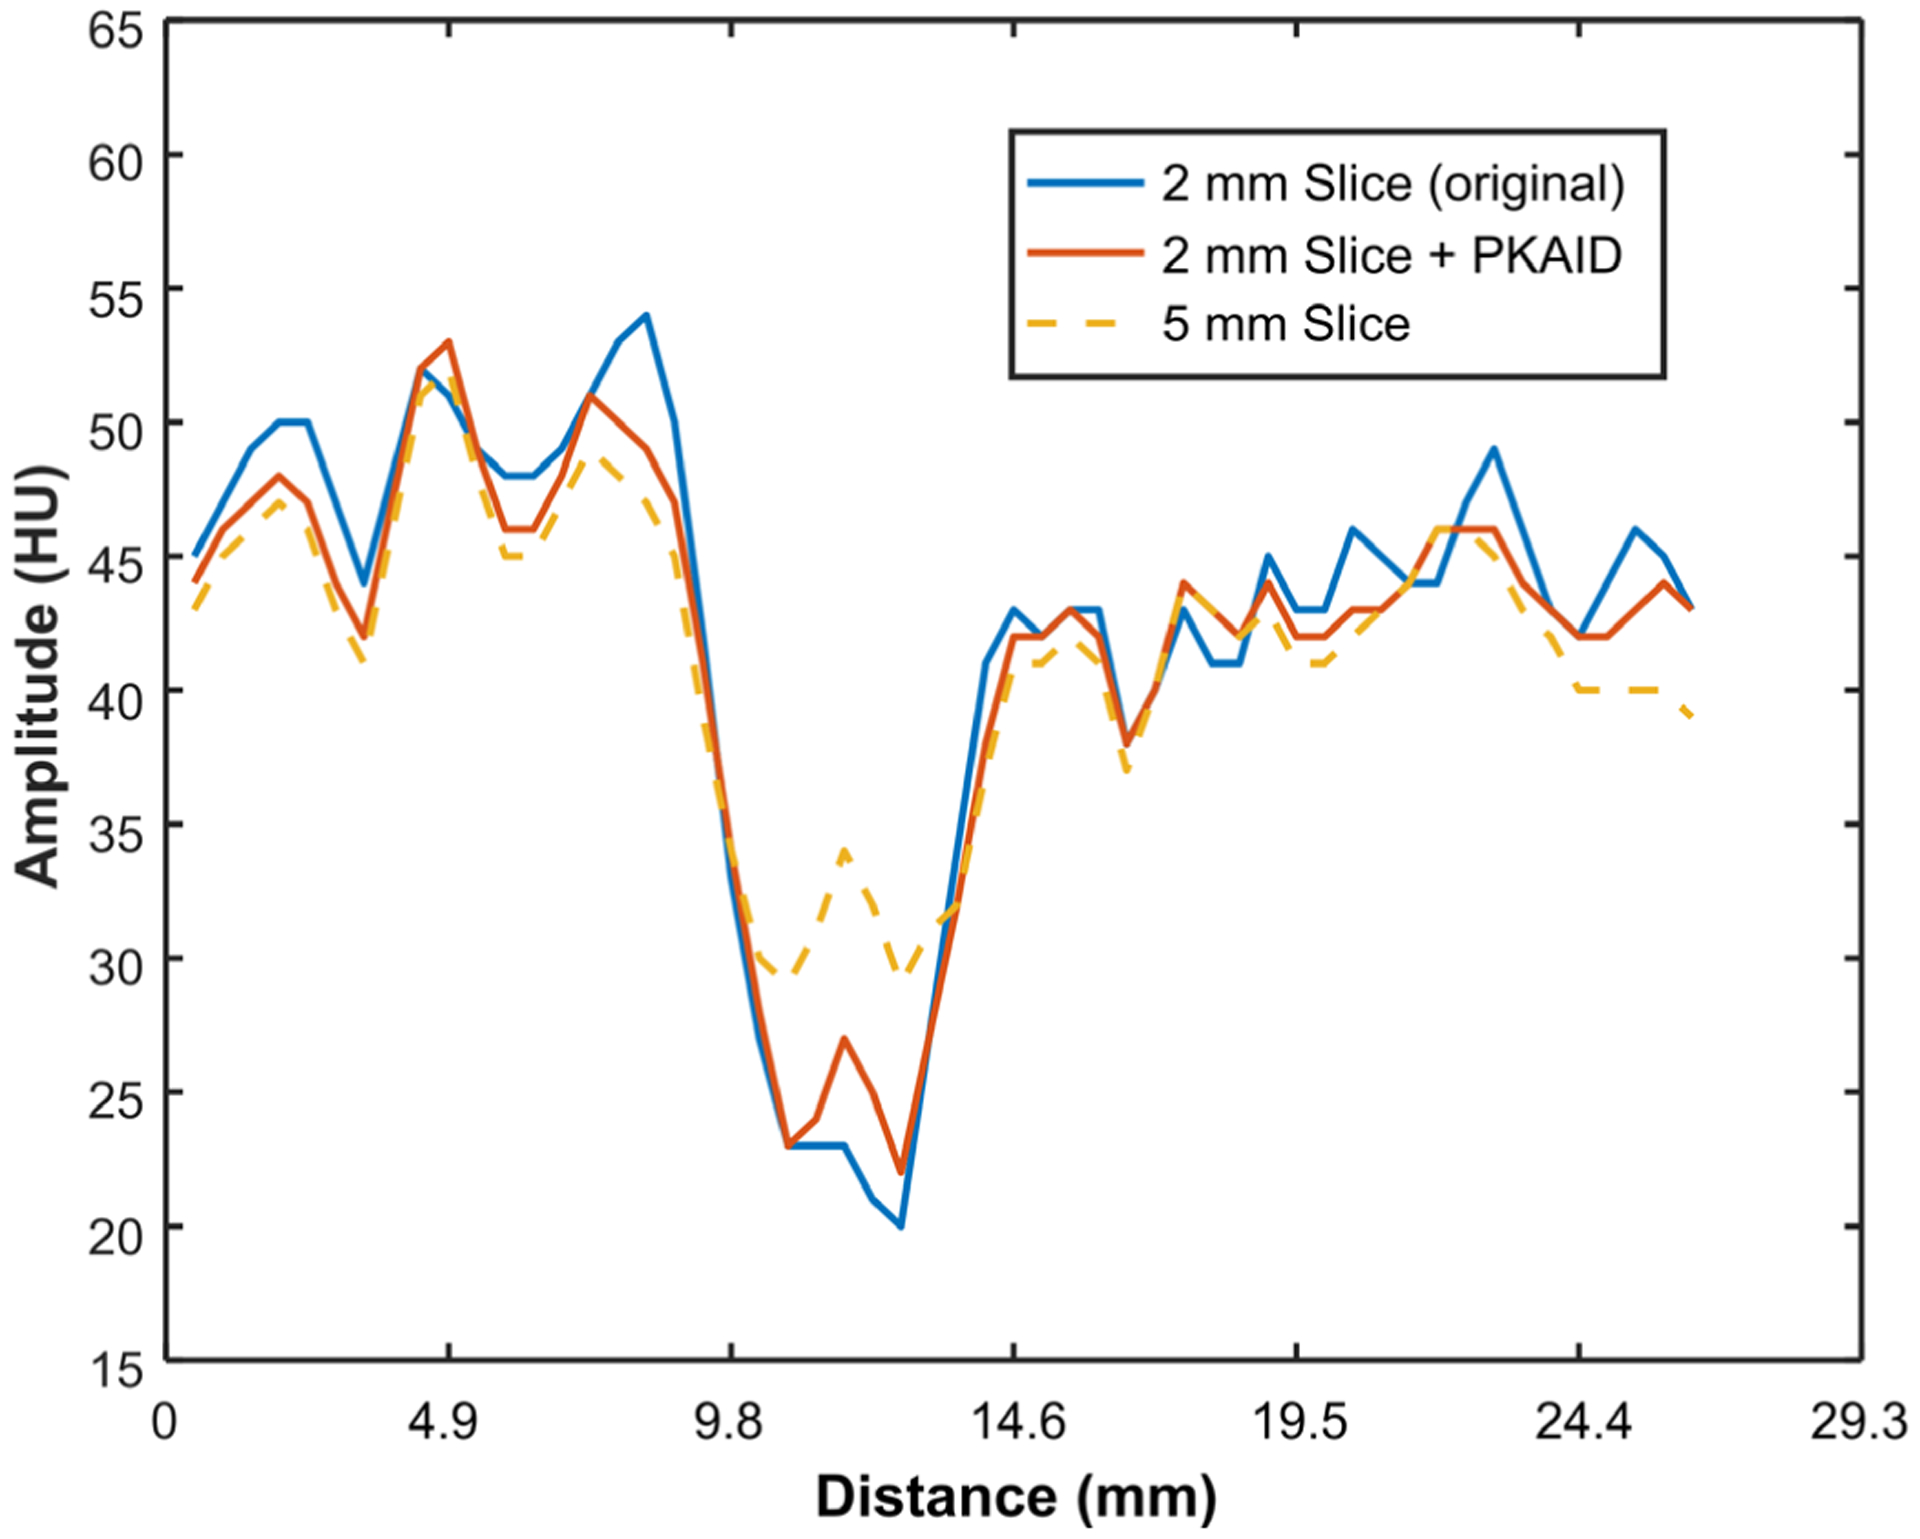
Line profiles in the 5 mm image, 2 mm image before and after PKAID processing. The line profiles were drawn across some cerebral gyri in the frontal lobe (Figure 7).
Figure 9 illustrates another patient case showing hemorrhage within right-side subdural hematoma and cerebral atrophy. Note the better defined hematoma margin and internal structure with 2 mm image after PKAID and reduced image noise from PKAID. The line profiles in Figure 10 shows that, compared to the standard 5 mm image, the boundary between a cerebral gyrus and the surrounding subarachnoid fluid is better defined in 2 mm image with PKAID. The signal fluctuation caused by noise is reduced in PKAID results compared to the original 2 mm image.
Figure 9:
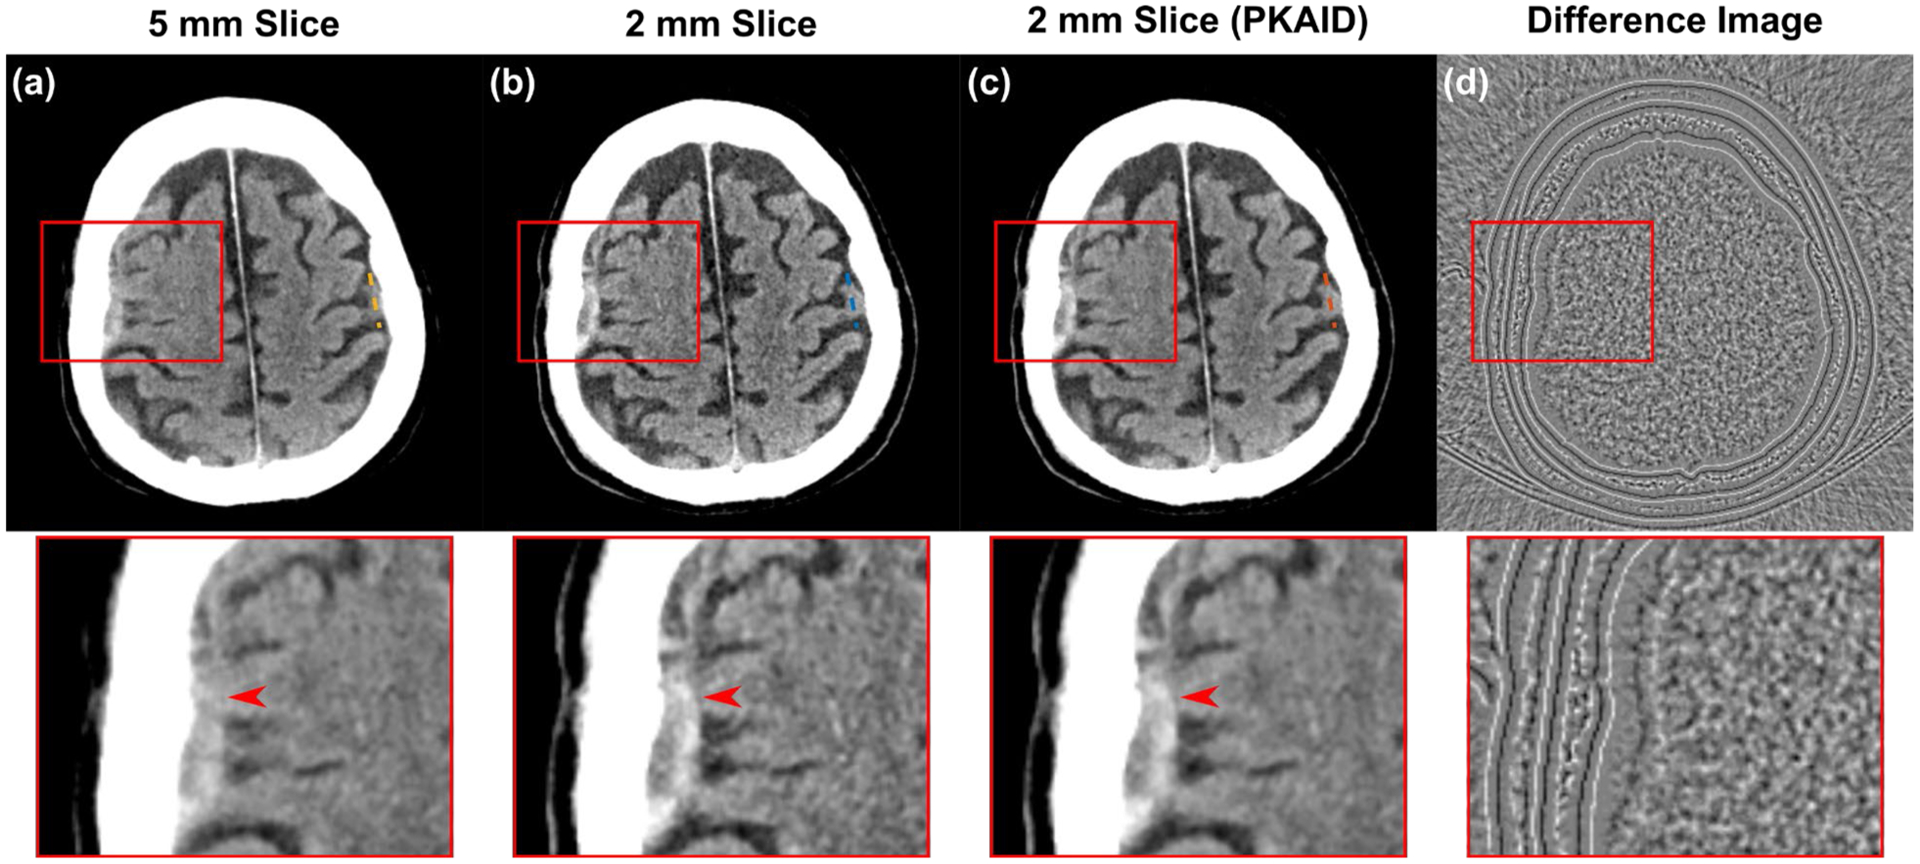
Example of non-contrast head CT images acquired on patient 3. (a): images reconstructed with clinically used 5 mm slice thickness; (b): thin slice images with 2 mm thickness before denoising; (c): 2 mm thickness after PKAID; (d): difference image between the 2 mm images before and after denoising. Dashed lines show the locations of line profiles in Figure 10. Window width/level (WW/WL) = 80/40 HU for the anatomical images, 20/0 HU for the difference image.
Figure 10:
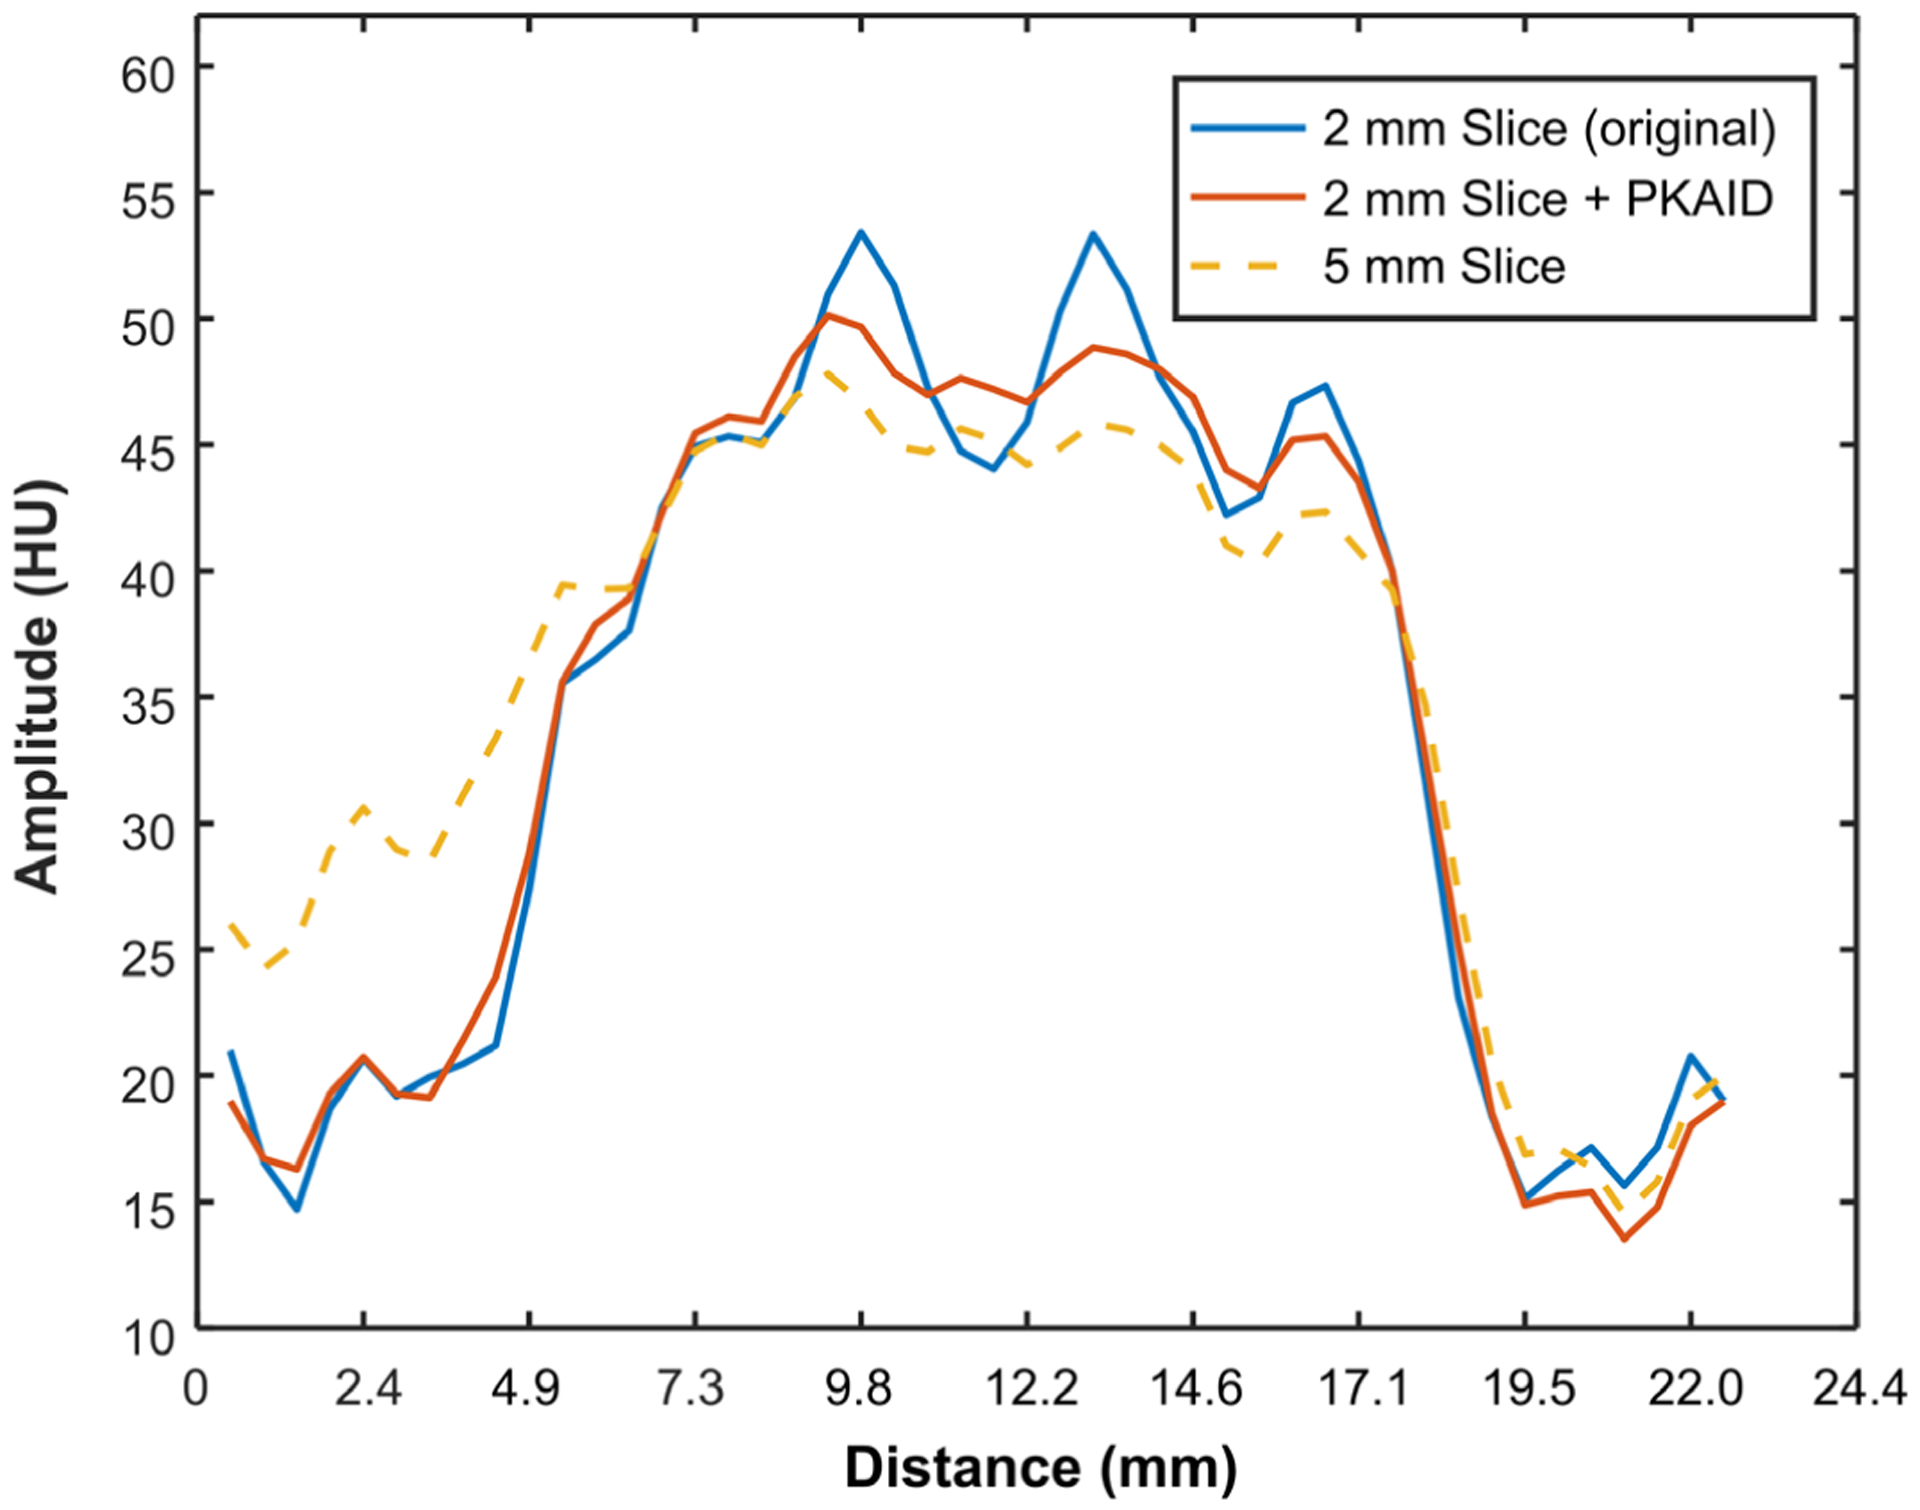
Line profiles in the 5 mm image, 2 mm image before and after PKAID processing. The line profiles were drawn across a cerebral gyrus and extended into adjacent subarachnoid fluid, as shown in Figure 9.
To demonstrate the use of the proposed technique for dose reduction, Figure 11 compares the image acquired with routine radiation dose (a) with the images from the simulated reduced dose exam using projection domain noise insertion before (b) and after (d) PKAID denoising. For comparison, the image after NLM denoising is also shown (c). Higher image noise is observed in the reduced-dose image compared to routine dose, which is expected. The PKAID reduces image noise, yielding images with comparable quality compared to that acquired with routine dose. The image noise was measured from circular ROI in a relatively uniform region in the image. The ROIs were picked to be representative of the overall image quality. The noise measurements and was 3.2 HU for routine dose, 4.0 HU for reduced-dose before denoising, 3.1 HU for reduced-dose after NLM denoising, and 3.1 HU for reduced-dose after PKAID, which is consistent with the qualitative visual evaluation. The image after NLM denoising showed modified image graininess compared to the full-dose image, which created a patchy appearance (see Fig. 11c, arrow and box in the magnified panel). Compared to the NLM filtering with similar denoising, PKAID maintained similar image graininess as the full-dose image, and reduced the patchy appearance of the NLM results (c vs. d, magnified panels).
Figure 11:

Brain images (and magnified panels) with routine radiation dose (a), 40% lower dose before (b) and after (d) PKAID denoising. (c) image denoised with non-local mean filtering. Dashed circles show the ROI for noise measurement. The arrows and boxes highlight the modified image graininess in the NLM-denoised image compared to full-dose image, which is improved with PKAID. Window width/level (WW/WL) = 80/40 HU for the full-scale images, 35/30 HU for the magnified panels.
4. Discussion
In this work, we have demonstrated an iterative denoising framework that utilizes the spatial data redundancy in the slice increment direction to reduce image noise in thin-slice images. The proposed approach takes advantage of the low-noise property of the clinically used thick-slice images and exploits the structural similarity between thick- and thin-slice images to reduce the noise in the latter. The proposed approach was tested using a series of phantom experiments. These results showed that PKAID was able to reduce the noise in the thin-slice image to a comparable level as the clinical thick-slice image, while preserving image resolution, noise texture and slice sensitivity profile of the original thin-slice images.
We demonstrated the performance of PKAID in patient non-contrast head CT data. Examples of patient images show that this technique can permit better delineation of anatomical structures and key pathologies than the routine clinical images, which are thicker, while controlling the image noise to be similar as that of the thick-slice image. It therefore simultaneously satisfies the clinical demands for low image noise and reduced partial volume effect, improving the diagnostic value of clinical CT images (Riedel et al., 2012; Marks et al., 1999). It can also be used to reduce radiation dose without sacrificing image quality and diagnostic outcome. As demonstrated with our example using reduced-dose patient data simulated with projection domain noise insertion, 40% dose reduction can be readily achieved using this technique. The images processed using PKAID demonstrate comparable noise level and quality compared to the routine dose image. Further clinical study with real reduced-dose patient data is needed in the future for a more thorough evaluation. Although feasibility was examined using non-contrast head CT, this approach can also be applied to other CT applications and for any body part or pathology. For high-resolution lung imaging and musculoskeletal (MSK) imaging applications, for example, PKAID can be used to produce low-noise, thin-slice image which permits better visualization of fine anatomical structures (Kazerooni, 2001; Burghardt et al., 2011; Webb, 2006).
The proposed approach is implemented in image domain and does not require access to raw projection data. It therefore can be readily implemented in a clinical environment. In addition, it can be combined with iterative reconstruction framework to take advantage of both techniques and further lower image noise. Our current Matlab implementation (Matlab 9.6, MathWorks, Inc., Natick, Massachusetts, USA) of the algorithm on a desktop workstation (6-core 3.4 GHz CPU with 16 GB memory) takes about 2 minutes to process each 512 by 512 image. Although the current implementation is relatively slow, we expect the computational time to be reduced with code optimization, and/or when implemented on GPU platform.
By generating high-quality thin-slice images, this technique can potentially allow better visualization of key anatomical structure or pathologies. Alternatively, this technique can be used to reduce patient radiation dose for the same slice thickness. Although performing additional denoising and generating images of different slice thicknesses adds more work to the current workflow, we hope these benefits from using this method will justify the additional work. Further clinical study is warranted to investigate its impact in various clinical applications.
The shape and peak of the noise power spectrum can affect the noise texture, while the noise texture has been shown to affect detection of certain pathologies and considered as an important aspect of image quality (Boedeker et al., 2007; Solomon et al., 2012). In this work, we decided to use 5 mm as prior, as it better preserves the shape of noise power spectrum compared to the other cases. The clinical impact of preserving noise power spectrum may depend on the specific clinical task, and will require a separate clinical study to investigate its effect.
The proposed technique should not affect multiplanar reformats because it preserves the in plane resolution and slice profile, as demonstrated in the phantom study. On some CT scanners, image series in coronal or sagittal plane are directly reconstructed for diagnostic purpose. We expect the proposed method can be directly applied in such scenarios, either to produce thin-slice image or to reduce patient radiation dose. Different helical pitches and interpolation ranges should not affect the denoising performance, as the structural similarity still exists between thin and thick slice images at various pitch values. However, as a denoising technique, this method would not solve or reduce various artifacts intrinsic to the use of higher pitch for data acquisition.
The method developed in this work is intended to be used for diagnostic CT applications to generate thin slice images compared to the clinically used thick slice image, or used as a dose-reduction technique. In many diagnostic CT applications, such as the non-contrast head CT exam studied in this work, it is common to generate image series with relatively thick slice thickness, e.g., 2 to 5 mm, with much better in-plane resolution compared to the thickness (z direction). For such applications, the 2D NPS analysis is more appropriate as the z direction does not have sufficient samples (i.e., slice thickness and increment) to allow meaningful analysis of noise power spectra in that direction. 3D NPS will be more relevant for a 3D isotropic CT imaging, like in the case of cone beam CT. However, further study is required to investigate the performance of the proposed method in that realm.
5. Conclusion
We developed an iterative denoising framework exploiting structural data redundancy in slice increment direction to generate thin-slice low-noise image that simultaneously meets the clinical demands for low noise and reduced partial volume effect. We demonstrated this technique using head CT and showed that it could improve the diagnostic quality of clinical CT images, or reduce patient radiation dose.
Acknowledgements
Research reported in this article was supported by the National Institutes of Health under award number R01 EB016966, R01 EB028590 and C06 RR018898. The content is solely the responsibility of the authors and does not necessarily represent the official views of the National Institute of Health.
References:
- Boedeker KL, Cooper VN and McNitt-Gray MF 2007. Application of the noise power spectrum in modern diagnostic MDCT: part I. Measurement of noise power spectra and noise equivalent quanta Phys Med Biol 52 4027–46 [DOI] [PubMed] [Google Scholar]
- Burghardt AJ, Link TM and Majumdar S 2011. High-resolution computed tomography for clinical imaging of bone microarchitecture Clin Orthop Relat Res 469 2179–93 [DOI] [PMC free article] [PubMed] [Google Scholar]
- Chen GH, Tang J and Hsieh J 2009. Temporal resolution improvement using PICCS in MDCT cardiac imaging Medical Physics 36 2130–5 [DOI] [PMC free article] [PubMed] [Google Scholar]
- Chen GH, Tang J and Leng S 2008. Prior image constrained compressed sensing (PICCS): a method to accurately reconstruct dynamic CT images from highly undersampled projection data sets Med Phys 35 660–3 [DOI] [PMC free article] [PubMed] [Google Scholar]
- Diwakar M and Kumar M 2018. A review on CT image noise and its denoising Biomed Signal Proces 42 73–88 [Google Scholar]
- Ehman EC, Yu L, Manduca A, Hara AK, Shiung MM, Jondal D, Lake DS, Paden RG, Blezek DJ, Bruesewitz MR, McCollough CH, Hough DM and Fletcher JG 2014. Methods for clinical evaluation of noise reduction techniques in abdominopelvic CT Radiographics 34 849–62 [DOI] [PubMed] [Google Scholar]
- Jagoda AS, Bazarian JJ, Bruns JJ Jr., Cantrill SV, Gean AD, Howard PK, Ghajar J, Riggio S, Wright DW, Wears RL, Bakshy A, Burgess P, Wald MM, Whitson RR, American College of Emergency P, Centers for Disease C and Prevention 2008. Clinical policy: neuroimaging and decisionmaking in adult mild traumatic brain injury in the acute setting Ann Emerg Med 52 714–48 [DOI] [PubMed] [Google Scholar]
- Kalisz K, Buethe J, Saboo SS, Abbara S, Halliburton S and Rajiah P 2016. Artifacts at Cardiac CT: Physics and Solutions Radiographics 36 2064–83 [DOI] [PubMed] [Google Scholar]
- Kazerooni EA 2001. High-resolution CT of the lungs AJR Am J Roentgenol 177 501–19 [DOI] [PubMed] [Google Scholar]
- Kocher KE, Meurer WJ, Fazel R, Scott PA, Krumholz HM and Nallamothu BK 2011. National trends in use of computed tomography in the emergency department Ann Emerg Med 58 452–62 e3 [DOI] [PubMed] [Google Scholar]
- Larson DB, Johnson LW, Schnell BM, Salisbury SR and Forman HP 2011. National trends in CT use in the emergency department: 1995–2007 Radiology 258 164–73 [DOI] [PubMed] [Google Scholar]
- Lauzier PT and Chen GH 2013. Characterization of statistical prior image constrained compressed sensing (PICCS): II. Application to dose reduction Med Phys 40 021902. [DOI] [PMC free article] [PubMed] [Google Scholar]
- Lauzier PT, Tang J and Chen GH 2012. Prior image constrained compressed sensing: Implementation and performance evaluation Medical Physics 39 66–80 [DOI] [PMC free article] [PubMed] [Google Scholar]
- Leng S, Yu L, Wang J, Fletcher JG, Mistretta CA and McCollough CH 2011. Noise reduction in spectral CT: Reducing dose and breaking the trade-off between image noise and energy bin selection Med Phys 38 4946–57 [DOI] [PubMed] [Google Scholar]
- Li Z, Leng S, Yu L, Manduca A and McCollough CH 2017. An effective noise reduction method for multi-energy CT images that exploit spatio-spectral features Med Phys 44 1610–23 [DOI] [PMC free article] [PubMed] [Google Scholar]
- Li Z, Yu L, Trzasko JD, Lake DS, Blezek DJ, Fletcher JG, McCollough CH and Manduca A 2014. Adaptive nonlocal means filtering based on local noise level for CT denoising Med Phys 41 011908. [DOI] [PubMed] [Google Scholar]
- Maetani K, Namiki J, Matsumoto S, Matsunami K, Narumi A, Tsuneyoshi T and Kishikawa M 2016. Routine Head Computed Tomography for Patients in the Emergency Room with Trauma Requires Both Thick- and Thin-Slice Images Emerg Med Int [DOI] [PMC free article] [PubMed] [Google Scholar]
- Marks MP, Holmgren EB, Fox AJ, Patel S, von Kummer R and Froehlich J 1999. Evaluation of early computed tomographic findings in acute ischemic stroke Stroke 30 389–92 [DOI] [PubMed] [Google Scholar]
- Nocedal J and Wright SJ 2006. Numerical optimization (New York: Springer; ) [Google Scholar]
- OECD 2019. Computed tomography (CT) exams (indicator). doi: 10.1787/3c994537-en (Accessed on 28 May 2019). [DOI] [Google Scholar]
- Riedel CH, Zoubie J, Ulmer S, Gierthmuehlen J and Jansen O 2012. Thin-slice reconstructions of nonenhanced CT images allow for detection of thrombus in acute stroke Stroke 43 2319–23 [DOI] [PubMed] [Google Scholar]
- Siewerdsen JH, Cunningham IA and Jaffray DA 2002. A framework for noise-power spectrum analysis of multidimensional images Med Phys 29 2655–71 [DOI] [PubMed] [Google Scholar]
- Solomon JB, Christianson O and Samei E 2012. Quantitative comparison of noise texture across CT scanners from different manufacturers Med Phys 39 6048–55 [DOI] [PubMed] [Google Scholar]
- Tao S, Rajendran K, McCollough CH and Leng S 2018. Material decomposition with prior knowledge aware iterative denoising (MD-PKAID) Phys Med Biol 63 195003. [DOI] [PubMed] [Google Scholar]
- Tao S, Rajendran K, Zhou W, Fletcher JG, McCollough CH and Leng S 2019. Improving iodine contrast to noise ratio using virtual monoenergetic imaging and prior-knowledge-aware iterative denoising (mono-PKAID) Phys Med Biol 64 105014. [DOI] [PMC free article] [PubMed] [Google Scholar]
- von Kummer R, Bourquain H, Bastianello S, Bozzao L, Manelfe C, Meier D and Hacke W 2001. Early prediction of irreversible brain damage after ischemic stroke at CT Radiology 219 95–100 [DOI] [PubMed] [Google Scholar]
- Webb WR 2006. Thin-section CT of the secondary pulmonary lobule: anatomy and the image--the 2004 Fleischner lecture Radiology 239 322–38 [DOI] [PubMed] [Google Scholar]
- Winklehner A, Karlo C, Puippe G, Schmidt B, Flohr T, Goetti R, Pfammatter T, Frauenfelder T and Alkadhi H 2011. Raw data-based iterative reconstruction in body CTA: evaluation of radiation dose saving potential Eur Radiol 21 2521–6 [DOI] [PubMed] [Google Scholar]
- Yu L, Shiung M, Jondal D and McCollough CH 2012. Development and validation of a practical lower-dose-simulation tool for optimizing computed tomography scan protocols J Comput Assist Tomogr 36 477–87 [DOI] [PubMed] [Google Scholar]
- Yu ZC, Leng S, Li ZB and McCollough CH 2016. Spectral prior image constrained compressed sensing (spectral PICCS) for photon-counting computed tomography Phys Med Biol 61 6707–32 [DOI] [PMC free article] [PubMed] [Google Scholar]


