Abstract
Utilized and waste jasmine flower contains a high portion of organic carbohydrate and other organic acids, making it a suitable substrate for bioethanol production. This study was designed to estimate the prospective of waste jasmine flower biomass applied with chemical (alkaline) and thermal pretreatment applied on samples through bioethanol production efficiencies. Therefore, pretreatment and enzymatic hydrolysis are directed to disrupt the complex cell wall layer and improve the accessibility towards polysaccharide fraction. Also, applying response surface methodology tools during fermentative bioethanol production to study the interactive effects of different bioprocess variables for higher bioethanol yield in batch small and large scale model is discussed. The immobilized yeast between jasmine found that jasmine sugar utilization was 50%. The jasmine flower's ethanol production was 6.54 g/L and after distillation of jasmine was 31.40 g/L at pH 4.5. Results showed that this immobilized yeast method could be successfully used for bioethanol production from waste jasmine flower.
Keywords: Waste jasmine flower, Enzymatic hydrolysis, Bioethanol conversion, Green fuel
Introduction
The pollution of the environment, high dependence on non-renewable conventional fuels, the lack of fossil fuel supply, and global warming are the most significant obstacles encountering the world (Mejica et al. 2021; Ramaraj and Unpaprom 2019a). Among numerous alternatives, biomass has attracted much attention as an endless power source to replace conventional fossil fuels due to its consistent power supply capacity and the fundamental nature of being eco-friendly (Wannapokin et al. 2017, 2018). Bioethanol is also known as ethyl alcohol or chemically C2H5OH or EtOH. Moreover, it can be used directly as pure ethanol or blended with gasoline to produce “gasohol,” also used to suppress exhaust gases in bioethanol–diesel blends and as a fuel improver or octane enhancer (Nguyen et al. 2020a, b). Bioethanol offers several advantages over gasoline, such as higher octane number (108), broader flammability limits, higher flame speeds, and increased vaporization heats. In contrast to petroleum fuel, bioethanol is less toxic, readily biodegradable and produces lesser air-borne pollutants (Vu et al. 2017).
Grasses, agricultural wastes, and forest residues biomass are lignocellulosic sources, and biomass has been studied for biofuel production (Nong et al. 2020a, b; Sophanodorn et al. 2020). Aside from these, flowers are one of the available biomass source. Aisa has the world's largest floriculture industry. In those places, the floral market occupies a significant share of commerce and is an essential income source for the local traders as thousands of devotees’ daily throng these temples and pay floral tributes. Proper disposal of the floral offerings is a substantial problem due to the shortage of dumping grounds and stringent environmental laws. Because of these difficulties, tons of floral offerings generated daily are generally disposed of in open dumps or are released in the river generating foul odor and act as breeding centers for disease-causing microorganisms (Yadav et al. 2015). On the other hand, these misuse florals have a usually unexploited and enormous potential to become wealthy utilizing existing, low-cost and basic technologies. This floral waste can be utilized in different ways to produce valuable products and thus help save the environment from pollution caused due to improper disposal of flower waste.
Flowers contain sugars that can easily be converted to ethanol. Jasmine is one of the oldest, fragrant and traditional flowers of India and other Asian countries. Jasmine flowers are used to prepare jasmine string, veni, jadai, and jasmine garland and produce concrete, absolute, perfumes and essential oil. Jasminum sambac is variable and includes many cultivars bearing single, double flowers with elongated or rounded petals. Four distinct sub-varieties of J. sambac are based on a flower bud, petal shape and number of whorls. The different varieties showed minor variations in habit, internode length, size, the shape of the leaf, calyx, number of whorls of petals and their size and shape, size of open flower and in the number of stamens, but the marked difference was observed in the length of style and stigma (Sabharwal et al. 2013). Floral nectar is the most vital benefit offered to pollinators in angiosperms.
The disaccharide sucrose and the hexose monosaccharides sugar and fructose are the main sugars in nectar. All-natural sugars in various types of sucrose, fructose, and glucose are the foundations of nectar. Furthermore, nectars contain a variety of additional chemical compounds. Floral nectar characteristics such as sugar composition, sucrose, hexose proportions, concentration, quantity, time of nectar secretion, and nectar characteristics are frequently about pollinators' communication and flowers. Nectar is produced by glands called nectaries. Nectaries can be located on any part of a plant; however, one of the most familiar nectaries is situated in flowers (Wolff 2006).
However, pretreatment is required to obtain potentially fermentable sugars during the hydrolysis phase. The pretreatment aims to break down the lignin structure and disrupt the crystalline structure of cellulose for enhancing enzyme accessibility to the cellulose during the hydrolysis step. In the present study, chemical and thermal pretreatment were optimized to increase the fermentable sugar content. The enhance the enzymatic hydrolytic efficiency, the lignin–hemicellulose network has to be loosened for the better amenability of cellulases to residual carbohydrate fraction for sugar recovery. Also, the hydrolysis reaction releases sugars that are usually linked together in complex chains (Ramaraj and Unpaprom 2019b). The hydrolysis process break-down the cellulose chains to produce more simple sugars. This study used an enzyme catalyst called “cellulase” to hydrolysis lignocellulose. This study aims at developing a feasible fermentation technology to effectively use the lignocellulosic biomass of waste jasmine flower by concerning the hydrolysates derived from optimized pretreatment and enzymatic hydrolysis. The enzymatic hydrolysate obtained from the pretreated jasmine flower was subjected to fermentation through separate hydrolysis fermentation by Saccharomyces cerevisiae under the anaerobic condition bioethanol production.
Materials and methods
Feedstock preparations
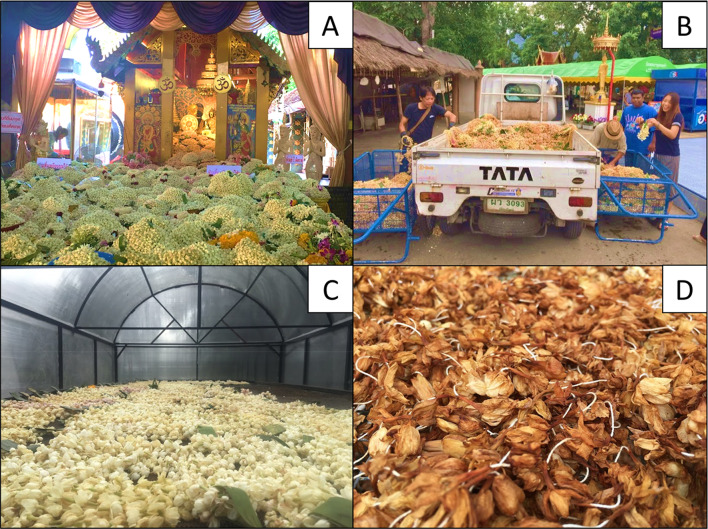
Waste fresh Jasminum sambac flowers were collected from Wat Phra That Doi Kham, Mu Ban Chiang Mai Lake Land Rd, Su Thep District, Chiang Mai Province, Thailand 50200 (Latitude 18.7595° N, Longitude 98.9189° E) as shown in Fig. 1. The flowers were transferred to the Energy Research Center (ERC), Maejo University (MJU), for further study. Flowers that were washed with tap water to remove dust and other debris were then dried using solar dryers at Ban Mueang Kaeo, Mae Rim District, Chiang Mai 50180 reduce the moisture content. The dried flowers were collected, afterward powdered by blender about 1–2 mm. Jasmine power was packed in an airtight plastic bag and placed at 4 °C for further use.
Fig. 1.
Jasmine flower a from temple after worship, b waste jasmine flower collection, c jasmine flowers dried by a solar dryer and d dried jasmine flowers
Pretreatment methods
Chemical pretreatment
Alkaline pretreatment, a typical chemical pretreatment, has received deep research interests. Therefore, the pretreatment was carried out with an alkaline solution (1 % of sodium hydroxide solution, 1%NaOH) applied to powered jasmine. The reaction mixture was thoroughly mixed with agitation and properly sealed to prevent leaks, and the temperature was kept within the desired range for the desired time.
Thermal pretreatment
Thermal pretreatment was studied as a second technique by boiling method 100 °C at 10–15 min and autoclave method was conducted at temperature 121 °C for 15 min with two different types of autoclave i.e. scientific and traditional autoclave.
Experimental design of pretreatment and enzyme hydrolysis
The experiments of pretreatment and enzyme hydrolysis were carried out in batch type laboratory-scale fermentors and were classified into five treatments (T) used: Treatment 1 (T1: 1%NaOH + enzyme hydrolysis) which was examining with 1%NaOH ratio 1:4 (samples: 1%NaOH) for 48 h’ retention time. Treatment 2 (T2: boiling + enzyme hydrolysis) was used with distilled water ratio 1:13 (samples: distilled water), afterward allow to boil for 10–15 min. Treatment 3 (T3: solid from T2 + 1%NaOH + enzyme hydrolysis), the solid was directly utilized from the Treatment 2. Around 50 ml of solid was used from treatment, after that added 1%NaOH, ratio 1:4 (samples: 1%NaOH) with 48 h’ retention time. Treatment 4 (T4: boiling + autoclave + enzyme hydrolysis) and Treatment 5 (T5: solid + 1%NaOH + enzyme hydrolysis) was used with distilled water, ratio 1:13 (samples: distilled water). After thoroughly mixing, the sample was boiled 10–15 min, then applied autoclave at 121 °C for 15 min. Experiment 5: Treatment 5 (T5: solid + 1%NaOH + enzyme hydrolysis), the 50 ml solid was utilized from Treatment 4, and then solid was mixed with 1% NaOH ratio, 1:4 (samples: 1%NaOH) and kept for 48 h.
The 20 g dried jasmine powder was used in all the treatments. Subsequently, pH of the sample was adjusted to pH 5 before enzyme hydrolysis by adding 2% of enzyme cellulose. After adding an enzyme, the sample was allowed 24 h for the realistic reaction. After that, the hydrolyzed sample was filtered for solid and liquid separations. Finally, the filter was used to separate the solid and liquid parts. Subsequently, all the pretreatments and hydrolysis samples were allowed to estimate the total sugar and reducing sugar for select the best condition for further large scale fermentation.
Yeast production
In yeast genetics, general methods specify using yeast extract peptone–dextrose (YPD) medium for cultivating Saccharomyces cerevisiae TISTR 5020 and other yeasts. Yeasts grow well on a minimal medium containing only dextrose and salts.
Free cells yeast preparation
The yeasts are strain, S. cerevisiae, and Faculty of Science Laboratories, Maejo University, Sansai, Chiang Mai, Thailand. These yeasts were cultivated in liquid YPD medium (10 g/l yeast extract, 20 g/l peptones, and 20 g/l dextrose) at 150 rpm for 48 h at room temperature. After that, used centrifuge to separate the free cells yeast and YPD medium for immobilized ball and fermentation.
Immobilized yeast ball preparation
Gauze is a thin, translucent fabric with a loose open weave. In this study, gauze was used to prepare the immobilized yeast ball. Each ball contains a ball 1.5–2 cm diameter; the ball was covered with gauze. So gauze ball (stockings materials were obtained to prepare the ball) was used as substrate. Then gauze balls were allowed to autoclave without yeast at 121 °C for 15 min to sterilize that all bacteria, viruses, fungi, and spores are inactivated. After that, free yeast cells (with 2–2.5 ml) was injected into the gauze ball using a syringe.
Fermentation and ethanol measurement
The fermentation process was applied in the research is separate hydrolysis and fermentation (SHF). The samples were undergoing a pretreatment process to release necessary sugars for yeast digestion. Then, the pH was adjusted to 5.6. Fermentation was achieved using 2% (v/v) of free cell yeast and immobilized yeast ball (20 ml) within 2 L fermenters (Triplicates) at 30 °C–35 °C for 5 days’ incubation period. After 5 days, the immobilized yeast ball was separated for reuse in the second-time fermentation for 3 days. Every day, 100 ml solution was taken to measure the percentage of ethanol by using Ebulliometer (Dujardin-Salleron, Alcohol Burner, France). This method's principle is based on the different boiling points of pure water (distilled water) from water–alcohol solutions. The sample solution should be centrifuged to be free of suspended solid before measuring temperature with Ebulliometer. A calculating dial is used to determine the percentage of ethanol by comparing those two temperatures. Moreover, total sugar, reducing sugar and pH were also determined in these periods to test.
Distillation of ethanol
After fermentation, it is necessary to separate ethanol from the mixture of samples, water and yeasts, so-called distillation. The principle of this process is simply based on the different volatilities of ethanol from water. The fermentation broth was filtered and distilled at 78.3–79 °C because the ethanol boiling point is 78.37 °C. In this study, distillation was achieved using a distiller (marque: Black–220Volt–Glass Parts, Megahome).
Analytical measurements and calculation
The sugars and ethanol concentration was measured—ethanol yield estimated using an ebulliometer in triplicates. Ebulliometer used the different boiling points of distilled water compare to water-alcohol solutions. A calculating dial was used to calculate the percentage of ethanol in the solution by comparing two different boiling points from distilled water and the solution. Total sugar and reducing sugar were analyzed before and after the pretreatment process using phenol–sulfuric acid (Dubois et al. 1956) and the DNS standard method (Miller 1959). The sugar concentration was monitored alongside ethanol content during incubation.
Calculation
Sugar utilization, ethanol yield, ethanol productivity and fermentation efficiency were calculated using Eqs. (1), (2) and (3), respectively:
| 1 |
| 2 |
| 3 |
Scanning electron microscopy (SEM)
The dry powdered sample has been sprinkled (using a tweezer) in a specimen stub with double-sided conductive tape. The specimen stub has been blowing off by a blower to remove excess powder. It been observed under TM400plus Tabletop microscope with accelerating voltage of 15 kV and photo magnification of 300×– 400× BSE L image.
Statistical analysis and modeling
The values reported in the present study were the mean of three replicates. Moreover, data are reported as mean ± SE from triplicate observations. All Statistical analyses of data were performed using the program SPSS 20.0 (SPSS Inc., Chicago, IL, USA). A significant difference was considered at the level of p < 0.05.
Response surface methodology (RSM) was applied to optimize the condition of fermentation of jasmine and marigold to test the effect of factors consisting of reducing sugar concentration (g/L), pH, and time (hour) on ethanol concentration. The range of the independent factors was shown in Table 1. A total of 17 experiments with central points were designed randomly for reducing the effect of any expected variability in the output due to external factors. The effect of three factors on the produced ethanol was investigated using Box–Behnken design by Design-expert software (version 11.0, Statease, USA). The significance of the model and each model term were evaluated with analysis of variance (ANOVA) with a confidence level above 95%. The model's fit was evaluated by comparing R-squared and adjusted R-squared and insignificant lack of fit test. A second-order polynomial equation was used to estimate the relationship between the independent factors and the responses:
| 4 |
where Y: predicted response, is constant, represents the linear co-efficient, implies the co-efficient of the squared terms, expresses the co-efficient of the cross term products, factor K indicates the number of independent factors.
Table 1.
Table range of each independent variable in the Box–Behnken design
| Jasmine | Low | High |
|---|---|---|
| Reducing sugar (g/L) | 12.57 | 39.19 |
| pH | 4.193 | 5.6 |
| Time (h) | 24 | 120 |
Results and discussion
Characteristics and composition of the raw material
Waste jasmine flowers were obtained, and the flowers were washed with tap water to remove dust and other debris before being dried with a solar dryer, which was used as a renewable energy source to minimize the moisture content by 9.16%. One kilogram of fresh flowers of jasmine was dried; the results showed that 91.6 g dry weight. The results were comparable with mahula flowers (Behera et al. 2011), which were sun-dried in the open for 7 days to reduce the moisture content to 16–18%.
Sugars yield from pretreatment and enzymatic hydrolysis on a laboratory scale
In this study, pretreatment and enzyme hydrolysis results were presented in Fig. 2. Pretreatment is crucial for ensuring good ultimate sugars' yields from polysaccharides (Unpaprom et al. 2017). Hydrolysis without preceding pretreatment yields typically < 20%; whereas, yields after pretreatment often exceed 90% (Balat 2011). Therefore, the pretreatment process is essential to continue further enzymatic hydrolysis.
Fig. 2.
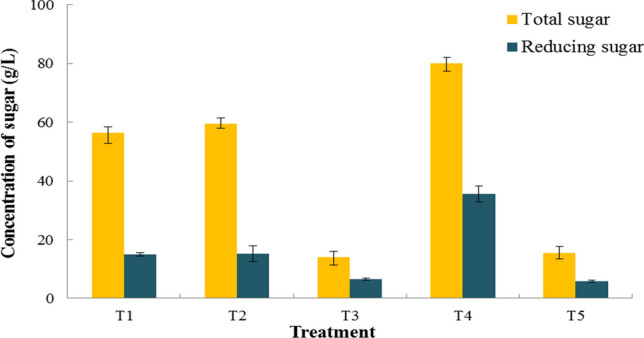
Concentration of sugar yield by different treatment of jasmine flower
There are several pretreatment processes was carried in this study included and measured total sugar and reducing sugar: Treatment 1 (T1: 1%NaOH + enzyme hydrolysis), Treatment 2 (T2: boiling + enzyme hydrolysis), Treatment 3 (T3: solid from T2 + 1%NaOH + enzyme hydrolysis), Treatment 4 (T4: boiling + autoclave + enzyme hydrolysis) and Treatment 5 (T5: solid + 1%NaOH + enzyme hydrolysis), the results were 56.37 ± 3.65 g/L, 59.37 ± 1.56 g/L, 13.94 ± 2.6 g/L, 80.07 ± 2.83 g/L and 15.52 ± 2.04 g/L, respectively. Treatment 4 (T4: boiling + autoclave + enzyme hydrolysis) received a higher total sugar yield than all treatments. It was accounted for that boiling and autoclave can altogether form the enzymatic hydrolysis profitability and total sugar yield (80.07 ± 2.83 g/L) obtained from jasmine flower.
The achieved reducing sugar by treatment 1–4 were 15.01 ± 0.54 g/L, 15.24 ± 2.75 g/L, 6.43 ± 0.35 g/L, 35.52 ± 2.65 g/L and 5.80 ± 0.50 g/L, respectively. Comparing to all the treatments, “Treatment 4” was observed that overall sugar production was high with reducing sugars obtained after enzyme hydrolysis of jasmine flower pretreatment and afforded an amount of 35.52 ± 2.65 g/L.
Microorganisms such as yeasts play an essential role in bioethanol production by fermenting a wide range of sugars to ethanol. The diversity of yeast species in particular niches is determined by utilizing different carbon sources and its nutritional selectivity as it exhibits great specialization for habitat (Azhar et al. 2017). Different fungal species are involved in biological pretreatment, while physicochemical pretreatment includes ammonia fiber explosion and steam. Dehydration of hexose and pentoses during pretreatment release furan compounds like 5-hydroxymethyl-2-furaldehyde and 2-furaldehyde. These furan derivatives induce cell growth inhibition and reduce ethanol productivity (Taherzadeh and Karimi 2008). The weak acid stress-induced inhibits yeasts fermentation from lignocellulosic materials. Due to primarily fermentable of reducing sugar is monosaccharide for yeast can convert simple sugar to ethanol. In this study, the best condition was observed from treatment 4 (T4: boiling + autoclave + enzyme hydrolysis); the total sugar concentration and reducing sugar were 80.07 ± 2.83 g/L and 35.52 ± 2.65 g/L, respectively. Therefore, the T4 method was selected for scale-up applications. Boiling the substrate in hot water is one of the hydrothermal pretreatment methods applied for lignocellulosic biomass (Taherzadeh and Karimi 2008).
Hydrothermal pretreatment was elevated recovery rates for pentose generates low amounts. This pretreatment process usually has involved with different temperature effects during the boiling process. Around 40–60% of the total mass is dissolved in this process, with 4–22% of the cellulose, 35–60% of the lignin. Moreover, all of the hemicellulose being removed (Hu et al. 2008). If the pH is maintained between 4 and 7, monosaccharide sugars' degradation can be minimizing. However, this study “Treatment 4” (T4: boiling + autoclave + enzyme hydrolysis) described the better conditions for total sugars and reducing sugars.
Pretreatment, enzyme hydrolysis effect and sugar concentration on scale up study
The ethanol yields depend on the type of microorganism employed and conditions for fermentation, including nutrients, oxygen, pH, and temperature, were used during the conversion of sugars (Ramaraj and Unpaprom 2019a, b). In this study, the best pretreatment method was adopted from earlier experiments (i.e., T4: boiling + autoclave + enzyme hydrolysis). For scale-up/big scale experiment, 1 kg dried waste jasmine flower was used. The concentration of total sugar and reducing sugar were 88.00 ± 9.74 g/L and 39.19 ± 7.14 g/L, respectively. Two types of fermentations studied were carried, including direct fermentation using free cell yeast and immobilized yeast. The solid was utilized from this experiment and reused (as a repeated batch system). There are two times involved: repeated batch, i.e. “reused 1st time immobilized yeast” and reused 2nd time immobilized. The concentrations of total sugar were 44.39 ± 4.59 g/L and 48.79 ± 2.78 g/L, respectively; subsequently, reducing sugars were 16.43 ± 1.74 g/L and 19.14 ± 0.89 g/L, respectively; the results were described in Table 2.
Table 2.
Sugar concentration before fermentation
| Before fermentation | The concentration of total sugar (g/L) | The concentration of reducing sugar (g/L) |
|---|---|---|
| Free cell | 88.00 ± 9.74 | 39.19 ± 7.14 |
| The 1st immobilized | 44.39 ± 4.59 | 16.43 ± 1.74 |
| The 2nd immobilized | 48.79 ± 2.78 | 19.14 ± 0.89 |
Scanning electron microscopy (SEM) structure of jasmine flower
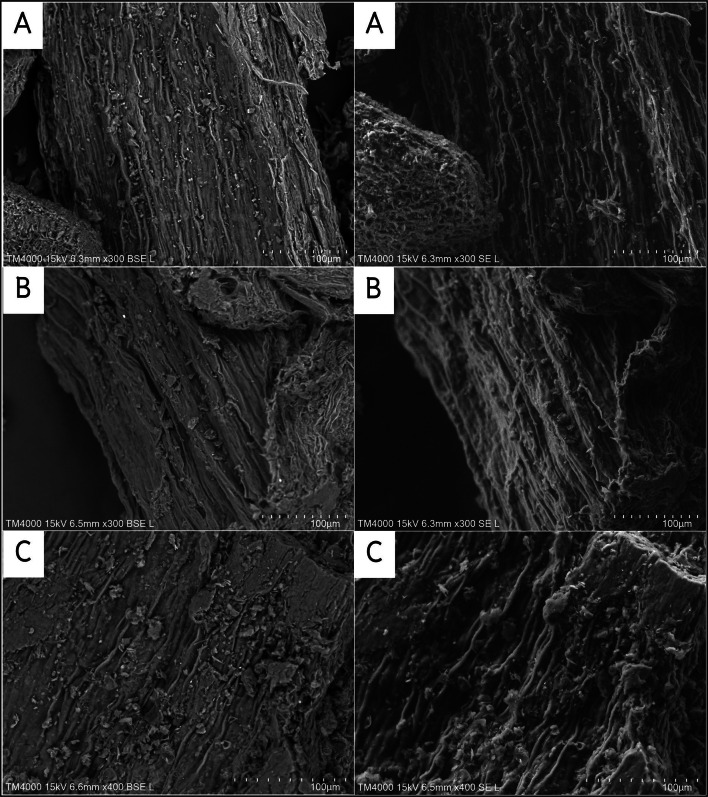
SEM micrographs of native, pretreated and delignified biomass are shown in Fig. 3. The pretreated and delignified biomass's SEM image shows quite variations in the surface topography compared to the native sample. The fascicular structures of untreated flower waste biomass were smooth and intact, forming a sealed shield. Large shallow gaps and lush characters were found after pretreatment, indicating that hemicellulose was partially destroyed. The SEM image of pretreated sample: jasmine powder: No pretreatment (3A), jasmine powder Treatment 4 [T4: boiling + autoclave pretreatment] (3B) and jasmine powder-residue Treatment 4 [T4: boiling + autoclave pretreatment] (3C) shows the formation of multiple pores on the surface. These pores exposure the internal structures and increase the surface area of the jasmine flower. Due to the effect of heat and pressure effect, enhance the separation of the petal surface.
Fig. 3.
Jasmine powder no pretreatment A, Jasmine powder Treatment 4 (T4: boiling + autoclave pretreatment B and Jasmine powder residue Treatment 4 (T4: boiling + autoclave pretreatment C
Bioethanol production using free cells yeast
Ethanol production from jasmine flowers using free cells yeast S. cerevisiae started in the log phase of the growth and maximum ethanol production was achieved during the stationary phase 48 h (Fig. 4). Total sugar and reducing initial sugar concentrations were 88.00 ± 9.74 g/L and 39.19 ± 7.14 g/L of free yeast cells. From 1st to 5th day fermentation, ethanol concentrations were 3.926 g/L, 14.394 g/L, 14.132 g/L, 13.085 g/L and 8.636 g/L, respectively. Conversely, the highest ethanol yield was 14.394 g/L observed at the 48 h’ fermentation. The concentrations of reducing sugar, 1st day to 5th days were 30.76 ± 2.84 g/L, 18.19 ± 0.59 g/L,19.19 ± 1.76 g/L,14.33 ± 2.84 g/L, and 12.57 ± 2.71 g/L, respectively. The sugar concentration is decreasing in reserve. It might also be due to utilization during fermentation for yeast's initial growth and metabolism and its conversion into ethanol (Vu et al. 2018). The concentrations of total sugar of 1st, 2nd, 3rd, 4th and 5th day were 55.19 ± 10.98 g/L, 54.53 ± 2.46 g/L, 47.56 ± 4.52 g/L,62.04 ± 6.58 g/L and 61.18 ± 7.36 g/L, respectively. Throughout the fermentation, the concentration of glucose was found to increase exponentially. Due to residual and yeast cell decomposition during fermentation, the glucose feeding rate is much greater than the glucose intake rate. Chang et al. (2018) also stated similar with our observation, due to excess in the glucose fermenter and it becomes a waste for the system.
Fig. 4.
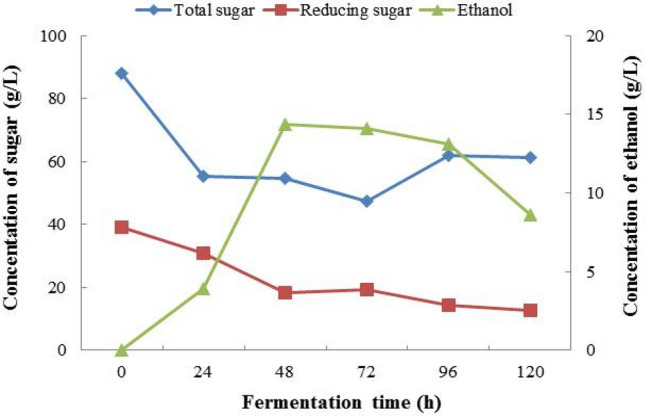
The 1st fermentation jasmine flowers (free cells yeast)
During 5th days’ fermentation, the bio-ethanol concentration gradually increasing along with the rises in pH and reaches a maximum percentage of bio-ethanol yield when pH is equal to 4 and later it starts decreasing due to the lesser activity of yeast. The highest concentration of ethanol uses free cell yeast at pH of 4.19. It was similar conditions which reported by Periyasamy et al. (2009) at pH of 4.2–4.5.
Bioethanol production using immobilization yeast ball
Ethanol production from waste jasmine flowers using immobilized yeast S. cerevisiae started in the log phase of the growth and maximum ethanol production was achieved during the stationary phase 72 h (Fig. 5). Before fermentation of 1st immobilized yeast ball substrate containing total sugar and reducing sugar, initial concentrations were 44.39 ± 4.59 g/L and 16.43 ± 1.74 g/L, respectively. During 5th fermentation, the ethanol concentration was 5.234 g/L, 8.374 g/L, 8.898 g/L, 6.019 g/L and 6.543 g/L, respectively. On the other hand, the highest ethanol yield was 8.898 g/L at 72 h’ fermentation. The concentrations of reducing sugar (1st day–5th day) were 8.24 ± 2.67 g/L, 6.52 ± 0.87 g/L, 6.29 ± 0.65 g/L, 7.10 ± 2.15 g/L and 9.71 ± 1.36 g/L, respectively.
Fig. 5.
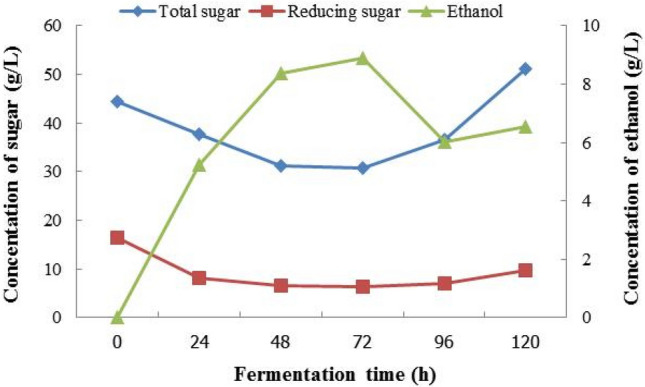
The 1st fermentation jasmine flowers (immobilized yeast ball)
The sugar concentration was gradually degreasing due to decreased sugar reserve due to utilization in part for initial growth and metabolism of S. cerevisiae and its conversion into ethanol (Behera et al. 2011). The concentrations of total sugar (1st day–5th day) were 37.66 ± 6.23 g/L, 31.30 ± 2.40 g/L, 30.74 ± 1.85 g/L, 36.53 ± 4.01 g/L, 51.07 ± 2.91 g/L, respectively. The concentration of glucose increased exponentially throughout the fermentation period, indicating that the amount of glucose released was much higher than the glucose intake rate. Consequently, there is an excess of glucose left in the fermenter, and it becomes a waste for the system.
The 1st immobilized yeast balls were separated after fermentation, and the residues were applied with the 2nd fermentation, which was studied 3 days continuously as a batch system. On the first day of the 2nd fermentation, total sugar and reducing initial sugar concentrations were 48.79 ± 2.78 g/L and 19.14 ± 0.89 g/L of 2nd immobilized yeast ball, respectively. During 3 days, the ethanol concentration was 4.972 g/L, 5.496 g/L and 7.066 g/L, respectively. On the contrary, the highest ethanol yield was 7.066 g/L detected at 72 h’ fermentation. The concentrations of reducing sugar were 17.19 ± 2.81 g/L, 15.86 ± 3.55 g/L and 9.57 ± 0.94 g/L, respectively. The total sugar concentrations were 37.71 ± 6.94 g/L, 37.43 ± 2.18 g/L and 30.04 ± 2.75 g/L, respectively, and the results were presented in Fig. 6.
Fig. 6.
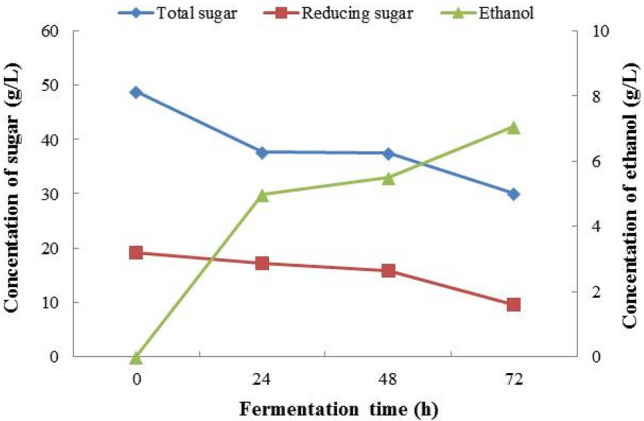
The 2nd fermentation jasmine flowers (immobilized yeast ball)
The ethanol concentration steadily rises with pH and reaches a maximum percentage of ethanol output when pH is equal to 4, after which it begins to decline due to yeast's lower activity. The comparable situations were observed the maximum ethanol productivity at pH of 4.2–4.5 (Periyasamy et al. 2009). The highest concentration of ethanol uses the 1st and 2nd immobilized yeast at pH of 3.78 and 3.58, respectively, when compared with free cells yeast found that the concentration of ethanol higher than the 1st and the 2nd immobilized yeast ball due to observing the maximum ethanol productivity at pH of 4.2–4.5 of free cells yeast.
Optimization of bioethanol production using responses surface methodology
For an optimum yield of reducing sugar during enzymatic scarification, response surface methodology (RSM) was used to investigate the process parameters' interaction effects: substrate concentration, enzyme loading, and surfactant concentration. In this study, we have been examined with reduction sugar, pH, time and ethanol production. Based on the preliminary experimental results, RSM and Box–Behnken design (BBD) were applied to optimize ethanol production conditions.
The Model F-value of 13.57 implies the model is significant. There is only a 0.12% chance that an F-value this large could occur due to noise.
P values less than 0.0500 indicate model terms are significant. In this case, A, C, C2 are significant model terms. Values greater than 0.1000 indicate the model terms are not significant. If there are many insignificant model terms (not counting those required to support hierarchy), model reduction may improve your model.
The Lack of Fit F-value of 2.73 implies the Lack of Fit is not significant relative to the pure error. There is a 17.81% chance that a "Lack of Fit F-value" this large could occur due to noise. Non-significant lack of fit is good; we want the model to fit.
Equation of op:
where Y: ethanol concentration (g/L), A: reducing sugar (g/L), B: pH, C: time (hours) (Tables 3, 4).
Table 3.
Summary of descriptive analysis of Jasmine flower
| Std. dev | 1.26 | R2 | 0.9458 |
| Mean | 8.07 | Adjusted R2 | 0.8761 |
| C.V. % | 15.58 | Predicted R2 | 0.3895 |
| Adeq precision | 12.0284 |
Table 4.
Factors selection of Jasmine flower
| Std | Run | A: reducing sugar | B: pH | C: time | Ethanol | Predicted value |
|---|---|---|---|---|---|---|
| 2 | 1 | 39 | 4 | 72 | 14.1318 | 13.27 |
| 5 | 2 | 12 | 4.8 | 24 | 2.5 | 1.66 |
| 3 | 3 | 12 | 5.6 | 72 | 5.4957 | 6.36 |
| 15 | 4 | 25.5 | 4.8 | 72 | 10.991 | 10.63 |
| 6 | 5 | 39 | 4.8 | 24 | 6.245 | 7.31 |
| 13 | 6 | 25.5 | 4.8 | 72 | 11.991 | 10.63 |
| 9 | 7 | 25.5 | 4 | 24 | 4.23 | 4.02 |
| 17 | 8 | 25.5 | 4.8 | 72 | 9.4212 | 10.63 |
| 11 | 9 | 25.5 | 4 | 120 | 7.234 | 7.26 |
| 16 | 10 | 25.5 | 4.8 | 72 | 10.521 | 10.63 |
| 12 | 11 | 25.5 | 5.6 | 120 | 5.495 | 5.70 |
| 14 | 12 | 25.5 | 4.8 | 72 | 10.2058 | 10.63 |
| 7 | 13 | 12 | 4.8 | 120 | 4.521 | 3.45 |
| 10 | 14 | 25.5 | 5.6 | 24 | 4.23 | 4.21 |
| 4 | 15 | 39 | 5.6 | 72 | 14.1318 | 13.09 |
| 1 | 16 | 12 | 4 | 72 | 6.4957 | 7.54 |
| 8 | 17 | 39 | 4.8 | 120 | 9.4212 | 10.26 |
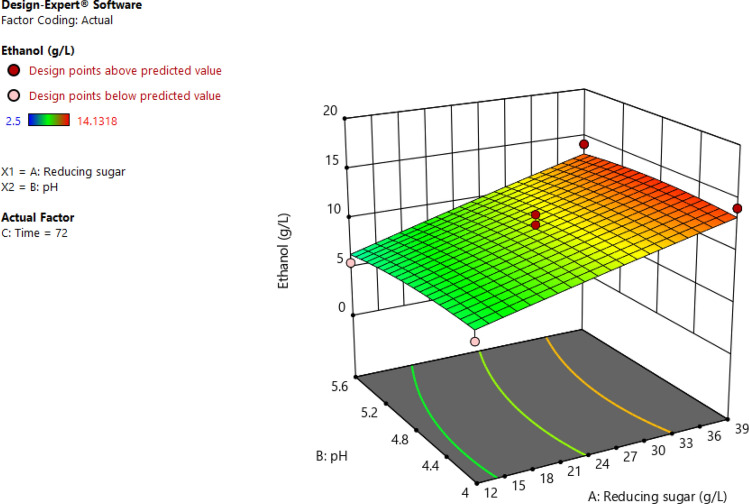
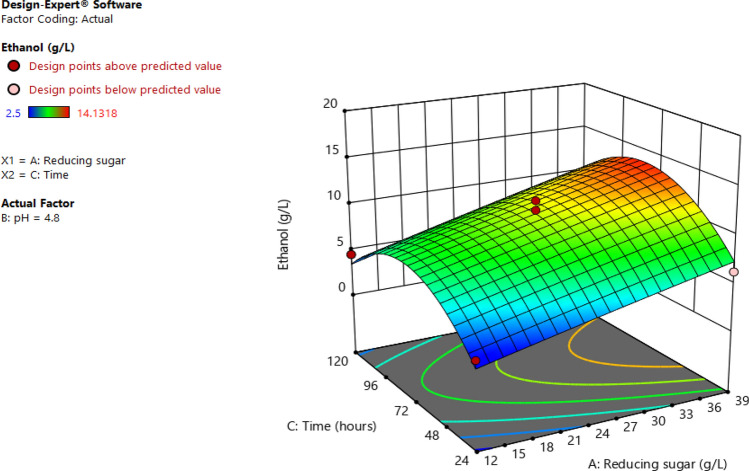
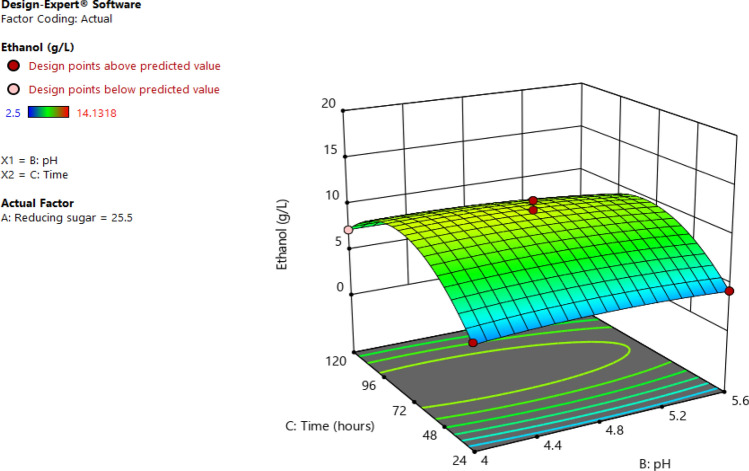
The interactive effects of independent factors on the response were performed with three-dimensional surface plots described in Fig. 7. It can be seen in Fig. 8 that an increase in reducing sugar concentration and pH leads to an increase in the amount of obtained ethanol. This can be supported by the positive value of the interaction coefficient (A and B) in Eq. Regarding the effects of time and reducing sugar on ethanol concentration, the maximum ethanol could be obtained at 39 g/L of reducing sugar for 72 h. While the higher the reducing sugar results higher obtained ethanol, the longer the time range leads to a decrease in response (Fig. 9). Figure 10 shows the interaction of pH with time on ethanol production. It was found that the effect of time was more significant than that of the pH.
Fig. 7.
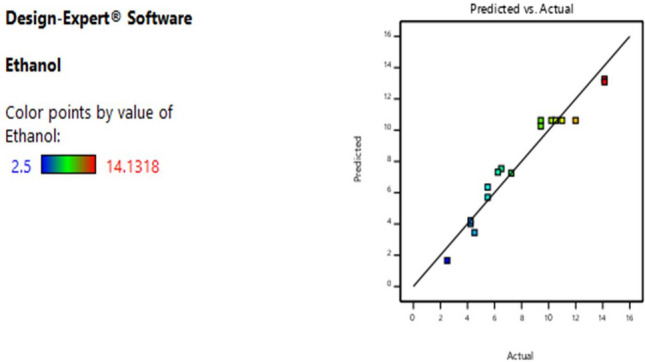
Comparison of predicted and actual value of ethanol yield
Fig. 8.
Response surface plots showing the interactive effect of reaction time and ethanol yield
Fig. 9.
Response surface plots for pH effect, reduction sugar and ethanol yield
Fig. 10.
Response contour plot of pH, time and concentration for bioethanol production
This study results from the initial weight, final weight, moisture content, sugar utilization, ethanol production, distillation, ethanol yield, and ethanol productivity are shown in Tables 5, 6, and 7. Table 5 listed the initial weight, final weight and moisture content of different flowers, including jasmine. Among all flowers, sunflower has the highest moisture content, whereas African wattle has the lowest. Nile tulip flower and Roselle have moisture content up to 80%. Finally, jasmine has comparable moisture content with sunflower. Table 6 shown the 5 days of fermentation using free cells yeast and the ethanol production of jasmine flower was 8.636 g/L. Similarly, Distillation (From final day fermentation) was 25.123 g/L.
Table 5.
Initial weight, final weight and moisture content of different flowers
| Substrate | Initial weight (kg) | Final weight (kg) | Moisture content (%) | References |
|---|---|---|---|---|
| Sunset flower | 0.584 | 0.052 | 91.00 | Ranjitha et al. (2014) |
| Nile tulip flower | 0.242 | 0.038 | 84.29 | |
| Roselle | 0.185 | 0.028 | 84.85 | |
| African wattle | 0.106 | 0.034 | 69.00 | |
| Jasmine | 1.000 | 0.092 | 90.84 | This study |
Table 6.
The 5 day of fermentation using immobilized yeast between jasmine
| Parameter | Free cell yeast | The 1st immobilized yeast | The 2nd immobilized yeast |
|---|---|---|---|
| Before fermentation | 39.190 | 16.429 | 19.143 |
| After fermentation | 12.571 | 9.714 | 9.571 |
| Sugar utilization (%) | 67.922 | 40.870 | 50.000 |
| Ethanol production (g/L) | 8.636 | 6.543 | 7.066 |
| Distillation (from final day fermentation) (g/L) | 25.123 | 31.404 | 21.198 |
Table 7.
The fermentation kinetics of immobilized yeast between jasmine and marigold
| Parameter | Free cell yeast | The 1st immobilized | The 2nd immobilized yeast |
|---|---|---|---|
| Ethanol production (g/L) | 14.394 | 8.898 | 7.066 |
| Ethanol yield (gethanol/gbiomass) | 0.029 | 0.018 | 0.014 |
| Sugar utilization (%) | 67.922 | 40.870 | 50.000 |
| Ethanol productivity (g/l–h) | 0.029 | 0.124 | 0.098 |
Table 6 shows that the 5-day fermentation using the 1st immobilized yeast jasmine found that the jasmine's sugar utilization was 40.870%. On the other hand, the 2nd immobilized yeast between jasmine found that jasmine sugar utilization was 50%. The ethanol production of the jasmine flower was 6.543 g/L and after distillation of jasmine was 31.404 g/L. Though ethanol productivity obtained with the 2nd immobilized yeast of jasmine flower was value 7.066 g/L and after distillation (from final day fermentation) of jasmine was higher 21.198 g/L.
The fermentation kinetics of free cell yeast on jasmine was studied (Table 7). The ethanol production obtained with free cells of jasmine was 14.394 g/, whereas, the ethanol yield, sugar utilization and ethanol productivity of jasmine were 0.029 gethanol/gbiomass, 67.922% and 0.029 g/l-h, respectively. The fermentation kinetics of immobilized yeast between jasmine and marigold were studied (Table 7). The ethanol production was obtained with the 1st immobilized yeast of jasmine (8.898 g/L). Likewise, the ethanol yield, sugar utilization and ethanol productivity of jasmine were 0.018 gethanol/gbiomass, 40.870% and 0.124 g/l-h, respectively. The immobilized yeast cells were further recycled for second times, that shown in Table 7. The ethanol production and ethanol productivity obtained with the 2nd immobilized yeast of jasmine flower were 7.066 g/L and 0.098 g/l-h. The ethanol yield of jasmine was 0.014 gethanol/gbiomass, whereas the jasmine sugar utilization was 50% higher. The usefulness of using a 2nd generation biomass, such as waste jasmine flower, which is actually also waste biomass, was exposed to be promising in this research. However, huge capital and maintenance costs are the key constraints to the long-term feasibility of using 2nd generation biomasses for ethanol production. It is also significant to remember that the intangible returns from waste biomass usage should be valued.
Conclusions
In this study, Jasminum sambac (Jasmine) flower wastes were examined for bioethanol production. Solar dryer used for raw material drying as a renewable resource application. Chemical pretreatment of jasmine flowers tested by alkaline solution. Pretreatment, also thermal pretreatment, was studied by traditional and scientific autoclaves. After pretreatments, the substrates were verified with SEM to confirm the structural characterization of the cell wall. Significant differences in the sugar-release patterns were observed, thermal pretreatment producing high quantities of sugars. After that, enzyme hydrolysis was used to extract even more sugars from the substrate. SHF fermentation was approached in two ways: liquid and solid. Fermentation of free cell yeast and immobilized yeast ball was used for efficiency of ethanol yield consideration. The applied science and engineering models RSM and BBD have confirmed the optimization of the ethanol production process. Thus, the utilization of flower wastes biomass for bioethanol production necessitates the production technology to be cost-effective and environmentally sustainable.
Acknowledgements
The authors would like to thank the program in Biotechology, School of Renewable Energy, Energy Research center, Maejo University, Thailand for providing the necessary facilities to complete the present work. The authors would also like to thank Mrs. Sawitree Tipanee for the laboratory management of the manuscript.
Declarations
Conflict of interest
The authors declare that they have no conflict of interest in the publication.
References
- Azhar SHM, Abdulla R, Jambo SA, Marbawi H, Gansau JA, Faik AA, Rodrigues KF. Yeasts in sustainable bioethanol production: a review. Biochem Biophys Rep. 2017;1(10):52–61. doi: 10.1016/j.bbrep.2017.03.003. [DOI] [PMC free article] [PubMed] [Google Scholar]
- Balat M. Production of bioethanol from lignocellulosic materials via the biochemical pathway: a review. Energy Convers Manag. 2011;52:858–875. doi: 10.1016/j.enconman.2010.08.013. [DOI] [Google Scholar]
- Behera S, Mohanty RC, Ray RC. Ethanol production from mahula (Madhuca latifolia L.) flowers with immobilized cells of Saccharomyces cerevisiae in Luffa cylindrica L. sponge discs. Appl Energy. 2011;88(1):212–215. doi: 10.1016/j.apenergy.2010.07.035. [DOI] [Google Scholar]
- Chang YH, Chang KS, Chen CY, Hsu CL, Chang TC, Jang HD. Enhancement of the efficiency of bioethanol production by Saccharomyces cerevisiae via gradually batch-wise and fed-batch increasing the glucose concentration. Fermentation. 2018;4(2):45. doi: 10.3390/fermentation4020045. [DOI] [Google Scholar]
- Dubois M, Gilles KA, Hamilton JK, Rebers PA, Smith F. Colorimetric method for determination of sugars and related substances. Anal Chem. 1956;28(3):350–356. doi: 10.1021/ac60111a017. [DOI] [Google Scholar]
- Hu G, Heitmann JA, Rojas OJ. Feedstock pretreatment strategies for producing ethanol from wood, bark and forest residues. BioResources. 2008;3:270–294. [Google Scholar]
- Mejica GFC, Unpaprom Y, Whangchai K, Ramaraj R. Cellulosic-derived bioethanol from Limnocharis flava utilizing alkaline pretreatment. Biomass Convers Biorefin. 2021 doi: 10.1007/s13399-020-01218-7. [DOI] [Google Scholar]
- Miller G. Use of dinitrosalicylic acid reagent for determination of reducing sugar. Anal Chem. 1959;31(3):426–428. doi: 10.1021/ac60147a030. [DOI] [Google Scholar]
- Nguyen TVT, Unpaprom Y, Tandee K, Whangchai K, Ramaraj R. Physical pretreatment and algal enzyme hydrolysis of dried low-grade and waste longan fruits to enhance its fermentable sugar production. Biomass Convers Biorefin. 2020 doi: 10.1007/s13399-020-01176-0. [DOI] [Google Scholar]
- Nguyen TV, Unpaprom Y, Manmai N, Whangchai K, Ramaraj R. Impact and significance of pretreatment on the fermentable sugar production from low-grade longan fruit wastes for bioethanol production. Biomass Convers Biorefin. 2020 doi: 10.1007/s13399-020-00977-7. [DOI] [Google Scholar]
- Nong HT, Whangchai K, Unpaprom Y, Thararux C, Ramaraj R. Development of sustainable approaches for converting the agroweeds Ludwigia hyssopifolia to biogas production. Biomass Convers Biorefin. 2020 doi: 10.1007/s13399-020-01083-47. [DOI] [Google Scholar]
- Nong HTT, Unpaprom Y, Whangchai K, Buochareon S, Ramaraj R. Assessment of the effects of anaerobic co-digestion of water primrose and cow dung with swine manure on biogas yield and biodegradability. Biomass Convers Biorefin. 2020 doi: 10.1007/s13399-020-01115-z. [DOI] [Google Scholar]
- Periyasamy S, Venkatachalam S, Ramasamy S, Srinivasan V. Production of bio-ethanol from sugar molasses using Saccharomyces cerevisiae. Mod Appl Sci. 2009;3(8):32–37. doi: 10.3390/ijms9091621. [DOI] [Google Scholar]
- Ramaraj R, Unpaprom Y. Optimization of pretreatment condition for ethanol production from Cyperus difformis by response surface methodology. 3 Biotech. 2019;9:218. doi: 10.1007/s13205-019-1754-0. [DOI] [PMC free article] [PubMed] [Google Scholar]
- Ramaraj R, Unpaprom Y. Enzymatic hydrolysis of small-flowered nutsedge (Cyperus difformis) with alkaline pretreatment for bioethanol production. Maejo Int J Sci Technol. 2019;13(2):110–120. [Google Scholar]
- Ranjitha J, Vijayalakshmi S, Vijaya Kumar P, Nitin Ralph P. Production of bio-gas from flowers and vegetable wastes using anaerobic digestion. Int J Res Eng Technol. 2014;3:279–283. [Google Scholar]
- Sabharwal S, Sudan S, Ranjan V. Jasminum sambac linn (motia): a review. Int J Pharm Bio Sci. 2013;2(5):108–130. [Google Scholar]
- Sophanodorn K, Unpaprom Y, Whangchai K, Duangsuphasin A, Manmai N, Ramaraj R. A biorefinery approach for the production of bioethanol from alkaline-pretreated, enzymatically hydrolyzed Nicotiana tabacum stalks as feedstock for the bio-based industry. Biomass Convers Biorefin. 2020 doi: 10.1007/s13399-020-01177-z. [DOI] [Google Scholar]
- Taherzadeh MJ, Karimi K. Pretreatment of lignocellulosic wastes to improve ethanol and biogas production: a review. Int J Mol Sci. 2008;9:1621–1651. doi: 10.3390/ijms9091621. [DOI] [PMC free article] [PubMed] [Google Scholar]
- Unpaprom Y, Ramaraj R, Whangchai K. A newly isolated green alga, Scenedesmus acuminatus, from Thailand with efficient hydrogen production. Chiang Mai J Sci. 2017;44:1270–1278. [Google Scholar]
- Vu PT, Unpaprom Y, Ramaraj R. Evaluation of bioethanol production from rice field weed biomass. Emerg Life Sci Res. 2017;3:42–49. doi: 10.7324/ELSR.2017.324249. [DOI] [Google Scholar]
- Vu PT, Unpaprom Y, Ramaraj R. Impact and significance of alkaline-oxidant pretreatment on the enzymatic digestibility of Sphenoclea zeylanica for bioethanol production. Bioresour Technol. 2018;247:125–130. doi: 10.1016/j.biortech.2017.09.012. [DOI] [PubMed] [Google Scholar]
- Wannapokin A, Ramaraj R, Unpaprom Y. An investigation of biogas production potential from fallen teak leaves (Tectona grandis) Emer Life Sci Res. 2017;3:1–10. doi: 10.7324/ELSR.2017.31110. [DOI] [Google Scholar]
- Wannapokin A, Ramaraj R, Whangchai K. Unpaprom Y (2018) Potential improvement of biogas production from fallen teak leaves with co-digestion of microalgae. 3 Biotech. 2018;8(2):1–8. doi: 10.1007/s13205-018-1084-7. [DOI] [PMC free article] [PubMed] [Google Scholar]
- Wolff D. Nectar sugar composition and volumes of 47 species of Gentianales from a southern Ecuadorian Montane forest. Ann Bot. 2006;97(5):767–777. doi: 10.1093/aob/mcl033. [DOI] [PMC free article] [PubMed] [Google Scholar]
- Yadav I, Juneja SK, Chauhan S. Temple waste utilization and management: a review. Int J Eng Technol Sci Res. 2015;2:14–19. [Google Scholar]


