

Abstract
BACKGROUND AND PURPOSE:
The pathophysiology of eRLS has not yet been elucidated. The purpose of the study was to assess, in patients with eRLS, the volume, iron content, and activation of the brain during night-time episodes of SLD and PLMs.
MATERIALS AND METHODS:
Eleven right-handed unmedicated patients with eRLS (mean age, 55.3 ± 8.4 years; disease duration, 17.5 ± 14.05 years) and 11 matched control subjects were studied with a T1-weighted high-resolution 3D spoiled gradient-echo sequence used for VBM and a multisection spin-echo T2-weighted sequence used for T2 relaxometry. Additionally, a single-shot multisection gradient echo-planar sequence was used for fMRI. Brain activation was recorded during spontaneous SLD and PLMs. SPM software was used for analysis of the functional data.
RESULTS:
The patients showed no regional brain volume change, but T2 relaxometry revealed decreased T2 relaxation time in the right globus pallidus internal and the STN, indicating increased iron content. The patients were observed to activate the following areas: in the left hemisphere, the primary motor and somatosensory cortex, the thalamus, the pars opercularis, and the ventral anterior cingulum; and in the right hemisphere, the striatum, the inferior and superior parietal lobules, and the dorsolateral prefrontal cortex. Bilateral activation was observed in the cerebellum, the midbrain, and the pons.
CONCLUSIONS:
eRLS is associated with increased iron content of the globus pallidus internal and STN, suggesting dysfunction of the basal ganglia. Activation of the striatofrontolimbic area may represent the neurofunctional substrate mediating the repetitive compulsive movements seen in RLS.
RLS is a common sensorimotor disorder in which sensory unease evokes motor restlessness of the lower limbs. The symptoms, SLD and PLMs, fluctuate in severity with the diurnal cycle, worsening during the night-time hours.1
RLS encompasses eRLS, which is mainly idiopathic, and late-onset RLS, which is usually a secondary form.2 eRLS affects younger patients with a positive family history and has been correlated with a gene variant (btbd9) that is associated with iron content in the midbrain.3 Histopathologic studies in idiopathic RLS have shown decreased iron staining in the substantia nigra and minimal transferrin-receptor staining in neuromelanin cells.4 MR imaging studies by using T2 relaxometry metrics have shown a lower iron content of the substantia nigra in eRLS5 and late-onset RLS.6
With VBM, the brain volume has been assessed in patients with RLS, with conflicting findings. Small sample size, use of different techniques, inclusion of patients under medication, and lack of distinction between eRLS and late-onset RLS were probably responsible for the inconsistency in observations.7–9
fMRI studies have been conducted in patients with RLS with undefined disease onset10 and late onset.6 fMRI during episodes of combined sensory and motor symptoms has revealed activity in the cerebellum, red nucleus, and thalamus.10 Patients with late-onset RLS performing regular dorsiflexion and plantar flexion of the feet in hours of daylight demonstrated greater activation of the dorsolateral prefrontal cortex of the left middle gyrus and inferior frontal gyrus and, marginally, of the cingulate gyrus.6 Although VBM, T2 relaxometry, and fMRI have all been used in the study of patients with RLS, the 3 techniques have never been applied simultaneously in the same patient population. T2 relaxometry detects ultrastructural tissue changes by decline of the transverse component of the magnetization due to irreversible dephasing; it is influenced by water content, cerebral blood flow, and iron deposition.11 VBM is an automated technique which, by using voxelwise statistical analysis, detects brain-volume differences with no a priori assumptions about their location.12 fMRI evaluates brain function by detection of hemodynamic changes related to brain activation.13 Evaluation of the same eRLS population for brain volume changes, brain iron content, and brain activation during episodes of RLS symptoms could provide improved insight into the pathophysiology of the disease. In this study, patients with unmedicated eRLS were assessed by brain MR imaging by using VBM and T2 relaxometry metrics to analyze brain volume and T2 relaxation time, respectively. fMRI was performed in the night hours during episodes of exacerbation of symptoms.
Materials and Methods
The study included 11 right-handed patients with idiopathic eRLS who had never been treated with dopaminergic agents (9 women, 2 men; range, 48–70 years of age; mean 55.3 ± 8.4 years; mean disease duration, 17.5 ± 14.05 years) and 11 sex- and age-matched right-handed control subjects (9 women, 2 men; range, 42–73 years of age; mean, 56.09 ± 9.6 years) with no symptoms of RLS. All the study patients with RLS had early disease onset, with symptoms starting before 45 years of age. Lateralization of the symptoms was not reported by any of the patients. The patients underwent a detailed history survey, physical examination, laboratory tests (routine biochemistry including thyroid function, vitamins, and electrolytes) and nerve-conduction studies (electromyography). Their condition was confirmed to match the revised essential criteria for the diagnosis of idiopathic RLS defined by the International Restless Legs Syndrome Study Group with supportive diagnostic criteria.14 These criteria include the urge to move the legs accompanied by SLD, worsening of symptoms during periods of rest, partial or total relief during PLMs, and a circadian rhythm of the symptoms.14 The supportive diagnostic criteria used were the presence of sleep disturbance and the occurrence of PLMs,15 which were based on the patient history survey because a polysomnographic study was not performed. The severity of RLS was estimated by using the IRLS, resulting in a value of 18.4 ± 4.8 (range, 12–26) indicating moderate severity of symptoms. The IRLS consists of a set of 10 questions based on the following: 1) features of RLS, including intensity (5 items), 2) frequency of the symptoms (1 item), and 3) consequences of RLS (ie, sleep quality, daytime fatigue, mood, and quality of life).14 Serum ferritin levels measured on the day of the MR imaging were within normal values for all participants.
The study received institutional board approval, and written consent was obtained from all subjects.
Imaging Protocol
Imaging was performed during the night hours, starting from 9:00 pm. MR imaging data were acquired by using a 1.5T scanner (Intera; Philips Medical Systems, Best, the Netherlands). The imaging protocol in both patients and controls consisted of the following: 1) a T1-weighted high-resolution (0.86 × 0.86 × 1 mm) 3D spoiled gradient-echo sequence (TR/TE, 25/4.6 ms), which was used for structural imaging; 2) a multisection spin-echo T2-weighted sequence (TR, 2200 ms; TE, 16 values between 32 and 112 ms; section thickness, 5 mm; gap, 0.5 mm), which was used for T2 relaxometry. Additionally, patients were examined with a single-shot multisection gradient EPI, which was used for BOLD functional images (TR/TE, 3000/50 ms; flip angle, 40°; matrix, 64 × 64; section thickness, 5 mm; gap, 0 mm). Each fMRI session consisted of 160 scans and lasted 480 seconds. At the beginning of each session, 4 dummy scans were acquired to allow equilibration of magnetization. The head of the subject was restrained by using cushions to minimize motion artifacts, and the patients were advised to keep their eyes closed during the examination so as to minimize potential visual stimuli. Patients were awake during the examination, and they were instructed to remain still and avoid voluntary movements. The fMRI paradigm was self-evoked event-related, and the PLMs during wakefulness were monitored throughout the examination. These consisted of random active asymmetric (out-of-phase) self-initiated movements of the feet, either at the metatarsophalangeal joints or the ankle to relieve their familiar uncomfortable sensations related to the RLS. The PLMs were recorded in real-time by a technologist with direct visual contact with the patient by using Lumina LP-400 patient response system and SuperLab 4.0 stimulus presentation software (Cedrus Corporation, San Pedro, California). The latency (ie, is the time between the initiation of the study and the first PLM) was calculated. This fMRI paradigm was customized to assess brain activity during RLS episodes and is not applicable to healthy control subjects.
Image Analysis and Statistical Analysis
The VBM method by using the unified segmentation approach16 was implemented by using the T1-weighted images. A scanner-specific template of GM, WM, and CSF compartments was constructed on measurements of 24 healthy subjects (12 women, 12 men; mean age, 58.9 ± 10.6 years). VBM involved simultaneous normalization of all images according to the scanner-specific template: correction for intensity inhomogeneity and segmentation of GM, WM, and CSF compartments. Morphologic differences between the patients with eRLS and control subjects were estimated by using an independent-samples t test at the voxel level. Comparison between patients and control subjects was made for 2 different contrasts corresponding to increase (eRLS > controls) or decrease (eRLS < controls) of brain volume in the GM and WM compartments. The statistical parametric maps were thresholded by using a false discovery rate at P < .05, corrected for multiple comparisons.
T2 relaxometry images were processed off-line by using Matlab 7.6 (MathWorks, Natick, Massachusetts). A monoexponential function of the form S(TE) = So * exp(−TE/T2) + C was assumed to describe the signal-intensity decay with TE, where S(TE) is the signal intensity at TE, So is the signal-intensity amplitude at TE = 0, and C is a constant offset parameter added to compensate for background noise bias. A T2 map was produced by a pixel-by-pixel fitting procedure, by using the Levenberg-Marquardt optimization method.6 The T2 relaxation time of the putamen, caudate nucleus, globus pallidus external and internal substantia nigra pars compacta and reticulata, STN, red nucleus, and locus coeruleus was measured by using the region-of-interest function by a method previously described.6,17,18 To check for inter-rater agreement, a second researcher (M.I.A.) performed T2 relaxation time measurements and used the Pearson product-moment correlation coefficient. A P value <.05 was considered statistically significant. Differences in the T2 relaxation times between patients and control subjects were evaluated by using the unpaired 2-tailed Student t test.
fMRI data preprocessing was performed by using Matlab 7.6 (MathWorks) and SPM software (SPM5, Wellcome Department of Cognitive Neurology, London, UK). EPI images were realigned both spatially to minimize residual head movement and temporally to ensure that the data from any given section were sampled at the same time. The images were then coregistered with the high-resolution anatomic image, normalized with the MNI template, and smoothed by using a Gaussian kernel of 8 × 8 × 8 mm. The monitored PLMs of each patient were modeled in the first-level analysis. Second-level random-effects analysis was used to determine activated areas within the group, and an activation map was generated. Motor-activated regions were derived at a significance level of uncorrected P < .001, with an extent threshold of 10 voxels. The regions (clusters) that were activated and their laterality were identified registering the Talairach coordinates of the SPM maps to the WFU PickAtlas toolbox, an automated method for neuroanatomic and cytoarchitectonic atlas-based interrogation of fMRI datasets. (WFU PickAtlas, Version 2.0, http://dbic.dartmouth.edu/pipermail/mrusers/attachments/20050923/d4ae1062/attachment.pdf).19 Potential atlas-induced errors were checked by visual estimation on the T1 MNI template of the regions of the final activation clusters and comparison with the WFU PickAtlas regions, which resulted in a high level of agreement. The activation parameters computed were the size and the maximum z score of the activated regions and the corresponding P values. Multiple linear regression analysis by using SPM5 was conducted to determine whether age and disease duration were significant predictors of brain activation. A P value of <.001 with a cluster threshold of 10 voxels was considered statistically significant.
Results
T1- and T2-weighted images showed no structural abnormality of the brain in any subject. VBM analysis revealed no significant differences in brain volume between patients and control subjects.
The Pearson correlation coefficient of the raters' T2 measurements was 0.95, indicating strong inter-rater agreement. The T2 relaxation time was significantly lower in patients with eRLS than in the control subjects in the right STN (patients, 98.85 ± 5.07; controls, 108.71 ± 5.59; P = .007) and in the right globus pallidus internal (patients, 95.19 ± 6.15; controls, 105.42 ± 7.12; P = .019).
During the fMRI examination, a mean of 5.2 ± 2.6 PLMs per patient was recorded, lasting 191 ± 182 seconds with a latency of 169 ± 108 seconds. No unilateral movement was observed. Significant activation was observed in the left hemisphere in the precentral gyrus, the posterior central gyrus, the thalamus, the pars opercularis, and the ventral anterior cingulum; and in the right hemisphere in the caudate body, the inferior and superior parietal lobules, the putamen, and the dorsolateral prefrontal cortex. Significant bilateral activation was observed in the cerebellum, the midbrain, and the pons (Table and Fig 1).
Results of fMRI group analysis in patients with eRLSa
| Region | Number of Voxels | Talairach Coordinates |
P Value | ||
|---|---|---|---|---|---|
| X | Y | Z | |||
| Caudate body (R) | 15 | 10 | 0 | 14 | 16.5 × 10⁻⁵ |
| Inferior parietal lobule (R) | 58 | 50 | −38 | 54 | 12.6 × 10⁻⁵ |
| Superior parietal lobule (R) | 13 | 28 | −72 | 48 | 11.7 × 10⁻⁵ |
| Thalamus (L) | 16 | −6 | −16 | 14 | 9.6 × 10⁻⁵ |
| Pars opercularis (L) | 136 | −56 | 12 | 12 | 5.9 × 10⁻⁵ |
| Putamen (R) | 53 | 26 | −6 | 14 | 5.6 × 10⁻⁵ |
| Cerebellum (R) | 46 | 36 | −44 | −32 | 4.2 × 10⁻⁵ |
| Ventral anterior cingulum (L) | 119 | −4 | −8 | 44 | 3.4 × 10⁻⁵ |
| Midbrain (L) | 28 | −10 | −26 | −8 | 3.2 × 10⁻⁵ |
| Parietal lobe (R) | 13 | 28 | −72 | 48 | 3 × 10⁻⁵ |
| Pons (L) | 61 | −18 | −40 | −32 | 2.8 × 10⁻⁵ |
| Cerebellum (L) | 101 | −38 | −62 | −32 | 2.8 × 10⁻⁵ |
| Dorsolateral prefrontal cortex (R) | 31 | 16 | 50 | 34 | 2 × 10⁻⁵ |
| Posterior central gyrus (L) | 209 | −2 | −24 | 76 | 9 × 10⁻⁶ |
| Precentral gyrus (L) | 51 | 42 | −18 | 58 | 5.04 × 10⁻⁷ |
Note: —R indicates right, L, Left.
Activated regions are presented in descending P values. P values and Talairach coordinates correspond to the voxel of maximum activation within each brain region.
Fig 1.
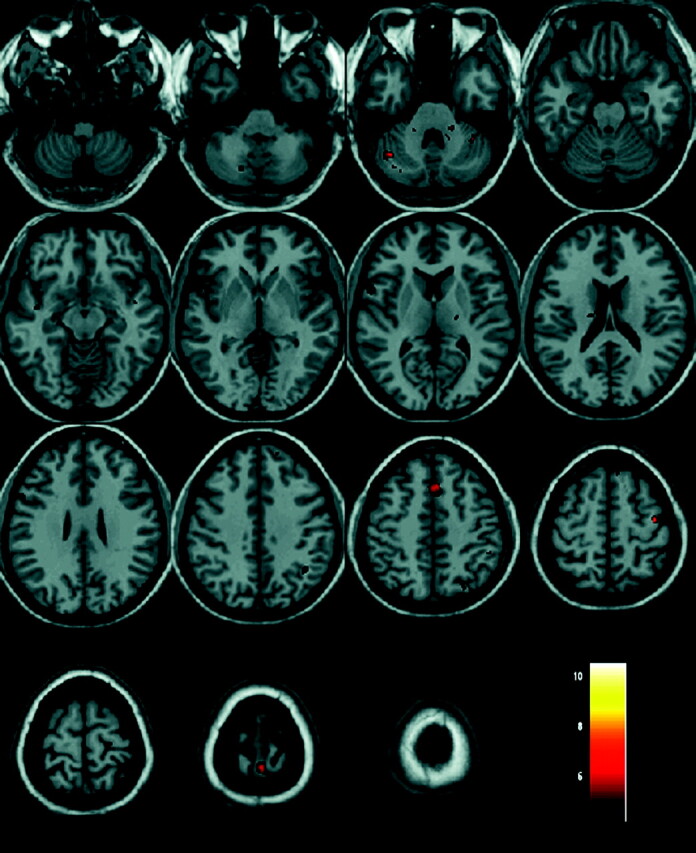
Results of fMRI analysis in a group of 11 patients with eRLS. Activated regions are depicted with color on a high-resolution T1-weighted image normalized to the MNI template.
Regression analysis by using disease duration as a covariant showed a positive relationship between the activation in the thalamus and the age of the patient.
Discussion
The major findings of this study in patients with eRLS were absence of changes in brain volume, increased iron content in the right globus pallidus internal and the STN, and observation on fMRI of increased activation in the right hemisphere of the striatum, the parietal lobule, and the dorsolateral prefrontal cortex; and in the left hemisphere of the precentral gyrus, the postcentral gyrus, the pars opercularis, the thalamus, and the ventral anterior cingulum.
VBM techniques have been previously applied in patients with RLS with conflicting results.7–9,20,21 An increase in the volume of the thalamus was reported in 1 study performed on 2 independent RLS series,8 and a decrease in the volume of the primary somatosensory and primary motor cortex was reported in a second study.7 GM volume changes have been demonstrated in patients treated with medications affecting the dopamine system; thus, brain volume changes in patients with RLS under medication may represent a secondary pharmacologic effect on brain plasticity.21–24 Marginally significant GM volume changes have been reported in only 1 study of unmedicated patients.9 In agreement with the present study, 2 earlier studies performed on unmedicated patients with RLS revealed no significant volume change in comparison with control subjects.20,21
There is evidence that brain iron content plays an important role in the pathophysiology of RLS.25,26 Postmortem studies have demonstrated low iron content in the substantia nigra of patients with eRLS who received treatment with dopaminergic drugs.4,27 In the present study, by using a spin-echo technique, the T2 relaxation time of the substantia nigra pars compacta and reticulata was evaluated separately, and no significant difference was found between the patients with untreated eRLS and control subjects. Gradient-echo sequences are more sensitive in detecting iron; thus, measurement of T2* relaxation time might be more efficient in detecting differences in tissue iron content.28 Nevertheless, in practice, T2* and T2′ are more prone to artifacts and T2* is more dependent on factors unrelated to iron, such as susceptibility artifacts and the BOLD effect.29 Treatment-induced changes may account for the differences observed in the other studies. Indeed experimental studies have demonstrated that treatment with dopaminergic drugs may affect neuronal viability and iron content.30 The present study is the first to demonstrate decreased T2 relaxation times, suggestive of increased iron content in the globus pallidus internal and the STN of patients with RLS. Secondary RLS has been associated with low serum ferritin levels.31 This is not in contradiction with the results of the current study because ferritin does not cross the blood-brain barrier; therefore, its serum levels are not a good index of brain iron burden.18,32
Although iron is critical in brain metabolism, increased iron deposition occurs in brain areas undergoing degeneration.9,17,33 According to the currently accepted model of functional neuroanatomy, the globus pallidus external, through excitatory D2 receptors, receives GABAergic inhibitory projections from the striatum, and the STN receives GABAergic inhibitory projections from the globus pallidus external and strong excitatory glutamatergic afferents from the motor cortex.34 Hypofunctioning in brain dopamine signaling is currently accepted as a characteristic in patients with RLS.25 Dopamine is a catecholamine neurotransmitter exhibiting a circadian rhythm of signaling with a nadir in the night hours.35 A hypothetic explanation is that patients with RLS may present with night hypofunctioning of the dopamine signaling in the basal ganglia circuitry, which may induce subnormal activation of the D2 receptors of the striatum, resulting in increased activation of the latter. An increase of the GABAergic inhibitory projection from the striatum to the globus pallidus external may be followed by a decrease of the GABAergic inhibitory projection from the globus pallidus external to the STN, which additionally continues to receive excitatory drive from the cortex.36,37 This may lead to hyperfunctioning of the STN, excitotoxic injury of its neurons, generation of free radicals, and increased iron deposition.6
Hyperfunctioning may be responsible for the increased iron in the STN but also for increased iron in the globus pallidus internal. Hyperfunctioning and excitotoxic injury may result from increased glutamatergic excitatory projection that the globus pallidus internal receives from a hyperfunctioning STN. The implication of STN and globus pallidus internal in the development of RLS has been raised in 3 previous studies.38–40 DBS of the globus pallidus internal in a patient with generalized dystonia and RLS resulted in resolution of the sensory-motor RLS symptoms.38 DBS of the STN in patients with Parkinson disease resulted in the development of RLS symptoms early after surgery39 and in improvement of RLS symptoms late after surgery.40 High-frequency DBS mimics the effects of ablation by producing functional inhibition.41 According to the data of the present study, increased iron content of the STN and the globus pallidus internal may be present in patients with eRLS; thus, DBS of these areas could possibly provide relief from RLS symptoms.
The lateralization of the abnormal T2 shortening of the basal ganglia regions that was observed may correspond to a primary right to left gradient of dopamine dysfunction during the initial stage of the disease, although later the disease manifests by bilateral limb movements. Lateralization is not uncommon in neurodegenerative diseases such as Parkinson disease42 and corticobasal degeneration.43 Lateralization was also observed in the present whole-brain fMRI study performed at the peak of sensory and motor symptoms. To the best of our knowledge, this is the first study showing a relation of the repetitive compulsive movements seen in RLS with this striatofrontolimbic circuitry. This system is known to be involved in motivated behaviors and the induction of self-generated repetitive and/or compulsive actions.37 Additionally, the ventral anterior cingulum is a region that is associated with emotion processing, drug dependence, and control of chronic pain.44 Dysfunction of the basal ganglia expressed as increased iron content in the globus pallidus internal and the STN may indirectly activate this circuitry. This activation may reflect compensatory changes as a result of basal ganglia dysfunction or a priming of its neurons, which might induce PLMs as a conditioned response to provide temporary relief of the endogenous unpleasant sensations described by patients with RLS.
Activation was observed in the left primary motor and somatosensory cortex. PLMs are active periodic movements, and the pattern of brain activation resembles that reported during dorsiflexion—plantar flexion of the foot.33 In agreement with the present study, a previous fMRI study performed on patients with RLS during combined PLMs and SLD demonstrated activation of the thalamus.10 The thalamus is an intermediate gateway for sensory input according to cognitive requirements.45 SPECT evaluation of RLS demonstrated increased blood flow of the thalami with increasing pain.46 Increased sensory load during peak intensity of RLS symptoms provides increased input to the thalamus. In this study, a positive correlation was found between the age of the patient and the degree of activation of the thalamus. Elderly individuals present reduced dopamine D2 receptor availability in the striatum, which lowers their threshold for inhibition and toleration of discomfort and pain.47
The left pars opercularis has been previously suggested to maintain and establish a task-set switching and is active during alternating movements.33 The inability of patients with RLS to control their PLMs is consistent with a weak endogenous control, which may be associated with activation of the left pars opercularis.
Conclusions
This study has demonstrated that eRLS is not associated with brain-volume changes but with increased iron content in the globus pallidus internal and STN, suggestive of a dysfunction of the basal ganglia circuitry. The observed activation of the striatofrontolimbic circuitry may indicate the neurofunctional substrate mediating the repetitive compulsive movements seen in RLS.
ABBREVIATIONS:
- BOLD
blood oxygen level–dependent
- DBS
deep brain stimulation
- eRLS
early-onset restless legs syndrome
- GABA
gamma-aminobutyric acid
- GM
gray matter
- IRLS
International Restless Legs Severity Scale
- MNI
Montreal Neurological Institute
- PLM
periodic limb movements
- RLS
restless legs syndrome
- SLD
sensory leg discomfort
- SPM
statistical parametric mapping
- STN
subthalamic nucleus
- VBM
voxel-based morphometry
References
- 1. Garcia-Borreguero D. Time to REST: epidemiology and burden. Eur J Neurol 2006;13: 15–20 [DOI] [PubMed] [Google Scholar]
- 2. Paulus W, Dowling P, Rijman R, et al. Update of the pathophysiology of the restless-legs-syndrome. Mov Disord 2007;22: S431–39 [DOI] [PubMed] [Google Scholar]
- 3. Jellen LC, Beard JL, Jones BC. Systems genetics analysis of iron regulation in the brain. Biochimie 2009;91: 1255–59 [DOI] [PMC free article] [PubMed] [Google Scholar]
- 4. Connor JR, Boyer PJ, Menzies SL, et al. Neuropathological examination suggests impaired brain iron acquisition in restless legs syndrome. Neurology 2003;61: 304–09 [DOI] [PubMed] [Google Scholar]
- 5. Earley CJ, B Barker P, Horská A, et al. MRI-determined regional brain iron concentrations in early- and late-onset restless legs syndrome. Sleep Med 2006;7: 458–61. Epub 2006 Jun 5 [DOI] [PubMed] [Google Scholar]
- 6. Astrakas LG, Konitsiotis S, Margariti P, et al. T2 relaxometry and fMRI of the brain in late-onset restless legs syndrome. Neurology 2008;71: 911–16 [DOI] [PubMed] [Google Scholar]
- 7. Unrath A, Juengling FD, Schork M, et al. Cortical grey matter alterations in idiopathic restless legs syndrome: an optimized voxel-based morphometry study. Mov Disord 2007;22: 1751–56 [DOI] [PubMed] [Google Scholar]
- 8. Etgen T, Draganski B, Ilg C, et al. Bilateral thalamic gray matter changes in patients with restless legs syndrome. Neuroimage 2005;24: 1242–47 [DOI] [PubMed] [Google Scholar]
- 9. Hornyak M, Ahrendts JC, Spiegelhalder K, et al. Voxel-based morphometry in unmedicated patients with restless legs syndrome. Sleep Med 2007;9 22–26 [DOI] [PubMed] [Google Scholar]
- 10. Bucher SF, Seelos KC, Oertel WH, et al. Cerebral generators involved in the pathogenesis of the restless legs syndrome. Ann Neurol 1997;41: 639–45 [DOI] [PubMed] [Google Scholar]
- 11. Tzarouchi LC, Astrakas LG, Konitsiotis S, et al. Voxel-based morphometry and voxel-based relaxometry in parkinsonian variant of multiple system atrophy. J Neuroimaging 2010;20: 260–66 [DOI] [PubMed] [Google Scholar]
- 12. Astrakas LG, Argyropoulou MI. Shifting from region of interest (ROI) to voxel-based analysis in human brain mapping. Pediatr Radiol 2010;40: 1857–67. Epub 2010 May 13 [DOI] [PubMed] [Google Scholar]
- 13. Norris DG. Principles of magnetic resonance assessment of brain function. J Magn Reson Imaging 2006;23: 794–807 [DOI] [PubMed] [Google Scholar]
- 14. Walters AS, LeBrocq C, Dhar A, et al. Validation of the International Restless Legs Syndrome Study Group rating scale for restless legs syndrome. Sleep Med 2003;4: 121–32 [DOI] [PubMed] [Google Scholar]
- 15. Benes H, Walters AS, Allen RP, et al. Definition of restless legs syndrome, how to diagnose it, and how to differentiate it from RLS mimics. Mov Disord 2007;22: 401–08 [DOI] [PubMed] [Google Scholar]
- 16. Ashburner J, Friston KJ. Unified segmentation. Neuroimage 2005;26: 839–51 [DOI] [PubMed] [Google Scholar]
- 17. Kosta P, Argyropoulou MI, Markoula S, et al. MRI evaluation of the basal ganglia size and iron content in patients with Parkinson's disease. J Neurol 2006;253: 26–32 [DOI] [PubMed] [Google Scholar]
- 18. Metafratzi Z, Argyropoulou M, Kiortsis DN, et al. T(2) relaxation rate of basal ganglia and cortex in patients with beta-thalassaemia major. Br J Radiol 2001;74: 407–10 [DOI] [PubMed] [Google Scholar]
- 19. Maldjian JA, Laurienti PJ, Kraft RA, et al. An automated method for neuroanatomic and cytoarchitectonic atlas-based interrogation of fMRI data sets. Neuroimage 2003;19: 1233–39 [DOI] [PubMed] [Google Scholar]
- 20. Celle S, Roche F, Peyron R, et al. Lack of specific gray matter alterations in restless legs syndrome in elderly subjects. J Neurol 2010;257: 344–48 [DOI] [PubMed] [Google Scholar]
- 21. Comley RA, Cervenka S, Palhagen SE, et al. Comparison of gray matter density in restless legs syndrome patients and matched controls using voxel-based morphometry. J Neuroimaging 2012;22: 28–32 [DOI] [PubMed] [Google Scholar]
- 22. Chakos MH, Lieberman JA, Alvir J, et al. Caudate nuclei volumes in schizophrenic patients treated with typical antipsychotics or clozapine. Lancet 1995;18: 456–57 [DOI] [PubMed] [Google Scholar]
- 23. Scheepers FE, Gespen de Wied CC, Kahn RS. The effect of olanzapine treatment on m-chlorophenylpiperazine-induced hormone release in schizophrenia. J Clin Psychopharmacol 2001;21: 575–82 [DOI] [PubMed] [Google Scholar]
- 24. Tyvaert L, Houdayer E, Devanne H, et al. Cortical involvement in the sensory and motor symptoms of primary restless legs syndrome. Sleep Med 2009. 10: 1090–96 [DOI] [PubMed] [Google Scholar]
- 25. Clemens S, Rye D, Hochman S. Restless legs syndrome: revisiting the dopamine hypothesis from the spinal cord perspective. Neurology 2006;67: 125–30 [DOI] [PubMed] [Google Scholar]
- 26. Connor JR, Ponnuru P, Wang XS, et al. Profile of altered brain iron acquisition in restless legs syndrome. Brain 2011;134: 959–68. Epub 2011 Mar 11 [DOI] [PMC free article] [PubMed] [Google Scholar]
- 27. Connor JR, Wang XS, Patton SM, et al. Decreased transferrin receptor expression by neuromelanin cells in restless legs syndrome. Neurology 2004;62: 1563–67 [DOI] [PubMed] [Google Scholar]
- 28. Rodrigue KM, Haacke EM, Raz N. Differential effects of age and history of hypertension on regional brain volumes and iron. Neuroimage 2011;54: 750–59 [DOI] [PMC free article] [PubMed] [Google Scholar]
- 29. Argyropoulou MI, Astrakas L. MRI evaluation of tissue iron burden in patients with beta-thalassaemia major. Pediatr Radiol 2007;37: 1191–200 [DOI] [PMC free article] [PubMed] [Google Scholar]
- 30. Du F, Qian ZM, Zhu L, et al. L-DOPA neurotoxicity is mediated by up-regulation of DMT1-IRE expression. PLoS One 2009;4: e4593. [DOI] [PMC free article] [PubMed] [Google Scholar]
- 31. Sun ER, Chen CA, Ho G, et al. Iron and the restless legs syndrome. Sleep 1998;21: 371–77 [PubMed] [Google Scholar]
- 32. Argyropoulou MI, Kiortsis D, Astrakas L, et al. Liver, bone marrow, pancreas and pituitary gland iron overload in young and adult thalassemic patients: a T2 relaxometry study. Eur Radiol 2007;17: 3025–30 [DOI] [PubMed] [Google Scholar]
- 33. Ciccarelli O, Toosy AT, Marsden JF, et al. Identifying brain regions for integrative sensorimotor processing with ankle movements. Exp Brain Res 2005. 166: 31–42 [DOI] [PubMed] [Google Scholar]
- 34. Alexander GE, Crutcher MD. Functional architecture of basal ganglia circuits: neural substrates of parallel processing. Trends Neurosci 1990;13: 266–71 [DOI] [PubMed] [Google Scholar]
- 35. Khaldy H, León J, Escames G, et al. Circadian rhythms of dopamine and dihydroxyphenyl acetic acid in the mouse striatum: effects of pinealectomy and of melatonin treatment. Neuroendocrinology 2002;75: 201–08 [DOI] [PubMed] [Google Scholar]
- 36. Zywicke HA, van Gelderen P, Connor JR, et al. Microscopic R2* mapping of reduced brain iron in the Belgrade rat. Ann Neurol 2002;52: 102–05 [DOI] [PubMed] [Google Scholar]
- 37. Petrides M, Pandya DN. Dorsolateral prefrontal cortex: comparative cytoarchitectonic analysis in the human and the macaque brain and corticocortical connection patterns. Eur J Neurosci 1999;11: 1011–36 [DOI] [PubMed] [Google Scholar]
- 38. Okun MS, Fernandez HH, Foote KD. Deep brain stimulation of the GPi treats restless legs syndrome associated with dystonia. Mov Disord 2005;20: 500–01 [DOI] [PubMed] [Google Scholar]
- 39. Kedia S, Moro E, Tagliati M, et al. Emergence of restless legs syndrome during subthalamic stimulation for Parkinson disease. Neurology 2004;63: 2410–12 [DOI] [PubMed] [Google Scholar]
- 40. Driver-Dunckley E, Evidente VG, Adler CH, et al. Restless legs syndrome in Parkinson's disease patients may improve with subthalamic stimulation. Mov Disord 2006;21: 1287–89 [DOI] [PubMed] [Google Scholar]
- 41. Benabid AL, Chabardes S, Mitrofanis J, et al. Deep brain stimulation of the subthalamic nucleus for the treatment of Parkinson's disease. Lancet Neurol 2009;8: 67–81 [DOI] [PubMed] [Google Scholar]
- 42. Gómez-Esteban JC, Tijero B, Ciordia R, et al. Factors influencing the symmetry of Parkinson's disease symptoms. Clin Neurol Neurosurg 2010;112: 302–05 [DOI] [PubMed] [Google Scholar]
- 43. Lu CS, Ikeda A, Terada K, et al. Electrophysiological studies of early stage corticobasal degeneration. Mov Disord 1998;13: 140–46 [DOI] [PubMed] [Google Scholar]
- 44. Yarnitsky D, Barron SA, Bental E. Disappearance of phantom pain after focal brain infarction. Pain 1998;32: 285–87 [DOI] [PubMed] [Google Scholar]
- 45. Saalmann YB, Kastner S. Gain control in the visual thalamus during perception and cognition. Curr Opin Neurobiol 2009;19: 408–14 [DOI] [PMC free article] [PubMed] [Google Scholar]
- 46. San Pedro EC, Mountz JM, Mountz JD, et al. Familial painful restless legs syndrome correlates with pain dependent variation of blood flow to the caudate, thalamus, and anterior cingulate gyrus. J Rheumatol 1998;25: 2270–75 [PubMed] [Google Scholar]
- 47. Hagelberg N, Jääskeläinen SK, Martikainen IK, et al. Striatal dopamine D2 receptors in modulation of pain in humans: a review. Eur J Pharmacol 2004;500: 187–92 [DOI] [PubMed] [Google Scholar]