

Abstract
BACKGROUND AND PURPOSE:
Patients with extensive leukoaraiosis are at high risk for vascular dementia. However, these patients exhibit variable severity of global cognitive impairment correlating with callosal atrophy. We hypothesized that callosal atrophy may reflect the severity of HDWM tract damage, which may explain global cognitive impairment. The purpose of this study was to evaluate HDWM tract damage by DTI and to investigate whether HDWM tract damage is associated with callosal atrophy and global cognitive impairment, in patients with extensive leukoaraiosis.
MATERIALS AND METHODS:
Twenty-four consecutive outpatients with extensive leukoaraiosis were enrolled prospectively. The patients underwent cognitive evaluation and 3T MR imaging. The intercorrelation between cognitive score, DA of the HDWM, callosal DA, and callosal volume was analyzed statistically. The correlation of the cognitive score with DA of the HDWM and the corpus callosum was also evaluated by voxel-based analyses by using TBSS.
RESULTS:
The patients' MMSE scores varied from 10 to 30 (mean, 25.1 ± 6.0). Reduced DA of the HDWM, reduced callosal DA, and callosal atrophy intercorrelated significantly. All of these parameters showed a significant correlation with global cognitive impairment. TBSS analyses showed a significant correlation between MMSE score decline and reduced DA in the diffuse HDWM and the corpus callosum.
CONCLUSIONS:
In patients with extensive leukoaraiosis, atrophy and reduced DA of the corpus callosum may indicate diffuse HDWM tract damage, which may explain global cognitive impairment and development of vascular dementia.
Cerebral WMLs, termed “leukoaraiosis,”1 are observed frequently on T2-weighted MR imaging of elderly patients with lacunar infarcts. WMLs may progress with age, and recent population-based studies have confirmed the relationship between the extent of WMLs and cognitive impairment, especially in executive dysfunction.2,3 Moreover, extensive WMLs are a radiologic hallmark of Binswanger disease, a common cause of vascular dementia in the elderly.4,5 Patients with extensive WMLs may be at risk of global cognitive impairment and vascular dementia.6
However, patients with extensive WMLs show a variable severity of global cognitive impairment, with some patients showing vascular dementia, whereas others have almost normal cognitive function despite extensive WMLs.7–9 A longitudinal study demonstrated that further global cognitive deterioration occurs with time in patients with extensive WMLs whose cognitive impairment was mild initially.6 Therefore, understanding the pathophysiology that may cause a variable severity of cognitive impairment in patients with similar extensive WMLs may lead to the development of optimal therapeutic interventions preventing vascular dementia.
Previous studies have shown that atrophy of the corpus callosum is associated significantly with global cognitive impairment in patients with extensive WMLs.8,9 The corpus callosum consists of interhemispheric corticocortical connecting fibers, and most of the fibers traverse the HDWM while approaching the contralateral hemisphere.9 In extensive leukoaraiosis, ischemic insult to the HDWM may affect all of the component fiber tracts, irrespective of their fiber directions.10 Thus, such ischemic insult may affect callosal fiber tracts in the HDWM where they are passing. Therefore, we hypothesized that diffuse small-vessel ischemia may involve the callosal fiber tracts at the HDWM, in parallel with other HDWM fiber tracts. This ischemic fiber tract damage may cause callosal fiber damage and atrophy and may result in global disconnections among cortical and subcortical networks, leading to global cognitive impairment and vascular dementia. In other words, callosal atrophy may indicate HDWM tract damage and global cognitive impairment in patients with extensive WMLs.
DTI measures the diffusion of water molecules within the brain.11 FA and MD maps are calculated from DTI. Histogram and voxel-based analyses of these maps are useful in evaluating white matter tract damage in patients with extensive WMLs.12–14 The purpose of this study was to investigate whether HDWM tract damage is associated with global cognitive impairment and callosal atrophy in patients with extensive WMLs and lacunar infarcts, by using histogram and voxel-based analyses of DTI maps.
Materials and Methods
Patient Selection
Twenty-four consecutive patients with lacunar infarcts and extensive WMLs were enrolled prospectively between 2005 and 2007. These patients visited our neurology clinic because of various neurologic symptoms. Inclusion criteria were the following: 1) 60–85 years of age; 2) ≥1 vascular risk factor; 3) irregular and confluent periventricular hyperintensity extending into the deep white matter (Fazekas grade 3) on routine T2-weighted MR imaging that diffusely involved the bilateral hemispheres15; and 4) ≥1 lacunar infarct on routine MR imaging. Moreover, 5) patients with dementia (MMSE score, ≤23) were included only if they showed Biswanger dementia-like clinical symptoms, such as dysexecutive syndrome or gait disturbance characterized by start hesitation, short steps and wide stride, slow walking speed, and freezing gait.
The exclusion criteria were the following: 1) 10 history of stroke in the last 4 weeks; 2) history of intracranial hemorrhage; 3) a cortical or callosal infarct or an infarct of >15 mm in diameter in any location on routine MR imaging; 4) strategically located lacunar infarcts possibly causing cognitive impairment such as those in the genu of the internal capsule, thalamus, or caudate nucleus on routine MR imaging16; 5) severe dementia with an MMSE score of <10; 6) leukoencephalopathy of nonvascular origin (demyelinating or other); 7) presence of severe systemic or psychiatric illness; or 8) lack of written informed consent from the patients or their closest relatives.
The patients underwent neuropsychological evaluations and 3T MR imaging. Our institutional review board approved the protocol of this study (protocol number E207).
Neuropsychological Evaluations
In addition to screening with MMSE, the patients underwent neuropsychological evaluations including the FAB,17 VFT,9 and the Verbal Memory quotient of the WMSR.
MR Imaging Acquisition and DTI Calculations
On the same day as the neuropsychological evaluation, the patient group underwent MR imaging by using a 3T scanner (Trio; Siemens, Erlangen, Germany) equipped with an 8-channel phased array head coil. DTI data were obtained by using a diffusion-weighted single-shot echo-planar imaging sequence (TR = 5200 ms, TE = 77 ms, FOV = 220 mm, matrix size = 128 × 128, voxel size = 1.7 × 1.7 × 3 mm, and 40 axial sections with no intersection gap) with a motion-probing gradient in 12 noncollinear directions (b = 700 s/mm2). B0 images (b = 0 s/mm2) were also acquired. These images were processed, and the FA and MD maps were calculated, by using the BET18 and the Diffusion Toolbox in FMRIB,19 part of the FMRIB Software Library package, Version 4.0 (FMRIB, Oxford, UK).20
3D T1-weighted images were acquired by a magnetization-prepared rapid acquisition gradient echo sequence by using the following parameters: TR = 2000 ms, TE = 4.38 ms, TI = 990 ms, FOV = 240 mm, matrix size = 256 × 224, voxel size = 0.9 × 0.9 × 1 mm, and 208 axial sections. T2-weighted images were acquired by a turbo spin-echo sequence by using the following parameters: TR = 8400 ms, TE = 108 ms, FOV = 220 mm, matrix size = 512 × 416, voxel size = 0.4 × 0.4 × 3 mm, and 40 axial sections with no intersection gap.
Evaluation of DA of the HDWM by Histogram Analyses
Because HDWM DA parameters were needed for statistical analyses, each patient's FA and MD maps were preprocessed to contain only HDWM, subcortical white matter, and cortex, whereas the corpus callosum, ventricle, and other structures were excluded. The calculated histogram parameters from these preprocessed DTI maps were assumed to represent mainly HDWM DA. In detail, we carefully drew ROIs fitting the CSF space, brain stem and cerebellum, and deep structures, such as basal ganglia and diencephalon, on each axial section of individual B0 images. During processing, some of the capsular structures adjacent to the basal ganglia and diencephalon were included in the ROI, despite careful ROI drawing. We applied these ROIs to the corresponding FA and MD maps to exclude these structures. We also carefully drew ROIs fitting the corpus callosum on each axial section of the individual FA map and applied these ROIs to the FA and MD maps to exclude the corpus callosum. Next, the upper 25th percentile value of each patient's FA and MD histograms (FA25 and MD25) and the mean and median values of the FA and MD histograms were calculated.12 The FA value was assumed to be between 0 and 1, and the MD value was assumed to be between 0 and 500 × 10−3 mm2/s.
Evaluation of Callosal Volume and Callosal DA
We applied the BET application to each patient's 3D T1-weighted image so that extradural voxels were excluded. This image was normalized into 1 × 1 × 1 mm3 MNI 152 space by linear registration by using the Linear Image Registration Tool of FMRIB.21 The normalized T1 volume image was segmented into white and gray matter or CSF space; thus, only the white matter was extracted by using the Automated Segmentation Tool in FMRIB.22 Next, we extracted a midsagittal volume of 10-mm thickness in the standard space and calculated the number of voxels corresponding to the corpus callosum. Because voxel size was normalized to 1 mm3, the number of voxels multiplied by the voxel size (1 mm3) gave the normalized callosal volume of the individual patient.
Callosal DA was evaluated on a sagittal plane to exclude possible partial averaging with CSF space. We carefully drew ROIs fitting the corpus callosum on each sagittal section of individual FA maps. Mean callosal FA and MD were calculated in each patient by applying the ROIs to the corresponding FA and MD map.
Evaluation of WML Volume, Lacunar Infarcts, and White or Gray Matter Volume
We also evaluated WML volume, the number and location of lacunar infarcts, and white and gray matter volume to investigate the correlation between these values and cognitive impairment. For evaluating WML volume, the ROIs fitting the WMLs were carefully drawn on each axial section of individual T2-weighted images. The area covered by the ROIs in every section was calculated, and the calculated area of all the sections was summed. Because the section thickness was 3 mm, individual WML volumes were approximated to the summed area multiplied by the section thickness.
A lacunar infarct was defined as follows: 1) a distinct area 3–15 mm in diameter, 2) located in the upper two-thirds of the lentiform nuclei, cerebral white matter, or pons (patients with lacunae in the caudate nucleus or thalamus were excluded according to the exclusion criterion 4; 3) T1 low intensity; and 4) marked T2 high intensity accompanied by an ill-defined hyperintensity rim. The number of the lacunar infarcts was counted for each location.
The SIENAX application, part of the FMRIB Software Library Package,23 was applied to each patient's 3D T1 volume, to estimate the individual white and gray matter volumes normalized for each patient's skull size. A board-certified stroke neurologist (Y.O.) with 18 years' experience in neuroradiology blinded to patients' clinical information performed the image processing described above, including ROI processing of DTI and evaluation of WML volume and lacunae.
Statistical Analyses
The intercorrelation between HDWM DA (FA25, MD25, and mean and median values of FA and MD), callosal DA (mean callosal FA and MD), normalized callosal volumes, and cognitive scores (MMSE, FAB, VFT, and WMSR) was analyzed by using the Spearman rank correlation (|ρ| ≥ 0.40 and P < .05 were considered to be significant). Correlation between HDWM DA, callosal DA, or callosal volume and each cognitive score was also examined by stepwise regression analyses and multiple regression analyses. In the stepwise regression analyses, age, sex, number of lacunar infarcts, WML volume, and gray and white matter volume were used as covariables. The multiple regression analyses were adjusted for age, sex, WML volume, and white matter volume. The absolute value of a standardized regression coefficient of >0.40 and P < .05 was considered to be significant. Correlation between cognitive scores and age, number of lacunar infarcts, WML volume, gray matter volume, or white matter volume, as well as correlation between HDWM DA and WML volume, was also examined by using the Spearman rank correlation (|ρ| ≥ 0.40 and P < .05 were significant).
Image processing of the FA and MD images for voxel-based analysis was performed by using TBSS (Version 1.1, FMRIB).24 TBSS enables investigations of white matter tracts without the limitations caused by alignment inaccuracies and by uncertainty concerning smoothing extent that are typical of other voxel-based methods in DTI map analyses.24 The usefulness of TBSS for voxel-based analyses of DTI maps has been reported in patients with leukoaraiosis and other disease processes involving white matter.14,24 First, any patient's FA image was aligned to every other patient's FA image, and the most representative image among all patients' FA images was identified and selected as the target image. Next, this target image was affine-aligned into a 1 × 1 × 1 mm3 MNI 152 space. Every image was then transformed to match the MNI 152 space by combining the nonlinear registration to the target image and the affine registration from that target to the MNI 152 space. A mean FA image was created and thinned to create a mean FA skeleton image, which represents the centers of all tracts in common among the group. Every patient's aligned FA data were then projected onto this skeleton, and the projected FA data of all patients were used for voxel-based cross-subject statistical analysis. Finally, we carried out voxel-based analysis to investigate where FA and MD values had a significant correlation with the cognitive score, adjusted for WML volume and white matter volume, by using permutation-based inference on cluster size (t > 2, FWE-corrected P < .05; permutation number, 5000) with the Randomise application.25
Results
The age of the patients ranged from 61 to 85 (mean, 74 ± 6) years, and 14 of the 24 patients were men. All patients had a history of hypertension. There were 4 patients with hyperlipidemia and with diabetes mellitus, respectively. The MMSE score ranged from 10 to 30 (mean, 25.1 ± 6.0), and the MMSE score showed a strong correlation with the other 3 test batteries (Spearman ρ values: versus FAB: ρ = 0.83, P < .0001; versus VFT: ρ = 0.70, P = .001; versus WMSR: ρ = 0.78, P = .0007). The number of lacunar infarcts varied from 3 to 16 (mean, 8.5 ± 3.7), and most were located in the lentiform nuclei or cerebral white matter. The number of lacunar infarcts was not significantly correlated with cognitive impairment, regardless of location. Patient age, sex, or gray matter volume did not show a significant correlation with cognitive scores.
The WML volume ranged from 52 to 139 cm3 (mean, 87 ± 2 cm3). No patient showed high-intensity lesions in the corpus callosum. The increased WML volume showed a significant correlation with WMSR score decline (ρ = −0.52, P = .024), whereas there was no significant relationship between the WML volume and the MMSE, FAB, or VFT score. White matter volume showed a significant correlation with the VFT score (ρ = 0.55, P = .01), whereas there was no significant relationship between white matter volume and other cognitive scores.
The DTI histogram of the HDWM showed that the patients with dementia had decreased voxel counts of high FA value and low MD value, while they had increased voxel counts of low FA value and high MD value compared with the data from the patients without dementia (Fig 1). The FA value had a strong negative correlation with the MD value in the HDWM (FA25 versus MD25, ρ = −0.83, P < .0001; median FA versus median MD, ρ = −0.77, P = .0002; and mean FA versus mean MD, ρ = −0.83, P < .0001) and in the corpus callosum (mean callosal FA versus MD, ρ = −0.90, P < .0001). Reduced HDWM DA, represented by FA reduction and MD increase, reduced callosal DA, and callosal atrophy, all had a strong correlation with global cognitive impairment (Table 1 and Fig 2). Stepwise regression analyses, including age, sex, number of lacunar infarcts, WML volume, and gray and white matter volume as covariables, produced a model in which only each of HDWM DA, callosal DA, or callosal volume was included. The other covariables did not contribute significantly to the magnitude of the correlations, except for a small contribution of the WML volume or white matter volume to some of the correlations. Multiple regression analyses, including age, sex, WML volume, and white matter volume as covariables, confirmed that reduced HDWM DA, reduced callosal DA, and callosal atrophy were independent predictors of cognitive impairment. The WML volume, white matter volume, or other covariables were not an independent predictor in these models, except for a weak contribution of white matter volume to the correlation between callosal MD and VFT score (Table 2).
Fig 1.
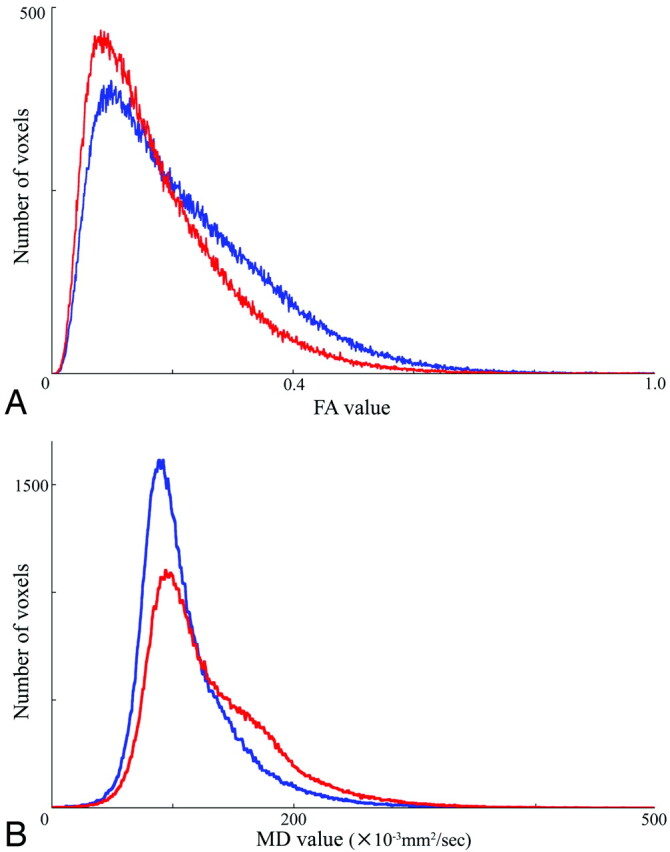
Representative FA (A) and MD (B) histograms of the HDWM. In both histograms, averaging the histograms of 4 patients with almost normal cognitive function (MMSE 29–30) is represented in blue, whereas averaging the histograms of 4 patients with dementia (MMSE 10–16) is represented in red.
Table 1:
Correlation between HDWM DA or callosal parameters and cognitive scoresa
| MMSE | FAB | VFT | WMSR | |
|---|---|---|---|---|
| HDWM DA | ||||
| FA25 | 0.77b | 0.76b | 0.69b | 0.77b |
| Median FA | 0.67b | 0.73b | 0.61c | 0.62d |
| Mean FA | 0.74b | 0.74b | 0.66e | 0.73f |
| MD25 | −0.75b | −0.73b | −0.72b | −0.84b |
| Median MD | −0.72b | −0.71b | −0.70b | −0.84b |
| Mean MD | −0.74b | −0.67b | −0.68f | −0.85b |
| Callosal mean FA | 0.95b | 0.89b | 0.80b | 0.75b |
| Callosal mean MD | −0.90b | −0.72b | −0.71b | −0.85b |
| Callosal volume | 0.75b | 0.83b | 0.86b | 0.63d |
Figures are Spearman ρ values.
Significant after Bonferroni correction for multiple comparisons (P < .05/36 = .00139).
P = .0042.
P = .007.
P = .0021.
P = .0014.
Fig 2.

Scatterplot of callosal mean FA values against MMSE scores in each patient.
Table 2:
Correlation between HDWM DA or callosal parameters and cognitive scores evaluated with multiple regression analysesa
| MMSE | FAB | VFT | WMSR | |
|---|---|---|---|---|
| HDWM DA | ||||
| FA25 | 0.76b | 0.79b | 0.64c | 0.72b |
| Mean FA | 0.71b | 0.73b | 0.56d | 0.66c |
| MD25 | −0.99b | −0.89b | −0.59e | −0.83b |
| Mean MD | −0.91b | −0.78b | −0.52f | −0.86b |
| Callosal mean FA | 0.80b | 0.85b | 0.70b | 0.73g |
| Callosal mean MD | −0.74b | −0.66b | −0.59g,h | −0.82b |
| Callosal volume | 0.74b | 0.8b | 0.72b | 0.63f |
Figures are standardized regression coefficients between each of the HDWM DA or callosal parameters and each of the cognitive scores, adjusted for age, sex, WML volume, and white matter volume.
Significant after Bonferroni correction (P < .05/28 = .0018).
P = .002.
P = .006.
P = .02.
P = .03.
P = .003.
White matter volume showed a weak contribution to the correlation between callosal MD and VFT (standard regression coefficient, 0.43; P =.046).
Reduced HDWM DA was strongly correlated with reduced callosal DA and callosal atrophy (Table 3). Callosal atrophy showed a strong correlation with reduced callosal DA (callosal volume versus mean callosal FA: ρ = 0.80, P < .005; versus mean callosal MD: ρ = −0.73, P < .005). Thus, reduced HDWM DA, reduced callosal DA, and callosal atrophy were strongly intercorrelated, and all had a strong correlation with global cognitive impairment (Fig 3). Only a nonsignificant trend for a weak correlation between WML volume increase and reduced HDWM DA was observed (WML volume versus FA25: ρ = −0.34, P = .10; versus MD25: ρ = 0.38, P = .07; versus median FA: ρ = −0.15, P = .48; versus median MD: ρ = 0.38, P = .07; versus mean FA: ρ = −0.31, P = .14; versus mean MD: ρ = 0.36, P = .09).
Table 3:
Correlation between HDWM DA and callosal parametersa
| HDWM DA | Callosal Mean FA | Callosal Mean MD | Callosal Volume |
|---|---|---|---|
| FA25 | 0.73b | −0.69b | 0.71b |
| Median FA | 0.63b | −0.56c | 0.72b |
| Mean FA | 0.70b | −0.66b | 0.70b |
| MD25 | −0.71b | 0.69b | −0.83b |
| Median MD | −0.70b | 0.69b | −0.76b |
| Mean MD | −0.68b | 0.71b | −0.74b |
Figures are Spearman ρ values.
Significant after Bonferroni correction for multiple comparison (P < .05/18 = .00278).
P = .008..
Fig 3.

Schematic diagram of the intercorrelation between reduced HDWM DA, reduced callosal DA, callosal atrophy, and cognitive impairment.
Voxel-based analyses with TBSS testing, when adjusted for WML volume and white matter volume, showed that both FA reduction and MD increase had a significant correlation with MMSE score deterioration in both the diffuse HDWM and the corpus callosum (Fig 4).
Fig 4.

Result of voxel-based analysis of FA and MD maps by using TBSS. Orange shows where both FA reduction and MD increase had significant correlation with the MMSE score decline. Red or yellow shows where FA reduction or MD increase had significant correlation with the MMSE score decline, respectively. All results are adjusted for WML volume and white matter volume. Permutation-based inference on cluster size: t > 2, FWE-corrected P < .05; permutation number, 5000. Green is the mean FA skeleton, underneath the orange, red, and yellow. In the background is the mean FA image of the 24 patients in the study.
Discussion
The present study supports our hypothesis that diffuse HDWM tract damage is associated with global cognitive impairment and callosal atrophy in patients with extensive leukoaraiosis. In our patients with extensive WMLs, reduced HDWM DA showed a strong correlation with global cognitive impairment. The correlation was stronger than that of WML volume with cognitive impairment, and multivariate analyses showed that the correlation was not confounded by WML volume or other factors. Therefore, the patients may have variable severity of HDWM tract damage that may be detected sensitively by DTI, despite a similar grade of extensive WMLs. Such tract damage may cause global disconnection between cortical and subcortical networks, resulting in global cognitive impairment and vascular dementia.
Moreover, reduced callosal DA and callosal atrophy showed a strong intercorrelation, and both had a strong correlation with reduced HDWM DA. In addition, these callosal parameters also showed a strong correlation with global cognitive impairment that was independent of WML volume, white matter volume, or other covariables. These results support our hypothesis that diffuse ischemic tract damage of the HDWM may cause damage to the passing callosal fiber tracts, resulting in reduced callosal DA and callosal atrophy. These callosal parameters may be sensitive markers of diffuse HDWM tract damage and may be useful for monitoring disease progression and evaluation of treatment efficacy.
Degradation of the microstructural organization in white matter is accompanied by FA reduction and MD increase.26 There is pathologic evidence that FA and MD correlate with axonal count and the amount of myelin in the white matter.27 Animal studies have suggested that axonal membranes, rather than the presence of myelin, may contribute primarily to DA.11 In addition, results from animal studies have indicated that axonal damage is related to reduced diffusibility changes parallel to the primary fiber orientation, while myelin breakdown is related to increased diffusibility perpendicular to the white matter tract.28 A clinical study in patients with cerebral edema caused by hepatic encephalopathy exhibited no decrease in FA but a significant increase in MD, which was reversible after treatment.29 Therefore, the combination of FA reduction and MD increase that was observed in the patients may reflect the severity of the white matter tract damage caused by several pathologic processes, including axonal damage, demyelination, and interstitial or extracellular fluid increase in response to chronic small vessel ischemia.
A main limitation of the histogram analyses is the loss of the topographic information. In the present study, the histogram analyses were preceded by segmentation to extract HDWM, subcortical white matter, and cortex data. Graphic representation of the FA histogram in the patients with dementia exhibited the reduction of high DA components corresponding to the deep white matter structure (Fig 1). Therefore, the result of histogram analyses may reflect mainly the severity of HDWM tract damage.
Several recent DTI studies have suggested that NAWM as well as WMLs show reduced DA, which contributed to global cognitive impairment in the patients with WMLs.3,7,26 Although the histogram approach focusing on NAWM was not performed in the present study because of difficulties in the precise extraction of NAWM in our patients with extensive WMLs, voxel-based analyses showed that the corpus callosum without WMLs and diffuse HDWM had reduced DA, showing significant correlation with global cognitive impairment. Thus, the results of the present study are consistent with those of previous studies in which the white matter tract damage was extensive beyond the WMLs. Diffuse HDWM damage may be a summation of damage in the WMLs and NAWM. A method that enables the precise extraction of NAWM from DTI maps of patients with extensive WMLs would clarify the contribution of WMLs versus NAWM to HDWM damage.
Patients with extensive WMLs are associated with a risk of Alzheimer disease, as well as vascular dementia.30 In the present study, patients with dementia were included only if they had Binswanger dementia-like clinical symptoms. These patients had a vascular risk factor and a history of lacunar infarcts along with extensive WMLs. Moreover, patients with severe dementia of an MMSE <10 were excluded. Thus, in our cohort, the patients with dementia fulfilled the diagnostic criteria of Binswanger disease of Bennett et al.5 In their series, most of the patients diagnosed pathologically as having Binswanger disease met the criteria compared with only 1.6% of the patients with clinically typical Alzheimer disease.5 Therefore patients with Alzheimer disease would likely be excluded from our series, though this exclusion was not confirmed pathologically.
In our patients, lacunar infarcts of the lentiform nuclei did not show significant association with cognitive impairment, inconsistent with a previous study that included subjects with various degree of WMLs.31 We evaluated lacunar infarcts with T1 and T2 high-resolution images. Using high-resolution FLAIR images may allow more precise evaluation of lacunae. However, we excluded lesions <3 mm in diameter or lesions located in the lower one-third of the basal ganglia. A pathologic study has shown that this exclusion may enable differentiation between lacunar infarcts and the perivascular space.32 Thus, our criteria likely differentiated lacunar infarcts from the perivascular space, though this was not confirmed pathologically. Therefore the inconsistency may possibly result from the small sample size of our study rather than from confusing lacunar infarct with the perivascular space.
We used the MMSE score as a representative cognitive parameter for the voxel-based analyses because of the strong correlation between MMSE and other cognitive batteries. To investigate the pathophysiology causing variable severity of cognitive impairment in patients with similar extensive WMLs, we had to exclude the potential confounding effect of WML extension, as much as possible. Therefore, we recruited only patients with Fazekas grade 3. This criterion may have contributed to our sample characteristics of high cognitive contrast and the strong intercorrelation among cognitive batteries. In the patients with a variable extent of WMLs, executive function may be sensitive to detecting cognitive impairment, as reported in previous population-based studies.6,7,13
Our study has several methodologic limitations. First, we used several DTI parameters (eg, FA25 or MD25 and so forth) for the histogram analyses according to a previous study.12 The peak height of the FA or MD histogram may be more appropriate as a parameter because it is reported to be sensitive to cognitive impairment.13 Second, we evaluated WMLs with T2 high-resolution images. Using high-resolution FLAIR images may allow more precise evaluation of WMLs. Third, we used several ROIs in the preprocessing of DTI maps. Although these ROIs were carefully drawn, automation of this image processing may improve the reproducibility of our data. Finally, because our study is a single hospital-based cross-sectional study of a small sample size, it is likely that the contrast of WML extension was not sufficient to generate a significant correlation. Population-based multicentered longitudinal and cross-sectional studies recruiting more patients with extensive WMLs and evaluating them with histogram and voxel-based approaches similar to those in our study are warranted to confirm our hypothesis.
Conclusions
In patients with extensive WMLs, reduced HDWM DA, reduced callosal DA, and callosal atrophy were strongly intercorrelated. These parameters showed a strong correlation with global cognitive impairment that was independent from WML extension. Reduced callosal DA and callosal atrophy may represent a surrogate marker of HDWM tract damage, and these callosal parameters as well as DTI parameters of the HDWM may be useful for monitoring disease progression and treatment efficacies.
ABBREVIATIONS:
- BET
Brain Extraction Tool
- DA
diffusion anisotropy
- FA
fractional anisotropy
- FAB
Frontal Assessment Battery
- FMRIB
Functional MR Imaging of the Brain
- FWE
family-wise error
- HDWM
hemispheric deep white matter
- MD
mean diffusivity
- MMSE
Mini-Mental State Examination
- MNI
Montreal Neurological Institute
- NAWM
normal-appearing white matter
- TBSS
Tract-based Spatial Statistics
- VFT
Verbal Fluency Task
- WML
white matter high-intensity lesion
- WMSR
Wechsler Memory Scale–Revised
References
- 1. Hachinski VC, Potter P, Merskey H. Leuko-araiosis. Arch Neurol 1987;44: 21–23 [DOI] [PubMed] [Google Scholar]
- 2. van der Flier W, van Straaten E, Barkhof F, et al. , on behalf of the LADIS Study group. Small vessel disease and general cognitive function in non-disabled elderly: the LADIS Study. Stroke 2005;36: 2116–20 [DOI] [PubMed] [Google Scholar]
- 3. Schmidt R, Ropele S, Ferro J, et al. , on behalf of the LADIS Study group. Diffusion-weighted imaging and cognition in the leukoaraiosis and disability in the elderly study. Stroke 2010;41: e402–08 [DOI] [PubMed] [Google Scholar]
- 4. Roman GC. Senile dementia of the Binswanger type: a vascular form of dementia in the elderly. JAMA 1987;258: 1872–88 [DOI] [PubMed] [Google Scholar]
- 5. Bennett DA, Wilson RS, Gilley DW, et al. Clinical diagnosis of Binswanger's disease. J Neurol Neurosurg Psychiatry 1990;53: 961–65 [DOI] [PMC free article] [PubMed] [Google Scholar]
- 6. Jokinen H, Kalska H, Ylikoski R, et al. , on behalf of the LADIS Study group. Longitudinal cognitive decline in subcortical ischemic vascular disease: the LADIS Study. Cerebrovasc Dis 2009;27: 384–91 [DOI] [PubMed] [Google Scholar]
- 7. O'Sullivan M, Morris RG, Huckstep B, et al. Diffusion tensor MRI correlates with executive dysfunction in patients with ischaemic leukoaraiosis. J Neurol Neurosurg Psychiatry 2004;75: 441–47 [DOI] [PMC free article] [PubMed] [Google Scholar]
- 8. Yamauchi H, Fukuyama H, Ogawa M, et al. Callosal atrophy in patients with lacunar infarction and extensive leukoaraiosis: an indicator of cognitive impairment. Stroke 1994;25: 1788–93 [DOI] [PubMed] [Google Scholar]
- 9. Yamauchi H, Fukuyama H, Shio H. Corpus callosum atrophy in patients with leuko-araiosis may indicate global cognitive impairment. Stroke 2000;31: 1515–20 [DOI] [PubMed] [Google Scholar]
- 10. Yamanouchi H, Sugiura S, Tomonaga M. Decrease in nerve fiber in cerebral white matter in progressive subcortical vascular encephalopathy of Binswanger type: an electron microscopic study. J Neurol 1989;236: 382–87 [DOI] [PubMed] [Google Scholar]
- 11. Beaulieu C. The basis of anisotropic water diffusion in the nervous system: a technical review. NMR Biomed. 2002;15: 435–55 [DOI] [PubMed] [Google Scholar]
- 12. Della Nave R, Foresti S, Pratesi A, et al. Whole-brain histogram and voxel-based analyses of diffusion tensor imaging in patients with leukoaraiosis: correlation with motor and cognitive impairment. AJNR Am J Neuroradiol 2007;28: 1313–19 [DOI] [PMC free article] [PubMed] [Google Scholar]
- 13. Nitkunan A, Barrick TR, Charlton RA, et al. Multimodal MRI in cerebral small vessel disease: its relationship with cognition and sensitivity to change over time. Stroke 2008;39: 1999–2005 [DOI] [PubMed] [Google Scholar]
- 14. de Laat KF, Tuladhar AM, van Norden AG, et al. Loss of white matter integrity is associated with gait disorders in cerebral small vessel disease. Brain 2011;134 (pt 1): 73–83. Epub 2010 Dec 14 [DOI] [PubMed] [Google Scholar]
- 15. Fazekas F, Chawluk JB, Alavi A, et al. MR signal abnormalities at 1.5T in Alzheimer's dementia and normal aging. AJR Am J Roentogenol 1987;149: 351–56 [DOI] [PubMed] [Google Scholar]
- 16. Tatemichi TK. Dementia. In: Bogousslavsky J, Caplan L, eds. Stroke Syndromes. New York: Cambridge University Press; 1995, 169 169–81 [Google Scholar]
- 17. Dubois B, Slachevsky A, Litvan I, et al. The FAB: a Frontal Assessment Battery at bedside. Neurology 2000;55: 1621–26 [DOI] [PubMed] [Google Scholar]
- 18. Smith SM. Fast robust automated brain extraction. Hum Brain Mapping 2002;17: 143–55 [DOI] [PMC free article] [PubMed] [Google Scholar]
- 19. Behrens TE, Woolrich MW, Jenkinson M, et al. Characterization and propagation of uncertainty in diffusion-weighted MR imaging. Magn Reson Med 2003;50: 1077–88 [DOI] [PubMed] [Google Scholar]
- 20. Smith SM, Jenkinson M, Woolrich MW, et al. Advances in functional and structural MR image analysis and implementation as FSL. Neuroimage 2004;23: 208–19 [DOI] [PubMed] [Google Scholar]
- 21. Jenkinson M, Smith SM. A global optimization method for robust affine registration of brain images. Med Image Anal 2001;5: 143–56 [DOI] [PubMed] [Google Scholar]
- 22. Zhang Y, Brady M, Smith S. Segmentation of brain MR images through a hidden Markov random field model and the expectation maximization algorithm. IEEE Trans Med Imaging 2001;20: 45–57 [DOI] [PubMed] [Google Scholar]
- 23. Smith SM, Zhang Y, Jenkinson M, et al. Accurate, robust and automated longitudinal and cross-sectional brain change analysis. Neuroimage 2002;17: 479–89 [DOI] [PubMed] [Google Scholar]
- 24. Smith SM, Jenkinson M, Johansen-Berg H, et al. Tract-based spatial statistics: voxelwise analysis of multi-subject diffusion data. Neuroimage 2006;31: 1487–505 [DOI] [PubMed] [Google Scholar]
- 25. Nichols TE, Holmes AP. Nonparametric permutation tests for functional neuroimaging: a primer with examples. Hum Brain Mapping 2001;15: 1–25 [DOI] [PMC free article] [PubMed] [Google Scholar]
- 26. Vernooij MW, Afran Ikram M, Vrooman HA, et al. White matter microstructural integrity and cognitive function in a general elderly population. Arch Gen Psychiatry 2009;66: 545–53 [DOI] [PubMed] [Google Scholar]
- 27. Schmierer K, Wheeler-Kingshott CA, Boulby PA, et al. Diffusion tensor imaging of post mortem multiple sclerosis brain. Neuroimage 2007;35: 467–77 [DOI] [PMC free article] [PubMed] [Google Scholar]
- 28. Song SK, Sun SW, Ju WK, et al. Diffusion tensor imaging detects and differentiates axon and myelin degeneration in mouse optic nerve after retinal ischemia. Neuroimage 2003;20: 1714–22 [DOI] [PubMed] [Google Scholar]
- 29. Kale RA, Gupta RK, Saraswat VA, et al. Demonstration of interstitial cerebral edema with diffusion tensor MR imaging in type C hepatic encephalopathy. Hepatology 2006;43: 698–706 [DOI] [PubMed] [Google Scholar]
- 30. Debette S, Markus HS. The clinical importance of white matter hyperintensities on brain magnetic resonance imaging: systematic review and meta-analysis. BMJ 2010;341: c3666 [DOI] [PMC free article] [PubMed] [Google Scholar]
- 31. Benistry S, Gouw AA, Porcher R, et al. , on behalf of the LADIS Study group. Location of lacunar infarcts correlates with cognition in a sample of non-disabled subjects with age-related white-matter changes: the LADIS Study. J Neurol Neurosurg Psychiatry 2009;80: 478–83 [DOI] [PubMed] [Google Scholar]
- 32. Bokura H, Kobayashi S, Yamaguchi S. Distinguishing silent lacunar infarction from enlarged Virchow-Robin spaces: a magnetic resonance imaging and pathological study. J Neurol 1998;245: 116–22 [DOI] [PubMed] [Google Scholar]