Abstract
Mapping the complex biogeography of microbial communities in situ with high taxonomic and spatial resolution poses a major challenge because of the high density1 and rich diversity2 of species in environmental microbiomes and the limitations of optical imaging technology3–6. Here, we introduce High Phylogenetic Resolution microbiome mapping by Fluorescence in situ Hybridization (HiPR-FISH), a versatile technology that uses binary encoding, spectral imaging, and machine learning based decoding to create micron-scale maps of the locations and identities of hundreds of microbial species in complex communities. We demonstrate the ability of 10-bit HiPR-FISH to distinguish 1023 E. coli isolates, each fluorescently labeled with a unique binary barcode. HiPR-FISH, in conjunction with custom algorithms for automated probe design and single-cell image analysis, reveals the disruption of spatial networks in the mouse gut microbiome in response to antibiotic treatment and the longitudinal stability of spatial architectures in the human oral plaque microbiome. Combined with super-resolution imaging, HiPR-FISH reveals the diverse ribosome organization strategies of human oral microbial taxa. HiPR-FISH provides a framework for analyzing the spatial ecology of environmental microbial communities at single-cell resolution.
INTRODUCTION
Microbial communities often exhibit rich taxonomic diversity and exquisite spatial organization3,7–9. While the taxonomic diversity of complex microbial communities is readily accessible by metagenomic sequencing, the spatial organization is very difficult to survey. Fluorescence in situ hybridization assays that target ribosomal RNA (rRNA) for taxonomic identification and visualization have been developed but are limited in taxonomic resolution and multiplexity5,6. These studies highlight the spatial organization of several abundant taxa, but are insufficient for unbiased analysis of microbial biogeography at the microbiome scale in the mammalian gastrointestinal tract, where hundreds to thousands of species coexist1,10. Studies to-date have furthermore been largely qualitative, with a few quantitative analyses using coarse-grained approaches11,12, making spatial information at the single cell level inaccessible.
Here, we describe HiPR-FISH, a microbiome mapping technology that achieves 1000-fold multiplexity in taxa identification with a single round of imaging on a standard confocal microscope. HiPR-FISH achieves high multiplexity with a binary barcoding scheme and machine learning based classification of the combined spectra of up to 10 fluorophores (Fig. 1a & Extended Data Figs. 1 & 2). For binary barcoding of species, HiPR-FISH implements a two-step hybridization scheme, with a first step that uses taxon-specific probes modified with DNA flanking sequences, and a second step with fluorescently labeled readout probes targeting the flanking sequences. Unlike previous approaches that have used species-specific probes tagged with fluorophores6,8, HiPR-FISH uses unmodified probes that can be synthesized with array technologies, leading to a higher throughput and lower cost. To apply HiPR-FISH to quantitative analyses of microbial communities at single-cell resolution, we developed a routine for automated image segmentation. HiPR-FISH revealed the disruption of spatial networks in the gut microbiome in response to antibiotics treatment and the temporal stability of spatial micro-architectures in the oral microbiome. Finally, we combined HiPR-FISH with super-resolution imaging and discovered diverse strategies for intracellular ribosome organization used by taxa in the oral microbiome.
Figure 1. HiPR-FISH working principle.
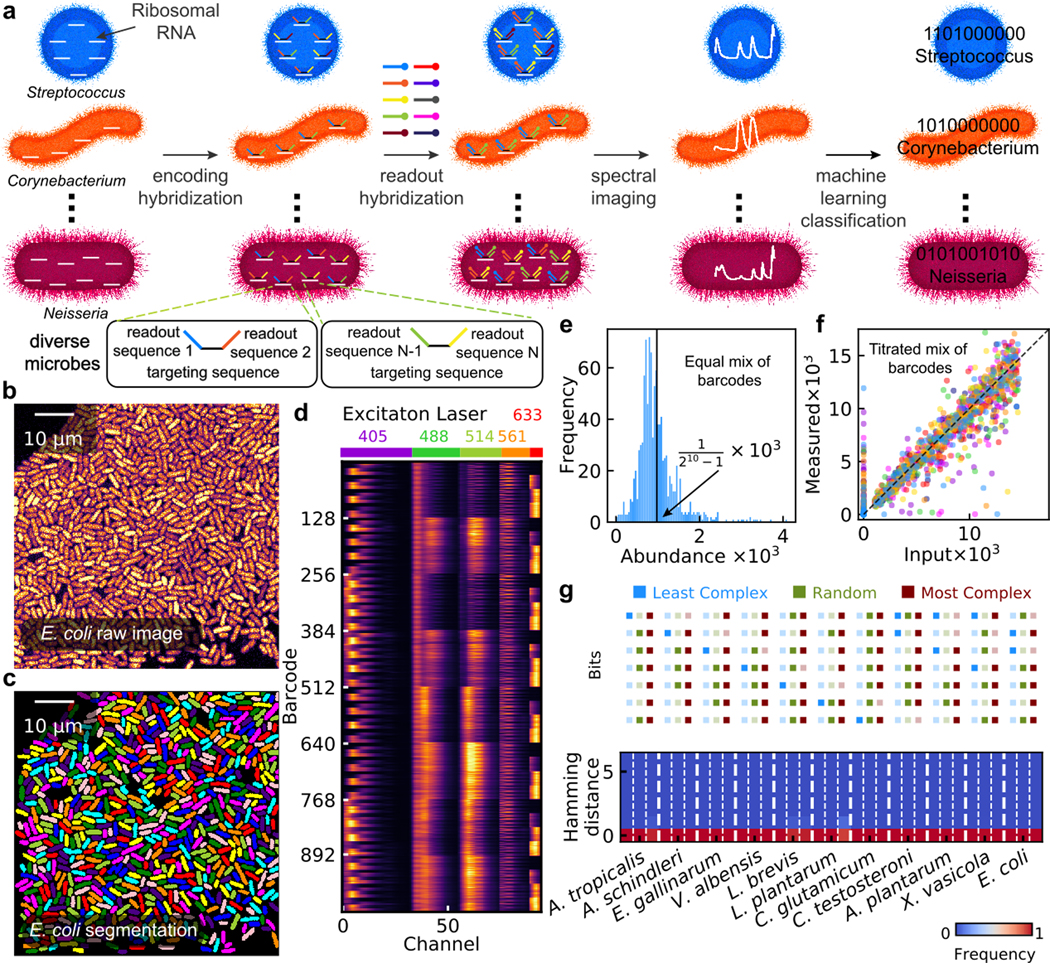
a, HIPR-FISH labels bacteria taxa with up to 10 different fluorophores, enabling 1023-plex multiplexity in taxa identification and visualization. b, A typical Field of View (FOV) of E. coli cells. c, Single cell segmentation of the FOV in b. d, Heatmap view of the concatenated spectra for each of the 1023 barcodes. e, Histogram of the relative abundance of an equal-concentration mixture of all 1023 barcoded E. coli isolates. f, Correlation of measured and input abundance in E. coli synthetic communities. Each community consists of 127 to 128 barcoded E. coli isolates at varying concentrations. g, Classification frequency as a function of hamming distance for each species in the synthetic community labeled with random, the least complex, and the most complex barcodes.
RESULTS
Implementation of HiPR-FISH
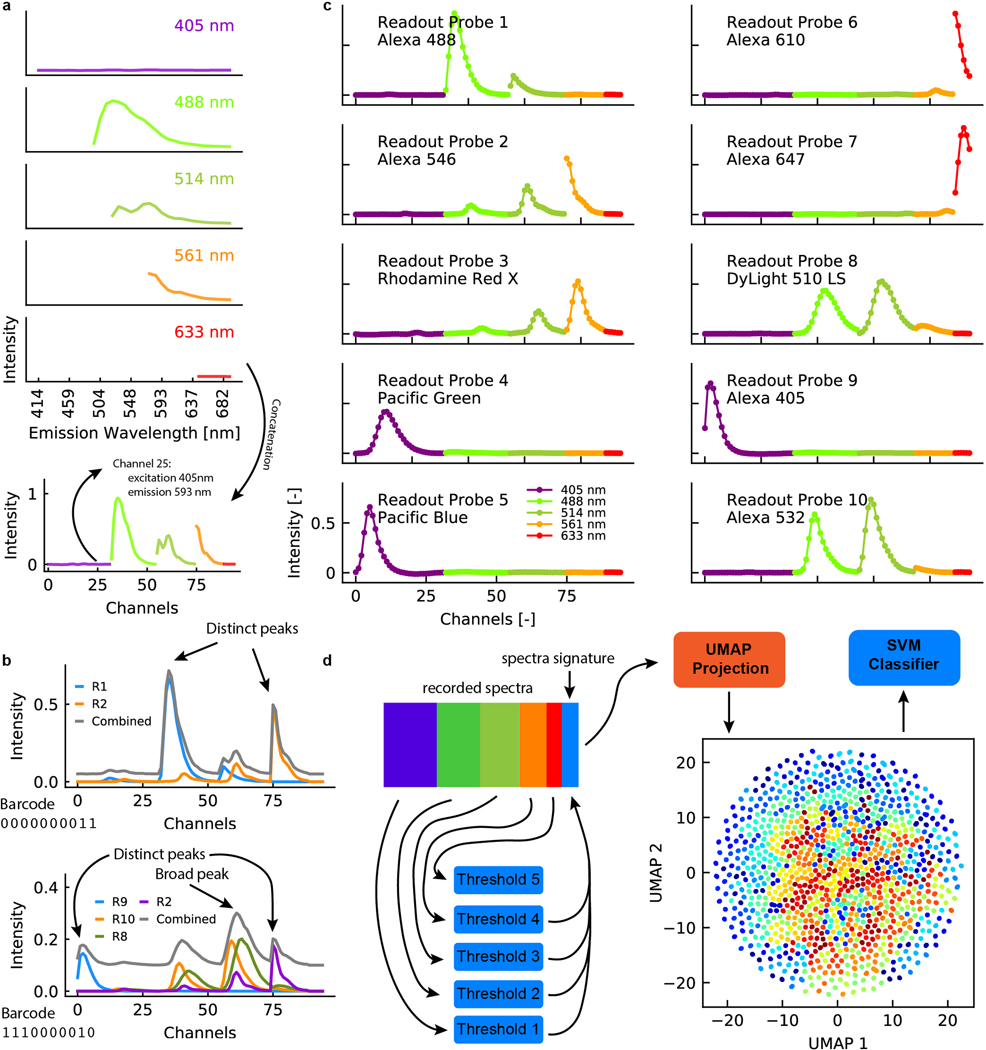
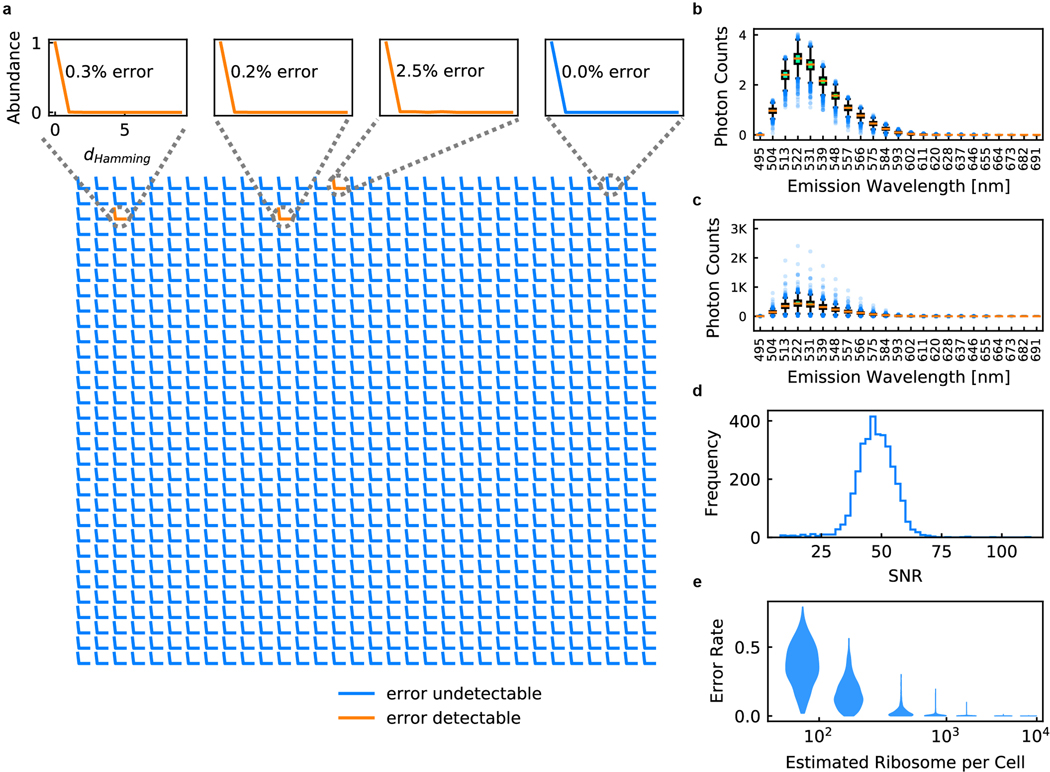
For the practical implementation of HiPR-FISH, we used barcodes composed of up to ten distinct fluorophores, leading to 1023 unique combinations (210−1, Supplementary Information Table 1, Extended Data Fig. 2). To label cells with multiple fluorophores, HiPR-FISH takes advantage of the high abundance of ribosomes in bacterial cells. Probes with the same encoding but different readout sequence can bind stochastically to individual rRNAs in the same cell, resulting in equal proportions of readout sequences bound. For each cell, we measured and computed a spectral barcode by concatenating the fluorescence emission spectra measured using five excitation lasers (Supplementary Information Table 2). We averaged the spectra recorded across pixels for each cell and decoded the cell barcode using a machine-learning classifier (see Methods, Extended Data Fig. 2). To create training spectra for the classifier, we assayed 1023 E. coli isolates, each labeled with one of 1023 barcodes (Fig. 1b–d). The classifier achieved error-free classification for 99.7% of barcodes using reference spectra simulated with multivariate normal distributions, where the mean and covariance were extracted from experimentally measured spectra. We used photon counting measurements to estimate the ribosome density in E. coli cells and simulated the classification error with decreasing ribosome density (see Methods). We simulated over 7.16 million spectra and found that the classifier can accurately predict barcodes for cells with ~103 ribosomes (96 % of barcodes with less than 5% classification error rate for ~ 790 ribosomes per cell, Extended Data Fig. 3).
Proof-of-principle
To further test the robustness of HiPR-FISH, we characterized predefined mixtures of the 1023 E. coli barcode isolates. We first created and imaged an equal concentration mixture of all barcode strains. We performed barcode decoding for a total of 65,534 cells (Fig. 1e) and determined that all barcodes were represented in the mixture, with a median fractional abundance of and full width at half maximum (FWHM) of , close to what is expected for a multinomial distribution (median relative abundance of and a FWHM of ). We next randomly divided the 1023 aliquots into 8 groups, each comprised of 127 or 128 barcodes, and mixed barcodes in the same group at varying abundance. We measured 35,000 to 40,000 single cell spectra for each group and quantified the relative abundance of different barcodes in each mixture. We found close agreement between the expected and measured abundance for all groups, with a median slope of 0.95 and an average R2 value of 0.83 (Fig. 1f). Barcode mis-assignment was rare, with gross error rates, defined as the proportion of barcodes that do not belong in a group of barcodes, ranging from 2.5% to 6.6%.
To further demonstrate the principle of HiPR-FISH, we probed and imaged a set of 11 species of bacteria (see Methods, Supplementary Information Tables 3 & 4), including both gram positive (n = 4) and negative (n = 7) species. Probe sequences were designed using thermodynamic modeling and selected based on stringent hybridization criteria (see Methods). We generated three sets of probes (A, B, C, Extended Data Fig. 4), where each probe set comprised a common list of targeting sequences specific to the 11 species in the synthetic community but had different flanking encoding sequences. In particular, targeting sequences in set A, B, and C were encoded with the least complex, the most complex, and a random selection of barcodes, respectively, where barcodes comprised of more true bits and therefore a greater number of fluorophores were considered more complex (Fig. 1g). To evaluate the specificity of each custom-designed species-specific probe, we recorded single-cell spectra for each probe set-species combination. To account for variable ribosomal density in cells from different taxa, we further developed a second classifier that incorporates a Förster Resonance Energy Transfer model13 to refine training spectra (see Methods). This approach to barcode classification is easier to implement than a pure reference spectrum-based classifier, because it only requires measurements of the emission spectra of the individual fluorophores as input for model training. We applied this classifier to determine the barcode out of the 1023 candidate barcodes that most likely corresponded to each measured single-cell spectrum and found strong agreement between the assigned and expected barcodes for all barcode-species combinations (Fig. 1g, median error rate ). In cases of spectral misclassification, the misclassified barcode was most often just one bit away from the correct barcode (hamming distance 1, Extended Data Fig. 5). Overall, we find that we can achieve species-specific detection and flexible binary barcode encoding using HiPR-FISH.
Image processing and single cell segmentation
To extract quantitative information with single cell resolution from HiPR-FISH images, we developed Local Neighborhood Enhancement (LNE), an algorithm to define a seed for watershed segmentation (Fig. 2a). LNE classifies each pixel as part of a cell or the background using information contained in the pixel local neighborhood (see Methods, Extended Data Fig. 6). LNE is shape-agnostic, and compatible with different imaging modalities (Extended Data Fig. 7). LNE considers the directional information contained in pixel neighborhoods to distinguish pixels with similar mean intensity but different local image context. LNE performs better at defining a seed for single-cell segmentation of densely packed microbes with diverse shapes and ribosome density than previously reported approaches, including OTSU thresholding14, Sauvola thresholding15, and DeepCell (Extended Data Fig. 6). We further developed an under-segmentation detection algorithm to remove any remaining under-segmented objects (Extended Data Fig. 8).
Figure 2. Algorithm for single-cell segmentation.
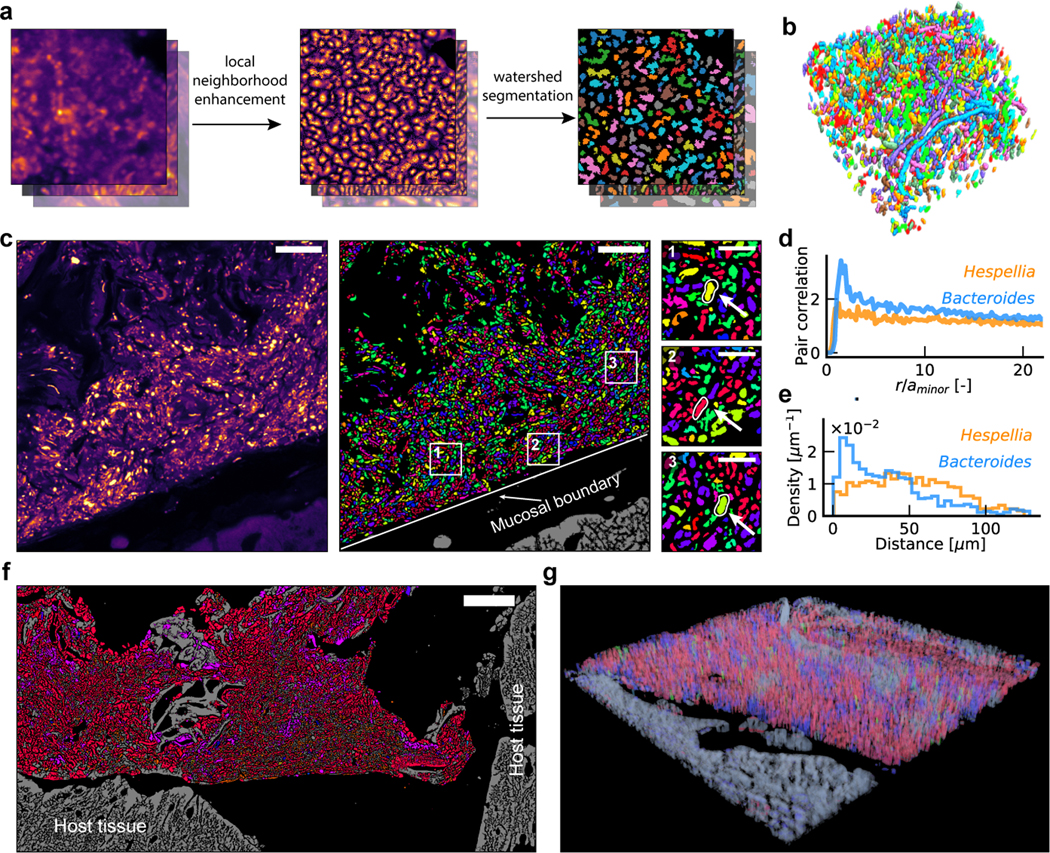
a, Key steps for image analysis. The contrast for denoised images is enhanced using LNE. Watershed seed masks are generated based on the LNE image, and segmentation is performed using watershed. b, An example of a volumetric segmentation of a human oral biofilm. Different colors correspond to different cells. c, Example segmented and identified images of a mouse colon section, with a few taxa highlighted in enlarged views. Scalebar: 25 μm. The segmentation and identification was repeated for 28 (ciprofloxacin) and 30 (healthy control) fields of view with similar results. d, Pair correlation function shows that Bacteroides cells are likely to form clusters at short ranges, while Hespellia cells exhibit random spatial distribution. e, Histogram of distances to the mucosal barrier reveals that Bacteroides cells are enriched near the mucosal boundary, while Hespellia cells are more evenly distributed away from the mucosal boundary. f, A tile scan of the edge of a fecal pellet from a ciprofloxacin treated mice, covering an area of approximately 266 μm × 546 μm. g, A volumetric rendering of a z-stack collected from a ciprofloxacin treated mice, demonstrating HiPR-FISH compatibility with 3D characterization of tissue samples.
Disruption of spatial organization of the mouse gut microbiome
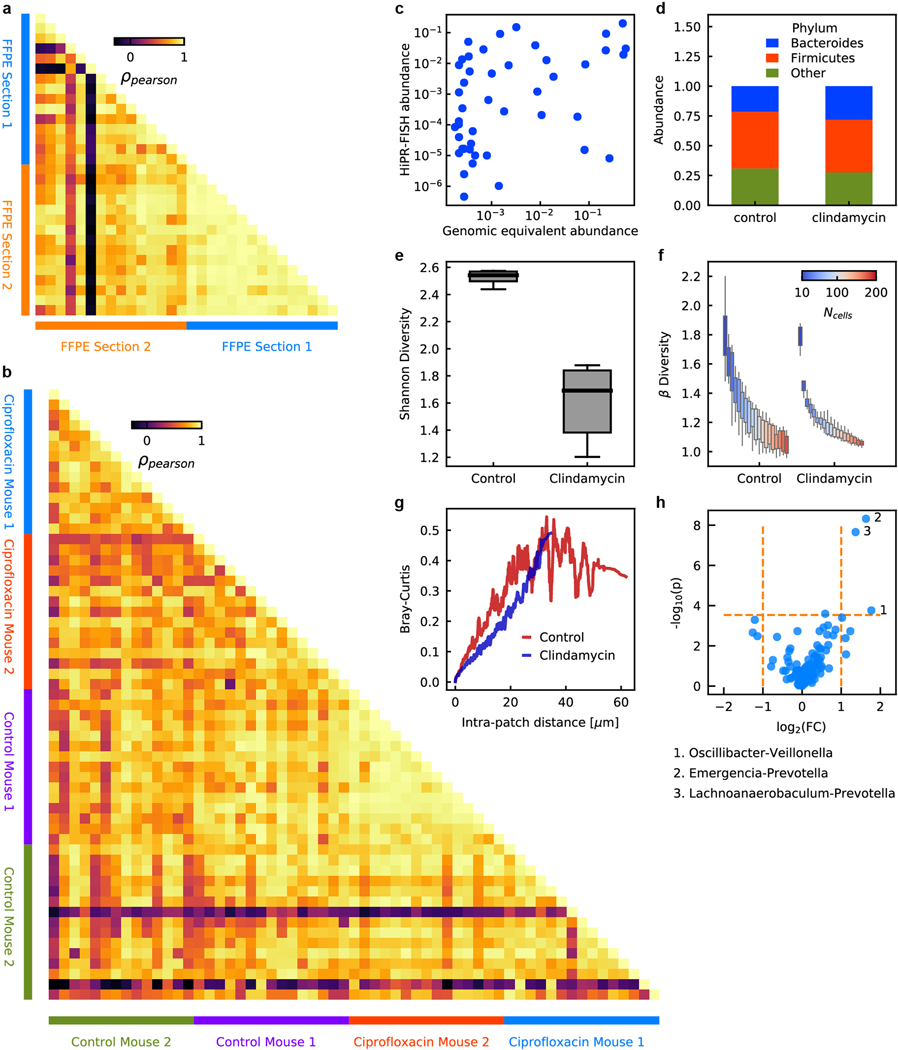
The effect of antibiotic treatment on the spatial organization of the mucosa-associated gut microbiome has not been studied in detail16,17. To fill this knowledge gap, we created HiPR-FISH maps of the mouse gut microbiome in the presence and absence of antibiotic treatment. We designed HiPR-FISH probe sets based on full-length 16S sequences generated using PacBio sequencing (see Methods, Supplementary Information Table 5 & 6, Extended Data Fig. 4). We designed two probe sets consisting of 115 and 264 probes targeting up to 47 genera and used these probe sets to test the robustness of HiPR-FISH. We compared the fluorescence intensity measured for each barcode across multiple fields of view and tissue sections (Supplementary Information Table 7) and found a strong correlation in total intensity measured across all barcodes, indicating that probe hybridization and imaging are reproducible (see Methods, Extended Data Fig. 9). We next compared HiPR-FISH imaging results with metagenomic sequencing of laser capture micro-dissected tissues obtained from FFPE sections from the same tissue block and found agreement for the imaging and sequencing measurements (log transformed Pearson correlation 0.4, p = 0.007, Extended Data Fig. 9).
In the colon of a mouse treated with clindamycin, we detected cells from the genus of Bacteroides and the recently discovered genera of Macellibacteroides and Longibaculum (Fig. 2c). We calculated the pair correlation function (PCF) for Bacteroides and Hespellia, two common phyla in the gut microbiome (Fig. 2d). We observed a slow decay in the PCF for Bacteroides, indicating that Bacteroides tend to form clusters at short distances (~ 3.3 μm). In contrast, the PCF of Hespellia cells was consistent with a random distribution. We next measured distances to the mucosal boundary and found that Bacteroides but not Hespellia are enriched near the boundary (Fig. 2e), in line with previous observations12. We applied a large area tile scan of the terminal area of a fecal pellet and found that fecal pellets are coated with a dense layer of microbes (Fig. 2f), even at locations with no apparent contact with the host epithelial tissue. Finally, we generated a volumetric rendering of a z-stack image (Fig. 2g).
We next examined changes in species abundance and the number of physical contacts between any two taxa due to ciprofloxacin treatment (Fig. 3a). We observed an increased Bacteroidetes/Firmicutes abundance ratio compared to control mice (Fig. 3b), consistent with previous studies18,19. There was a small but significant increase in Shannon diversity associated with ciprofloxacin treatment (independent t-test, two-tailed p = 0.002, Fig. 3c). The beta diversity of small patches of cells decreased as the patch size increased for both ciprofloxacin treated and control mice (Fig. 3d). To examine variations in local composition, we calculated the Bray-Curtis dissimilarity between small patches of cells. The Bray-Curtis dissimilarity increased slightly with distance between the center of patches but remained small even at large distance (Fig. 3e). We observed similar trends for clindamycin-treated mice except for the Shannon diversity, which was decreased in the antibiotics treated group (independent t-test, two-tailed, Extended Data Fig. 9), again suggesting that microstructures in the gut microbiome are conserved over large distances. Finally, we found that antibiotics treatment disrupted the spatial association between several genera (see Methods, Fig. 3f, Extended Data Fig. 9). The altered spatial association with the largest fold change occurred between Oscillibacter and Veillonella, both of which have been linked to altered inflammatory responses and metabolic activities of the host20,21.
Figure 3. Antibiotic treatments disrupt gut microbiome spatial organization.
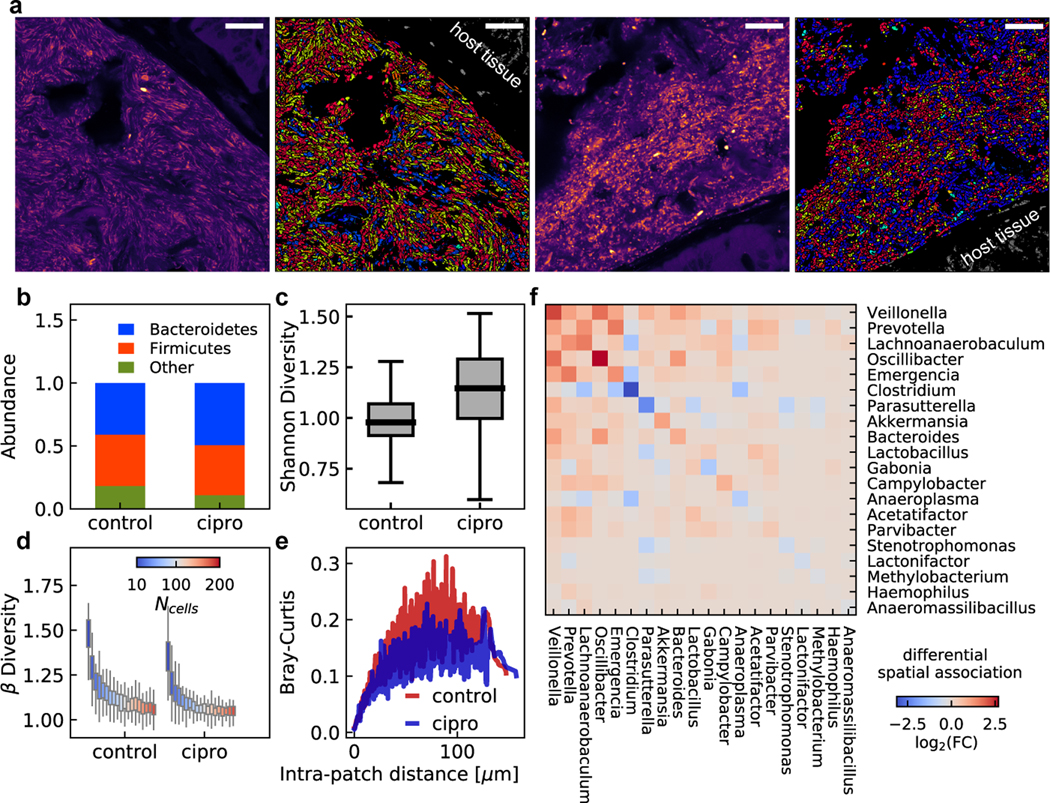
a, Example raw and identified images of the mouse gut microbiome under ciprofloxacin or PBS treatments. Scalebar: 25 μm. b, Phylum level abundance shows a decreased Bacteroidetes to Firmicutes ratio in ciprofloxacin-treated mice. c, Shannon diversity is slightly increased in ciprofloxacin treated-mice compared to control mice. d, Beta diversity as a function of patch size shows similar trends in ciprofloxacin-treated and control mice. In (c) and (d), the center lines show the median value, the bounds of the boxes correspond to 25th and 75th percentile, and the whiskers extend to 1.5 interquartile range. e, Bray-Curtis dissimilarity between patches of the same size increases as a function of intra-patch distance and remains low at long length scales. f, Differential spatial association network analysis between ciprofloxacin-treated and control mice. Ciprofloxacin treatment leads to changes in frequency of physical proximity between taxa. n=28 fields of view for the two ciprofloxacin-treated mice and n=30 fields of view for the two healthy control mice.
Structure and stability of the architecture of human plaque biofilms
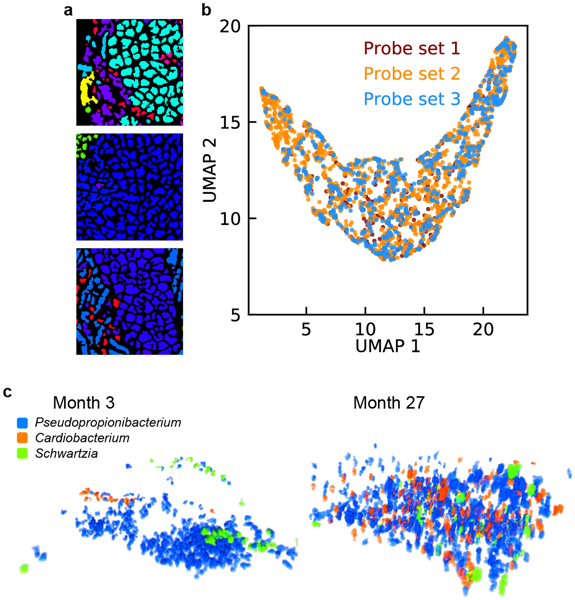
The oral microbiome is one of the most diverse in humans, comprising more than 600 prevalent species22. We performed HiPR-FISH on plaque biofilms collected at 7 timepoints from a healthy donor over the course of 27 months (Fig. 4a–b). We first used a HiPR-FISH panel consisting of 233 probes targeting 54 bacterial genera and observed corn cob structures composed of Streptococcus, consistent with previous observations (Fig. 4c). To further benchmark HiPR-FISH, we designed two additional probe sets, with different encoding sequences, barcode assignments, and probe selection criteria (see Methods), consisting of 390 and 319 probes at the genus level, and targeting 65 and 61 genera. In experiments with all three probe sets, we observed clusters of cells from the genus of Lautropia, known for their pleomorphic coccoid morphology and we found that the cell sizes and morphologies of Lautropia were consistent across all three sets (Extended Data Fig. 10).
Figure 4. Biogeography of human oral biofilms.
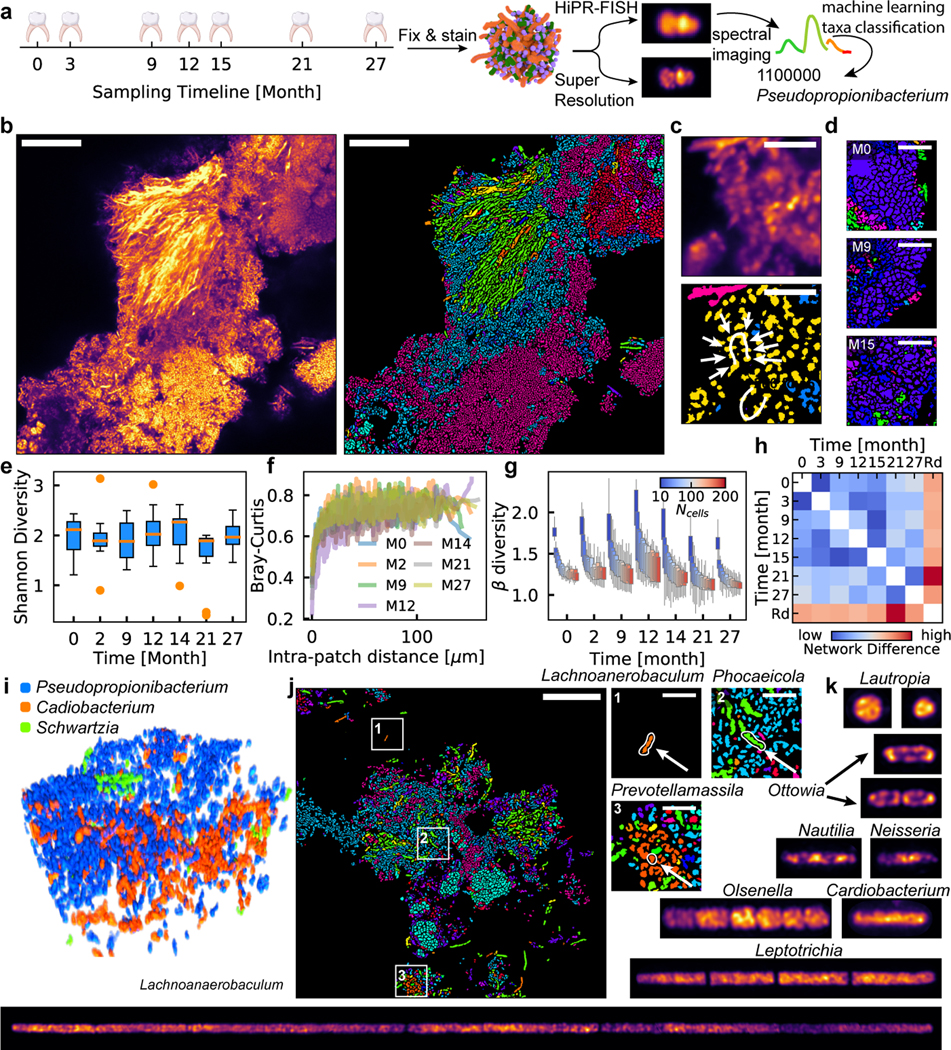
a, Experimental workflow. b, Example FOV of a human oral microbiome. Scalebar: 25 μm. c, Corncob structure formed by cells from the genus of Streptococcus observed in human oral plaque biofilms (upper: denoised, lower: identified). Scalebar: 5 μm. (b) and (c) show example images selected from 12 FOVs. d, Example FOV of Lautropia observed at three timepoints, showing pleomorphic coccoid cluster morphology. Scalebar: 5 μm. Examples selected from 88 FOVs. e, Oral shannon diversity measured using HiPR-FISH remains stable over 27 months. f, Bray-Curtis dissimilarity between patches with the same number of cells increases with intra-patch distance and remains higher than those in the mouse gut at long length-scales. g, Beta diversity of patches of cells in a human oral microbiome shows similar trends across timepoints. n=88 FOVs. In (e) and (g), the center lines show the median value, the bounds of the boxes correspond to 25th and 75th percentile, and the whiskers extend to 1.5 interquartile range. h, Spatial association networks between different timepoints are more similar to each other than to random networks with the same spatial and compositional makeup, suggesting that the human oral microbiome spatial organization is longitudinally stable. i, An example volume of a new consortium composed of Pseudopropionibacterium, Cardiobacterium, and Schwartzia in a healthy oral microbiome. j, Cells from genera that were not targeted in previous studies were detected, including Lachnoanaerobaculum, Phocaeicola, and Prevotellamassila. Scalebar: 25 μm. Example selected from 12 FOVs. k, Super-resolution imaging reveals different ribosomal organization across diverse oral taxa. Raw images are computationally straightened. All image widths are 1.6 μm except for Lachnoanaerobaculum, which has a width of 3.2 μm.
Microbial communities in oral biofilms appeared to be more spatially structured than those in the mouse gut (Fig. 4b). We observed recurrent microarchitectures with prominent morphology, such as clusters of Lautropia cells (Fig. 4d), across longitudinal samples, suggesting that the oral microbiome spatial structure remains stable over time23–26. To evaluate this further, we measured the Shannon diversity and the Bray-Curtis dissimilarity between patches of cells as function of time and found both to be longitudinally stable (Fig. 4e–f, one-way ANOVA p = 0.28). The Bray-Curtis dissimilarity was higher than that of the mouse gut microbiome, supporting our visual evaluation that the oral microbiome is more spatially organized than the gut microbiome. The beta diversity followed similar trends as a function of the size of the local neighborhood (Fig. 4g). To examine the longitudinal stability of the spatial interactions between different microbial taxa, we calculated an aggregated spatial adjacency matrix for each timepoint and calculated the Frobenius matrix distance as a measure for network similarity. The spatial association networks measured at all time points were more similar to each other than a random network with the same taxa abundances, again indicating that oral microbiome architectures are stable over time (Fig. 4h).
We next explored microbial consortia and species of interest that have not previously been visualized in their native context. We observed multiple occurrences of a consortium of Pseudopropionibacterium, Cardiobacterium, and Schwartzia (Fig. 4i, Extended Data Fig. 10). These three taxa are anaerobes, suggesting that the association is more likely driven by metabolic interaction than oxygen requirements. Cardiobacterium is commonly found in the mouth and upper respiratory tract, and accounts for 5–10% of infective endocarditis27. The observation of an association of Cardiobacterium with Pseudopropionibacterium and Schwartzia in a healthy oral microbiome may provide avenues for further investigation of the pathogenesis of Cardiobacterium-associated endocarditis. In addition, we detected cells from the genus of Phocaeicola embedded among clusters of Rothia cells (Fig. 4j), suggesting that the two genera interact metabolically. We furthermore observed cells from the genera of Lachnoanerobaculum and Prevotellamassila, which were not targeted by previous imaging experiments of the human oral microbiome, likely because of their low prevalence. The observed cell morphology for cells from the genus of Lachnoanerobaculum was consistent with those previously reported in culture-based studies (cell lengths 5–20 μm)28.
Last, we combined HiPR-FISH with super-resolution imaging to connect phylogenetic information with ribosome organization (Fig. 4k)29,30. We used HiPR-FISH to establish identity and Airyscan imaging on the same cells to measure intracellular ribosome distributions. For Lautropia, super-resolution imaging revealed excluded regions within each cell with low ribosome density, as well as apparent subcellular compartments within each cell. For Ottowia, ribosomes were mostly found along the periphery and at the cell poles. Ribosomes were uniformly distributed in Cardiobacterium, and Neisseria tended to organize ribosomes in the center of the cell. Leptotrichia have a unique, rod-chain morphology that is easily distinguishable using phase contrast imaging31,32. We observed four Leptotrichia cells in a chain formation, with variable ribosome density within each cell. Olsenella has been shown to occur individually, in pairs, or in serpentine chains in culture33. We observed two instances of serpentine chains of Olsenella, and super-resolution imaging revealed that ribosomes are distributed non-uniformly within each cell. Finally, we observed a long Lachnoanerobaculum chain of 3 cells (total length 97.5 μm), with a variable ribosome distribution along the length of each cell, and the occurrence of puncta along the cells. Together, these observations highlight the diverse intracellular ribosomal organization strategies for different taxa in the oral microbiome.
DISCUSSION
We describe HiPR-FISH, a versatile tool to map microbiomes. Compared to existing approaches, HiPR-FISH provides a more than tenfold improvement in mulitplexity5. HiPR-FISH implements a two-step hybridization scheme that was previously exploited to spatially map messenger RNAs in tissues34. Combined with the high abundance and relatively uniform distribution of 16S rRNA molecules in microbial cells, HiPR-FISH enables labeling of bacterial cells with combinations of up to ten fluorophores. HiPR-FISH requires only a single round of imaging on a commercial confocal microscope. A single field of view can be imaged in just 5 minutes, much faster than FISH procedures that rely on successive hybridization and imaging rounds35. Consequently, HiPR-FISH is compatible with applications that require fast data acquisition, such as applications in infectious disease diagnosis. For other applications, implementations of HiPR-FISH with multiple rounds of hybridization and imaging can be considered to further increase the multiplexity or improve accuracy through the incorporation of error correction strategies35.
We expect HiPR-FISH will have broad applicability in human health. HiPR-FISH can lead to new avenues for investigations of complex microbial populations in the gut, in the oral cavity, or on implanted devices, which are all known to harbor biofilms. HiPR-FISH can also be applied to study gut-related disorders such as inflammatory bowel diseases, where signaling between microbiota and gut epithelial tissue plays a role in reducing barrier integrity. HiPR-FISH can furthermore enable novel analyses of the role of the microbiota in the initiation and progression of tumors that form at epithelial barrier surfaces, such as colorectal cancers. Last, the quantitative single-cell measurements enabled by HiPR-FISH can become a rich resource for testing soft matter theories of the principles that govern microbial community assembly.
Methods.
Detailed methods are described in the Supplementary Information.
Data availability statement.
PacBio sequencing data is available on NCBI SRA with accession number PRJNA665727. Metagenomic sequencing data of LCM dissected tissue samples is available on NCBI SRA with accession number PRJNA665536. All microscopy data was deposited to Zenodo. See Supplementary Information for a full list of DOIs.
Code availability.
All code is available on Github at github.com/proudquartz/hiprfish.
Methods
Sample collection.
Human plaque biofilm samples were obtained from a volunteer. The study was approved by the Cornell Institutional Review Board (protocol 1910009101). The volunteer provided informed consent. Animal procedures were approved by the Cornell University Institutional Animal Care and Use Committee. Specific-pathogen-free C57BL/6J mice were acquired from the Jackson Laboratory (Bar Harbor, ME, USA) and maintained under barrier conditions in ventilated/autoclaved cages.
Bacterial cell culture.
All cultured cells were inoculated from frozen stock stored at −80°C into 4 mL of appropriate growth medium. A loopful of the liquid culture was streaked on an appropriate agar plate. A single colony from the agar plate was inoculated into an appropriate liquid medium and grown to roughly mid-exponential phase. Cells were grown using growth media and growth times listed in Supplementary Information Table 3.
Fluorescent readout probes.
Fluorophore conjugated readout probes listed in Extended Data Table 4 were purchased from Integrated DNA Technologies and Biosynthesis.
PacBio Sequencing.
Metagenomic DNA from plaque samples were extracted using the QIAamp DNA Mini Kit according to the manufacturer’s protocol. Ribosomal DNA was amplified from the extracted metagenomic DNA using the universal primers for the 16S rRNA listed in Supplementary Information Table 5, cleaned with the MinElute PCR purification Kit according to manufacturer’s protocol, and sequenced on a PacBio RSII or Sequel at the Duke Center for Genomic and Computational Biology. The PacBio sequence data was processed using rDnaTools (https://github.com/PacificBiosciences/rDnaTools), with a threshold of 99% accuracy. The output fasta sequences of the rDnaTools pipeline were used for probe design.
Probe design and synthesis.
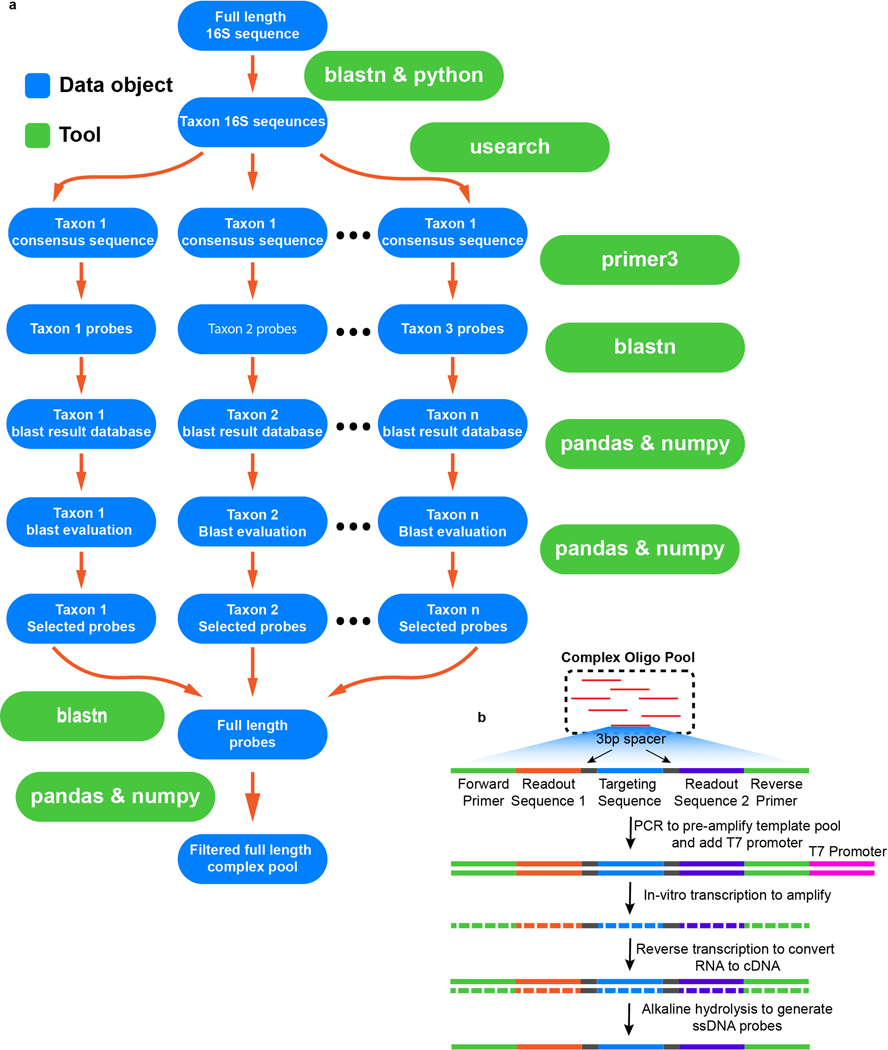
The 16S rRNA sequences for cultured bacteria were generated using Sanger sequencing, while those for environmental samples were generated via PacBio circular consensus sequencing (SMRT-CCS) (11). Probes were designed using a custom pipeline in python, using tools and packages listed in Supplementary Information Table 6. Briefly, the 16S sequences were grouped by taxon and sequence similarity. A consensus sequence was generated for each taxon using usearch. FISH probes for each consensus sequence were designed using primer3. Alternatively, probes were designed from each individual PacBio full length sequence using primer3, and the unique set of probes were selected to proceed to the next stage of probe evaluation. The probes were then blasted against the database containing all 16S sequences from the community using blastn. A maximum continuous homology (MCH) score was calculated for each blast hit. The MCH score was defined as the maximum number of continuous bases that were shared between the query and the target sequence. Only blast hits above a threshold MCH score were considered significant and used for further analysis. The blast on-target rate, taxonomic coverage, and maximum off-target GC count were calculated for each significant blast hit. Blast on-target rate was defined as the ratio between the number of correct blast hits and the total number of significant blast hits. Taxonomic coverage was defined as the ratio between the number of significant blast hits within the target species and the total number of sequences for the target species. The off-target GC count was defined as the number of G or Cs in any homology sequences between a probe and an off-target 16S sequence. Any probe with a blast on-target rate of less than 0.99 or maximum off-target GC count greater than 7 was excluded from the probe set to avoid mis-hybridization. For each taxon, the probe with the highest taxonomic coverage was then selected. Each probe was subsequently concatenated on both ends with 3bp spacers, readout sequences, and primer sequences. The 3bp-long spacers for each probe were taken from the three bases upstream and downstream from the target region on the 16S sequence of the probe. Since these blocking sequences were exactly the same as the target molecules, the blocking regions would not form hydrogen bonds with their corresponding nucleotides on the target molecule, minimizing any steric hindrance that the readout probes might encounter otherwise. For each probe, all blast hits were examined for potential mis-hybridization sites. For each potential mis-hybridization site, a blocking probe complementary to the off-target sequence was included (34). Blocking probes were not conjugated to any readout sequences, and therefore did not contribute any fluorescent signals. The blocking probes were either purchased separately from Integrated DNA Technologies (www.idt.com) in plate format, or included in the complex oligo pool of encoding probes and purchased from CustomArrays (www.customarrays.com). Helper probes were included to improve ribosomal accessibility. All probes designed from primer3 upstream and downstream of the region targeted by the encoding probes were evaluated. The upstream and downstream regions were divided into five blocks, each spanning 20bp nucleotides. At most one probe from each region was selected. This limit was selected to achieve broad coverage upstream and downstream of the encoding region on the target 16S molecule without exceeding the sequence number limit of commercially available complex oligo pools. The complex oligo pool was synthesized following the protocol as previously described (14). Briefly, the complex oligo pool was first PCR amplified to incorporate T7 promoters. The PCR products were purified using a Zymo spin column and used as templates for in vitro transcription. The in vitro transcription reactions were allowed to proceed for 8 hours to overnight. The transcribed mRNAs were subsequently reverse-transcribed for 1 hour at 56C. The DNA-RNA hybrid products were subjected to alkaline hydrolysis for 15 minutes at 95C. The single stranded probes were purified using Zymo spin columns. Finally, the purified probes were ethanol precipitated, washed once in 70% ethanol, and resuspended to 80 μL.
HiPR-FISH on synthetic E. coli communities.
E. coli cells were grown overnight on an LB agar plate. A single colony from the plate was inoculated into 800mL of LB broth supplemented with 40 mL of 1M potassium phosphate buffer and 40 mL of 20% glucose solution. Cells were grown for 7 hours to an OD of 1.1. Cultured cells were fixed for 1.5 hours by the addition of 800 mL of 2% freshly made formaldehyde. Fixed cells were aliquoted into 50mL tubes, concentrated by centrifugation at 4000 RPM for 15 minutes, resuspended in 1X PBS (1 mL per tube), and pooled together into two 50 mL tubes (~16 mL of E. coli suspension each). Cell suspensions were washed 3 times in 1X PBS (50 mL per wash per tube), suspended in 50% ethanol, and stored at −20°C until use. Before the encoding hybridization experiment, cell suspension were treated with lysozyme solution (10 mg/mL in 10 mM Tris-HCl, pH 8) for 30 minutes at 37 C, washed once with 1X PBS, and resuspended in 50% EtOH. Every 9.9 mL of encoding hybridization buffer includes 4 mL of cell suspension resuspended in 5.8 mL of Ultrapure water, 1 mL of 20X SSC, 1 mL of Denhardt’s solution, 2 mL of ethylene carbonate, and 100 μL of 1% SDS. Encoding hybridization buffers were aliquoted into 1.5 mL Eppendorf tubes at 99 μL per tube. Finally, 1 μL of the encoding probe for a barcode was added to each tube. The encoding hybridization suspension was briefly vortexed, incubated at 46°C for 4 hours, washed once in Washing Buffer (215 mM NaCl, 20 mM Tris-HCl, 20 mM EDTA) for 15 minutes at 48°C, washed twice in PBS, and resuspended in 100 μL of 50% EtOH. The 1023-plex synthetic community of barcoded E. coli was generated by mixing together 1 μL of each barcoded E. coli stock. The titrated community was generated first by dividing the 1023 barcodes into 8 groups (7 communities with 128 barcodes each, and one community with 127 barcodes). Each 128-plex or 127-plex titration community was generated by mixing together a variable amount of barcoded E. coli stock. All synthetic community mixes were resuspended in 100 μL of 50% EtOH.
HiPR-FISH on synthetic multi-species microbial communities.
Cultured cells were fixed by adding an equal volume of 2% freshly made formaldehyde to the liquid culture for 1.5 hours. Fixed cells were washed 3 times in 1X PBS, permeated in absolute ethanol for 15 minutes, suspended in 50% ethanol, and stored at −20°C until use. For each species control experiment, 1 μl of 1 to 10 diluted pure culture was deposited onto an UltraStick slide and air dried. Cell walls were permeated by deposition of 20 μL of 10 mg/ml lysozyme suspended in 10 mM Tris-HCl onto the slide and incubation at 37°C for 3 hours. After lysozyme digestion, the slides were washed in 1X PBS for 15 minutes, dipped in pure ethanol, briefly rinsed with pure ethanol to remove any residual PBS, and air dried. The encoding hybridizations were performed in a 9 × 9 mm Frame-Seal hybridization chamber with 18 μl encoding hybridization buffers per slide at 46°C for 6 hours. The slides were then washed in the Washing Buffer at 48°C for 15 minutes, dipped in room temperature pure ethanol, rinsed with pure ethanol, and air dried. Readout hybridizations were carried out at 46°C for 1 hour. The slides were washed and dried as described above and embedded in 15–30 μl Prolong Gold Anti-fade embedding medium.
HiPR-FISH on human oral biofilm samples.
Subgingival plaque was collected using a stainless-steel dental pick, gently deposited into 1 mL of 50% ethanol, and stored at 4°C until use. For each human plaque experiment, 20 μL of plaque material was deposited onto an UltraStick slide and air dried. The slides were then fixed in 2% freshly made formaldehyde for 1.5 hours or overnight, washed in 1X PBS for 15 minutes, dipped in pure ethanol, rinsed with pure ethanol, and air dried. Lysozyme digestion, encoding, and readout hybridizations were carried out as described above.
HiPR-FISH on mouse tissue.
Mice received the antibiotics at 6 weeks of age. Mice in the treatment groups received one dose of Ciprofloxacin (10 mg/kg) via oral gavage or Clindamycin (10 mg/kg) via intraperitoneal (IP) injection while the remaining sham-antibiotic groups received acidified water or PBS in 200 L volume. Mice were sacrificed with carbon dioxide at 7 days post antibiotic treatment for tissue collections. The entire digestive tracts posterior to the stomach were fixed in Carnoy’s solution (60% ethanol, 30% chloroform, and 10% glacial acetic acid) for 48 hours at room temperature. Fixed tissues were rinsed three times in ethanol and stored in 70% ethanol at −20°C until paraffin embedding and sectioning. Tissues were embedded in paraffin and sectioned to 5 μm thickness. For deparaffinization, tissue sections on glass slides were incubated at 60°C for 10 minutes, washed once in xylene substitute for 10 minutes, once in xylene substitute at room temperature for 10 minutes, once in ethanol at room temperature for 5 minutes, and air dried. To reduce autofluorescence, deparaffinized slides were washed with 1% sodium borohydride in 1X PBS on ice for 30 minutes, with a buffer change every 10 minutes, followed by three washes in 1X PBS on ice for 5 minutes each. Slides were briefly dipped in ethanol and allowed to air dry. Lysozyme digestion, encoding, and readout hybridization were carried out as described above.
Laser capture microdissection and metagenomic sequencing on mouse gut tissue.
FFPE tissue blocks were sectioned using standard protocol, with blade changes between each tissue block to minimize cross contamination. Zeiss LCM Membrane Slides were pretreated under UV light for 30 minutes. Sectioned tissues were then placed on sterilized LCM Membrane Slides and stored at room temperature until laser capture microdissection. Biofilm tissue sections from the FFPE tissues were cut and catapulted into capture tubes. For each tissue section, multiple regions were cut and collected to ensure adequate starting material for library preparation. DNA was extracted using Qiagen DNA FFPE Tissue kit following the manufacturer’s protocol. Extracted DNA was repaired using NEBNext DNA Repair Mix following the manufacturer’s protocol. Sequencing libraries were prepared using the NEBNext Ultra DNA Library Prep kit following the manufacturer’s protocol. Prepared libraries were sequenced on an Illumina NextSeq run. Adaptor sequences were trimmed using Trim Galore with default parameters. Low complexity reads were removed using prinseq-lite with parameters -lc_method entropy -lc_threshold 70. Human and mouse host contaminant reads were removed sequentially using bbmap with parameters minid=0.95 maxindel=3 bwr=0.16 bw=12 quickmatch fast minhits=2. Contigs were assembled using metaspade with default parameters. Reads were mapped to assembled contigs using bwamem. Reads with mapping quality below 30 were removed from further analysis. Contigs were blasted against the NCBI nt database using blastn. The length of the corresponding genome for each contig blast result was retrieved using epost, summary, and xtract. Genomic equivalent abundance was estimated as read counts mapped to each contig normalized by the genome length corresponding to that contig.
Spectral imaging.
Spectral images were recorded on an inverted Zeiss 880 confocal microscope equipped with a 32-anode spectral detector, a Plan-Apochromat 63X/1.40 Oil objective, and excitation lasers at 405 nm, 488 nm, 514 nm, 561 nm, and 633 nm, using acquisition settings listed in Supplementary Information Table 7–9. The microscope is controlled using ZEN 3.2.
Flat field correction.
One microliter of each readout probe was added to 90 μl of ProLong Glass embedding medium. The solution was vortexed and briefly centrifuged. Finally, 15 μL of the mixture was deposited onto an UltraStick slide, and a #1.5 coverslip was gently placed on top of the embedding medium. The flat field correction slide cured in the dark overnight and was imaged using the acquisition settings in Supplementary Information Table 5. Two fields of view of the flat field correction slide were averaged to generate the flat field correction image.
Photon counting and barcode prediction error rate simulation.
E. coli cells were imaged on an inverted Zeiss 880 confocal microscope under photon counting mode. Laser power and pixel dwell time were reduced until no photon bunching occurred to enable accurate photon counting. Images were segmented, and photon counts per pixel were calculated for each cell. To simulate effects of ribosome density, the number of photons that would be collected in each spectral bin was multiplied by a dilution factor, and imaging noise was simulated using Poisson statistics. 1000 spectra per barcode per dilution factor were simulated, resulting in 7.16 million spectra in total.
Ribosome density estimation.
Ribosome density was conservatively estimated by assuming that at each voxel, each photon emission event corresponds to an individual ribosome. The total number of ribosome for each cell was then estimated to be, where was the volume of a cell, was the volume of a voxel, and was the measured number of photons per voxel.
Reference spectra simulation, measurement, and classification.
The reference spectrum for each barcode was measured using E. coli cells encoded with the corresponding barcode. For each barcode, around 300 – 500 single cell spectra in a single field of view were recorded. For each barcode, the mean and covariance of the spectra was computed and used to simulate 1000 new spectra. Linear ramps were applied to the emission spectra to simulate the effect of FRET. These spectra were added to the database of reference spectra. All simulated spectra were used to train a generalized classification scheme using a combination of Uniform Manifold Approximation and Projection (UMAP) and support vector machine (SVM) (Extended Data Fig. 2). Spectra were first projected onto three dimensions using UMAP with a custom excitation-channel-wise cosine distance metric. A support vector machine (SVM) trained on the three-dimensional representation of the reference spectra was then used for de novo barcode prediction. For each cell, the emission spectra, was measured, where for 7-bit experiments and for 10-bit experiments. In the first stage, SVMs were trained to ascertain whether there was fluorescence signal in a given single-cell spectrum acquired using each of the lasers, which was denoted as channel signatures,. The channel signatures were appended to the spectra as additional features to be used in UMAP projection. In the UMAP projection, a custom metric was defined using excitation-laser-dependent cosine distance (Eq. 1).
| Eq. 1 |
Given two spectra, the channel signatures were compared first. Spectra with different channel signatures were assigned the maximum distance of 1. For spectra with the same channel signature, cosine distances were calculated, each corresponding to a cosine distance between spectra excited by the same laser. The final distance was calculated to be the average of all channel-specific cosine distances. For synthetic communities and environmental microbiomes, reference spectra were simulated using only the spectra of individual fluorophores, taking into account Förster resonance energy transfer (FRET). For each fluorophore pair, the Förster distance was calculated using the emission spectra of the donor fluorophore and excitation spectra of the receptor fluorophore (Eq. 2). In Eq. 2, is the Förster distance, is the dipole orientation factor, is the donor fluorescence quantum yield, is the index of refraction, is the donor emission spectrum, is the wavelength-dependent receptor extinction coefficient, and is the wavelength.
| Eq. 2 |
To simulate FRET effects between multiple fluorophores, an advanced FRET model was adapted to take into account FRET cascade, limited exciton effects, and excitation-dependent fluorophore quenching. For each donor-acceptor pair, the dimensionless fret number for a given physical distance between the donor and the receptor was calculated using Eq. 3. The fret numbers were used to calculate the ensemble FRET efficiency for a given donor in the presence of multiple acceptors with Eq. 4, where is the gamma function.
| Eq. 3 |
| Eq. 4 |
| Eq. 5 |
| Eq. 6 |
| Eq. 7 |
| Eq. 8 |
| Eq. 9 |
| Eq. 10 |
| Eq. 11 |
The molar extinction coefficient for each combination of fluorophore-laser pairs (Eq. 5) as well as donor-acceptor pairs (Eq. 6) was then calculated. These molar extinction coefficient matrices were used to calculate the photon absorption probabilities under direct excitation (Eq. 7) and FRET transfer (Eq. 8).The ensemble fluorescence of a fluorophore was calculated using Eq. 9, where was the FRET sensitized fluorescence and can be calculated using Eq. 10 and 11.
Cultured cell imaging.
For each field of view, spectral images were collected at five excitation wavelengths and concatenated to form 95-channel images. The pixel size was 70 nm x 70 nm to ensure sampling at ≥ Nyquist frequency at all five excitation wavelengths. Each field of view was 2000 × 2000 pixels in size, corresponding to a physical size of 135 μm x 135 μm. The confocal pinhole was set to 1 Airy unit for all image acquisitions.
Biofilm imaging.
Biofilms were imaged using the same spectral setting as described above except for the laser power. All laser powers were changed by a common factor as necessary to compensate for the overall lower intensity of environmental microbiome samples. For biofilm experiments, only the 488 nm, 514 nm, 561 nm, and 633 nm lasers were used. The pixel size was 70 nm x 70 nm to ensure sampling at ≥Nyquist frequency. For z-stack images, the confocal pinhole was set to 1 Airy unit for each excitation wavelength used and a 150 nm step size along the optical axis was used, ensuring ≥ Nyquist sampling in the axial direction as well.
Image processing for cultured cells.
Images acquired with each excitation laser were concatenated, registered, and denoised using non-local means or a convolution neural network. Denoised images were segmented using the watershed algorithm. Objects smaller than 60 pixels or objects with a maximum spectral intensity less than 75% of the mode of the maximum spectral intensity across all cells were removed and excluded from further analysis. For each cell, an average spectrum was calculated and assigned to the corresponding barcode using the spectra classification scheme described above.
Image processing for biofilm samples.
Biofilm images were acquired with each excitation laser. For volumetric images, multiple volumes of the same field of view were acquired with short pixel dwell time at low signal-to-noise ratio to reduce stage-drift induced motion blur. Raw volumes were computationally aligned to generate an average volume with minimal stage drift artefacts and high signal-to-noise ratio. For each voxel in the aligned volume, the line profile was extracted in multiple directions passing through the voxel under consideration. The structuring elements for the line profiles were parameterized by the azimuthal angle and polar angle. For 2D images, the azimuthal angle was set to zero. Each line profile was rescaled to the range [0,1], and the quartile coefficient of variation was calculated for each voxel. To produce the preprocessed image, the neighbor profile image was voxel-wise multiplied with the (1-quartile coefficient of variation). To distinguish signal pixels from background voxels in the pre-processed image, k-means clustering with k = 2 was used. A binary opening function was applied to the image to remove any residual connections between neighboring objects that have a small number of connecting voxels. Objects that were less than 10 pixels in size were excluded for further analysis to remove spuriously segmented objects in the background, and binary filling functions were used to fill in any holes in the segmented objects. Finally, the objects in the resulting image were labeled and served as the seed image for the watershed algorithm. To generate a mask image for watershed, the natural log of the raw volume averaged along the spectral axis was computed and k-means clustering with k = 2 was implemented to distinguish cells from the background. The intensity image for the watershed algorithm was simply the enhanced image. Finally, watershed segmentation was implemented using the intensity image, seed image, and the mask image generated above. Alternatively, 3D segmentations can be generated by concatenating 2D segmentations of each z-slice. For 3D volumes that were acquired with high signal-to-noise ratio (larger stage drift during acquisition), k-means clustering with k = 3 was used to distinguish signal pixels from background pixels in the pre-processed image.
Spatio-spectral detection of under-segmented objects.
The spatial variation of spectral properties for objects consisting of two or more spectral barcodes was used to enable detection of under-segmented objects. The geometric centroid of the objects were first calculated using standard image processing functions in skimage. Subsequently, for each spectral channel, the spectral centroid was calculated, where the coordinate of each pixel was weighted by its associated spectral intensity. The spectral centroid for each spectral channel was calculated. The distance between the spectral centroid and the geometric centroid as a function of the spectral channel was then calculated. For objects with a pure barcode, the spectral centroid was aligned with the geometric centroid up to imaging noise, regardless of the spectral channel under consideration. For objects with multiple spectral barcodes (i.e., under-segmented), the spectral centroid deviated relative to the geometric centroid as a function of the spectral channel. The distance between the spectral and the geometric centroid was therefore used as a metric to evaluate whether an object was under-segmented. Specifically, the median of the spectral-geometric centroid distances across all spectral channels was used as a filtering criteria. A threshold of 1 pixel was used in the biofilm image analysis.
Technical reproducibility analysis.
To evaluate reproducibility across different fields of view, different FFPE sections, and different mice, the maximum intensity along the spectral axis for every cell was measured. The average maximum intensity for all cells classified to a given barcode was then calculated. Finally, the Pearson correlation between the average maximum intensity for all the barcodes measured in different fields of view was calculated. This analysis was performed for images acquired from two different tissue sections from a ciprofloxacin-treated mouse (15 fields of view per tissue section), as well as for tissue sections from two ciprofloxacin treated mice and two control mice (one tissue section per mouse, 14 to 15 fields of view per tissue section).
Spatial ecology analysis.
The Shannon diversity was calculated using the standard formula of , where was the relative abundance of each taxa. To calculate the Bray-Curtis dissimilarity between patches of cells, a pair of random points within an image area was first generated. For each point, the nearest n cells were located (n ranged from 10 to 200), and the center of the patch was calculated as the mean of the centroids of the individual cells belonging to the patch. The Bray-Curtis dissimilarity between the two patches was then calculated using scipy.spatial.distance.braycurtis. To calculate the beta diversity of a small patch of cells relative to an image, a random point within the image was selected and the closest n cells to that point were located. The alpha diversity of the entire image and the alpha diversity of the patch ɑp were then calculated. The beta diversity of the patch was then calculated as.
Spatial association analysis.
To enable spatial association analysis, an adjacency segmentation was generated using the watershed algorithm, but with the raw image averaged over the spectral axis as the intensity image. This approach produced a segmentation where objects were in contact with each other, which enabled the calculation of region adjacency graphs. Objects that were within areas labeled as host tissue, objects that were too large to be cells (area greater than 1000 pixels for the mouse gut and 10000 pixels for the oral microbiome), or objects that have a raw cosine spectra distance of greater than 0.02 were filtered out from further analysis. The spatial association matrix was calculated using the region adjacency graph. Each spatial association matrix element corresponded to the number of association instances between any two taxa. To calculate differential spatial association matrices between antibiotics treatment and control, the spatial association of images under each treatment was first compared to a random spatial association network. The random spatial association network for each image was generated by shuffling the assigned barcode to each cell while keeping the abundance of each taxon the same as the measured image. For each image, 100 random spatial association networks were simulated. The spatial association enrichment was calculated as the fold change of the measured spatial association network against the average of the simulated random matrices. Finally, the differential spatial association matrix was calculated as the ratio between the spatial association enrichment for ciprofloxacin treated mice and those of the control mice. To calculate the significance of the observed differential spatial association, the differential spatial associations measured from each field of view were used as independent measurements. The log2 transformed differential spatial association from each image of ciprofloxacin treated mice was compared to those from the control mice using an independent t-test. The significance threshold was corrected for multiple hypotheses testing using the Bonferroni criteria. The number of hypotheses tested was calculated as the number of unique genus-genus interactions detected across all images. For longitudinal comparison of the oral plaque microbiome spatial association networks, the spatial association enrichments against random networks with the same taxa abundance were calculated as above. The average of all simulated random spatial association matrices was used as a benchmark of comparison. The difference between two spatial association matrices were calculated using the Frobenius distance (element-wise squared difference).
Super-resolution image straightening.
To straighten the super-resolution images, a segmentation mask was first generated from the raw image using k-means clustering with 2 clusters. A gaussian filter with a kernel size of 20 pixels was then used to broaden the segmented area, and a k-means clustering with 3 components to separate foreground pixels from the background. This step ensured that the segmentation masks were extended well beyond the cell, so that edges of the cells in the super-resolution images remained intact. The medial lines of the segmentation masks were then calculated. The medial lines were extended in the forward and reverse directions to capture the poles of the cell. To accomplish this, the gradient of the medial lines were calculated using the first and last five pixels (average of the first order difference between pixel coordinates) and used to extend the medial lines in both directions by 50 pixels (or 10, for smaller circular cells). Interpolated splines were then fit to the medial line coordinates to generate up-sampled medial line coordinates, such that the distance between each successive pixel in the up-sampled coordinates list was 1 pixel. Finally, the straightened image was generated by interpolating the raw image pixel intensity at the up-sampled medial line coordinates.
3D volume rendering.
The 3D datasets were segmented, identified, and assigned false colors as described above. The 4D data cube (xyzc) was then rendered in ipyvolume using linear ramps of RGBA transfer functions.
Extended Data
Extended Data Figure 1. Workflow of HiPR-FISH experiments.
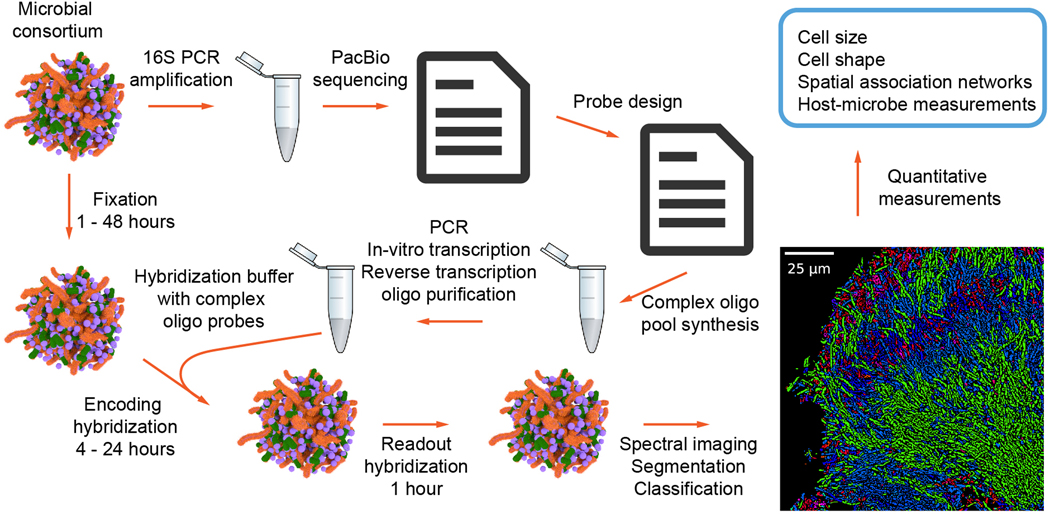
Environmental microbial consortiums are first split into two samples. One sample is used to generate full length 16S amplicon sequences using PCR and PacBio sequencing. The resulting sequence file is used to generate a list of probes, which are purchased from a commercial vendor. The other sample is used for imaging experiments. Fixed samples are hybridized using an encoding hybridization buffer containing the amplified complex probes and read out using a readout hybridization buffer containing fluorescently labeled readout probes. Samples are then embedded and imaged on a standard confocal microscope in the spectral imaging mode. Resulting raw images are registered and segmented. The spectra of individual cells are measured using the raw image and the segmentation image and classified using a machine learning algorithm. Finally, classified images are used for downstream quantitative measurements of microbial spatial associations.
Extended Data Figure 2. Spectra construction and classification.
a, Fluorescence spectra measured using each laser are concatenated for classification. b, Example spectra for two different barcodes. The combined spectra can contain distinct peaks or broad peaks, depending on the fluorophores used for each barcode. c, Spectra for the 10 fluorophores used in this study. d, Classification algorithm for barcode assignment. Concatenated spectra are projected using UMAP before classified using support vector machines.
Extended Data Figure 3. Classification accuracy for E. coli 1023-plex barcoding experiment.
a, Classification frequency as a function of hamming distance for all 1023 barcodes. Insets show barcodes with detectable error (in orange) and an example of a barcode with no detectable error (in blue). b & c, Photon counting measurements for Alexa 488 for each pixel (b) and across each cell (c). d, Signal-to-noise ratio calculated using Poisson statistics for the E. coli cells under nominal experimental imaging conditions. e, Simulated classification error as a function of ribosomal density within individual cells. In (b) and (c), the center lines show the median value, the bounds of the boxes correspond to 25th and 75th percentile, and the whiskers extend to 1.5 interquartile range.
Extended Data Figure 4. Probe design pipeline and amplification strategy.
a, Full length 16S sequences are first grouped by taxa. The consensus sequence for each taxon is used to design probes. Each probe within each taxon is then blasted against the database of full length 16S sequences. Several probe quality metrics are calculated based on the blast results and are used to select probes. All selected probes are conjugated to the appropriate readout sequences and blasted against the database of full length 16S sequences to remove probes with any potential mis-hybridization sites due to the conjugation of the readout sequences. b, Schematic for probe synthesis. Complex oligo pools are amplified using limited cycle PCR. The T7 promoter introduced during PCR allows the templates to be in-vitro transcribed. Reverse transcription then converts RNA to cDNA. Finally, alkaline hydrolysis removes the RNA strand to generate the final single stranded DNA probe pool.
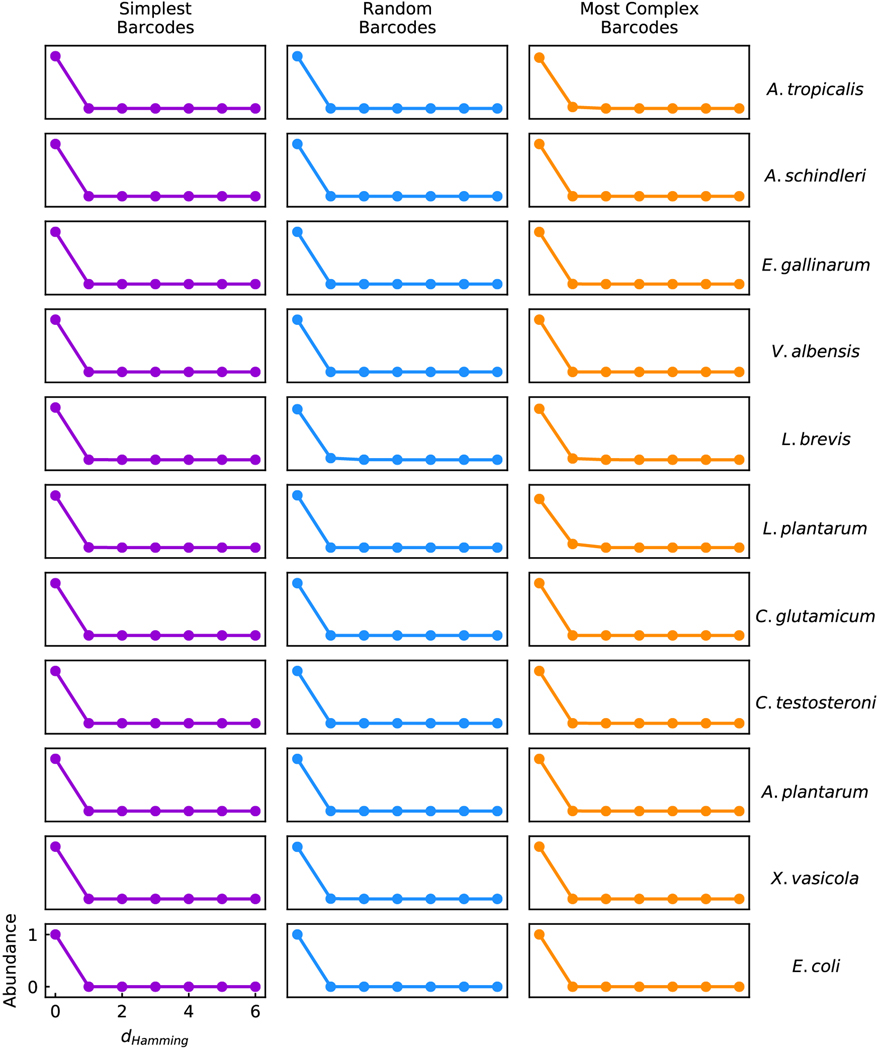
Extended Data Figure 5. Classification accuracy in synthetic communities.
The classification accuracy as a function of hamming distance for each species of bacteria measured using different barcodes.
Extended Data Figure 6. Image segmentation workflow and comparison to other methods.

a, A typical raw image of a human plaque biofilm sample averaged along the spectral axis was enhanced using the LNE algorithm before segmentation using the watershed algorithm. Spectra of segmented cells were then used to generate the identification image. Scalebar: 25 μm. b, Examples of segmentation comparisons between LNE and existing methods. Scalebar: 25 μm. c, Enlarged views highlight advantages of LNE over existing methods at segmenting closely packed cells. Scalebar: 5 μm.
Extended Data Figure 7. LNE can segment objects with diverse shapes in images collected using different modalities.
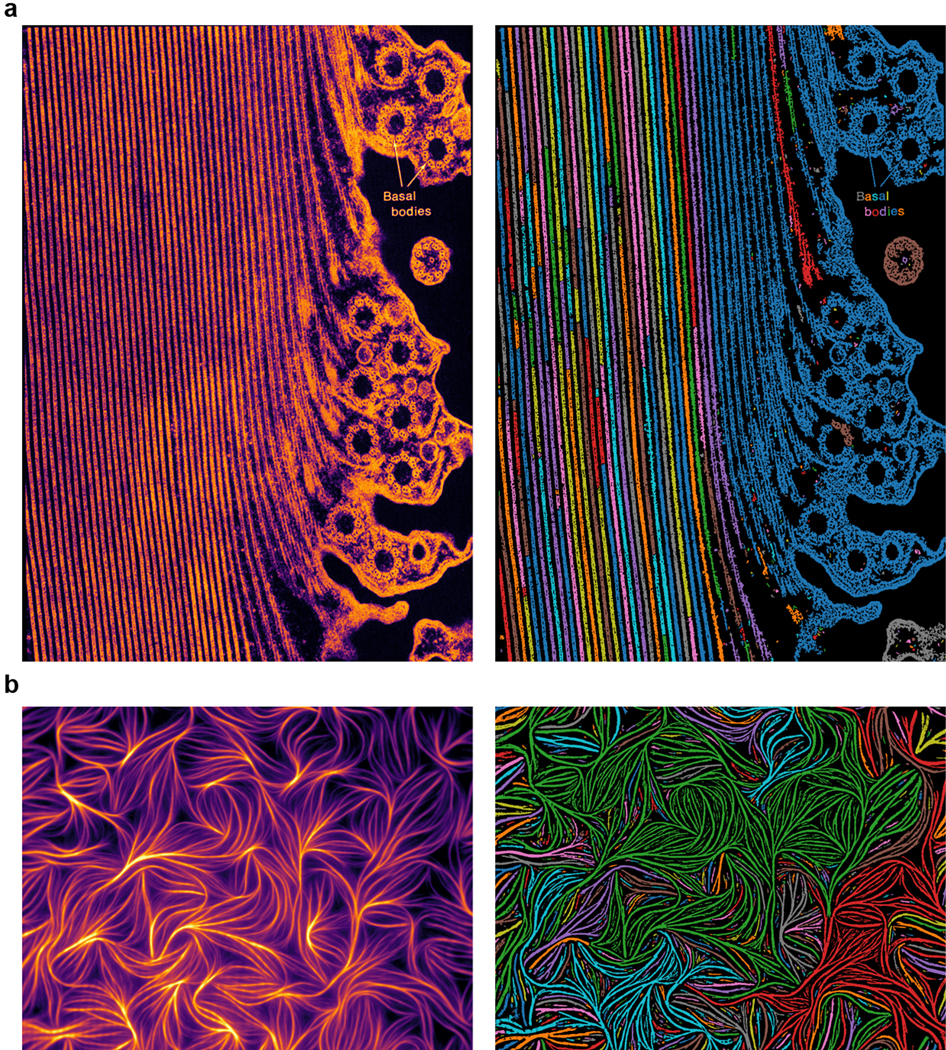
a, Raw (left) and segmented (right) images of a longitudinal section of a Km fiber in a partially contracted Stentor coeruleus imaged using transmission electron microscopy. b, Raw (left) and segmented (right) images of fluorescently-labeled actin bundles from chicken muscle imaged using total internal reflection microscopy. Source images are from the Cell Image Library.
Extended Data Figure 8. Spatio-spectral deconvolution accuracy of simulated merged objects.
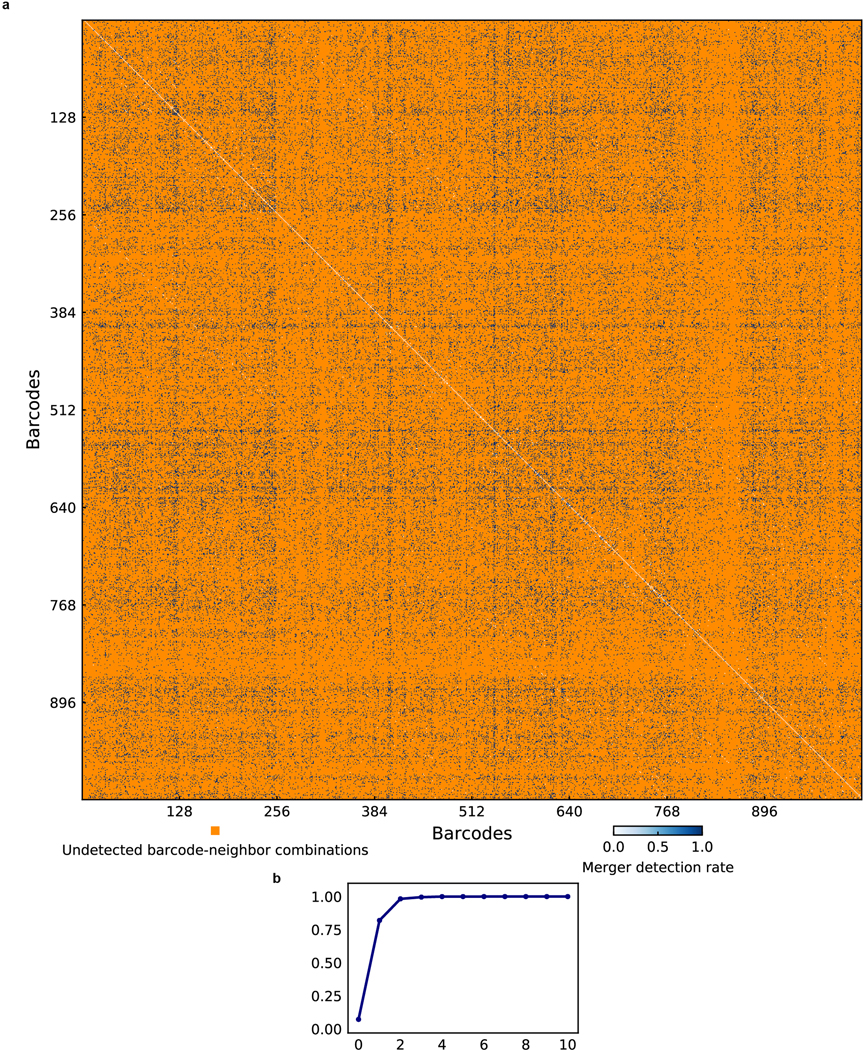
a, Heatmap of merger detection rates across all 10-bit barcode combinations. Barcode-neighbor combinations not detected in the 1023-plex E. coli mixing experiment are shown in orange. The diagonal corresponds to the correct identification of merged objects with the same barcode as single objects. b, Merger detection rate as a function of hamming distance. The spatio-spectral deconvolution approach can detect 99.6% of all objects with spatially varying barcodes that are more than 1 bit away.
Extended Data Figure 9. Additional analysis of the gut microbiome images.
a, Heatmap of the Pearson correlation between maximum average intensity for all detected barcodes from different FFPE sections of the same mouse gut, with 15 fields of view per FFPE section. b, Heatmap of Pearson correlation between maximum average intensity for all detected barcodes from different mice, with 14 to 15 fields of views per mouse. c, Comparison of imaging and sequencing measurements on mouse gut FFPE tissue sections. d, Phylum abundance measurements from images of a clindamycin-treated mouse compared to a control mouse. The clindamycin-treated mouse shows a lower Bacteroidetes to Firmicutes ratio compared to the control. e, Measured Shannon diversity is lower in the clindamycin-treated mouse compared to the control mouse. The center lines show the median value, the bounds of the boxes correspond to 25th and 75th percentile, and the whiskers extend to 1.5 interquartile range. f, Beta diversity as a function of patch size shows similar trends between the clindamycin-treated and the control mouse. The boxes correspond to 25th and 75th quartile, and the whiskers extend to the most extreme data points. g, Bray-Curtis dissimilarity increases as a function of intra-patch distance in both the clindamycin-treated and the control mice. h, Volcano plot of significance versus spatial association fold change between ciprofloxacin-treated mice and control mice. Altered spatial associations that are statistically significant after Bonferroni correction are listed.
Extended Data Figure 10. Reproducible and recurrent microarchitectures in the oral microbiome.
a, Clusters of Lautropia cells observed using different probe panels. b. 2D UMAP projections of the physical properties of Lautropia cells observed using different probe panels overlap in the reduced dimensions. c, Additional observed instances of the Pseudopropionibacterium-Cardiobacterium-Schwartzia consortium.
Supplementary Material
ACKNOWLEDGEMENTS
We thank Rebecca M. Williams and Johanna M. Dela Cruz for assistance with microscopy. We thank Angela Douglas, John McMullen, Tobias Doerr, Joseph Peters, and Mike Petassi for generously providing materials. We thank Phillip S. Burnham, Alexandre P. Cheng, Ti-yen Lan, and Elena Michel for discussions and feedback. This work was supported by an instrumentation grant from the Kavli Institute at Cornell, US National Institute of Health (NIH) grant 1DP2AI138242 to IDV, and 1R33CA235302 to I.D.V., W.Z., and I.B. Imaging data was acquired in the Cornell BRC-Imaging Facility using the shared, NYSTEM (CO29155)- and NIH (S10OD018516)-funded Zeiss LSM880 confocal/multiphoton microscope.
Footnotes
COMPETING INTERESTS
H.S. and I.D.V. are inventors on a patent application submitted by Cornell University Center for Technology Licensing.
REFERENCES
- 1.Donaldson GP, Lee SM & Mazmanian SK Gut biogeography of the bacterial microbiota. Nat. Rev. Microbiol 14, 20–32 (2016). [DOI] [PMC free article] [PubMed] [Google Scholar]
- 2.Huttenhower C et al. Structure, function and diversity of the healthy human microbiome. Nature 486, 207–214 (2012). [DOI] [PMC free article] [PubMed] [Google Scholar]
- 3.Tropini C, Earle KA, Huang KC & Sonnenburg JL The Gut Microbiome: Connecting Spatial Organization to Function. Cell Host Microbe 21, 433–442 (2017). [DOI] [PMC free article] [PubMed] [Google Scholar]
- 4.Mark Welch JL, Rossetti BJ, Rieken CW, Dewhirst FE & Borisy GG Biogeography of a human oral microbiome at the micron scale. Proc. Natl. Acad. Sci. U. S. A 113, E791–800 (2016). [DOI] [PMC free article] [PubMed] [Google Scholar]
- 5.Valm AM et al. Systems-level analysis of microbial community organization through combinatorial labeling and spectral imaging. Proc. Natl. Acad. Sci. U. S. A 108, 4152–4157 (2011). [DOI] [PMC free article] [PubMed] [Google Scholar]
- 6.Valm AM, Mark Welch JL & Borisy GG CLASI-FISH: Principles of combinatorial labeling and spectral imaging. Syst. Appl. Microbiol 35, 496–502 (2012). [DOI] [PMC free article] [PubMed] [Google Scholar]
- 7.De Weirdt R & Van De Wiele T. Micromanagement in the gut: Microenvironmental factors govern colon mucosal biofilm structure and functionality. npj Biofilms Microbiomes 1, 15026 (2015). [DOI] [PMC free article] [PubMed] [Google Scholar]
- 8.Mark Welch JL, Rossetti BJ, Rieken CW, Dewhirst FE & Borisy GG Biogeography of a human oral microbiome at the micron scale. Proc. Natl. Acad. Sci 113, E791–E800 (2016). [DOI] [PMC free article] [PubMed] [Google Scholar]
- 9.Thaiss CA et al. Microbiota Diurnal Rhythmicity Programs Host Transcriptome Oscillations. Cell 167, 1495–1510 (2016). [DOI] [PubMed] [Google Scholar]
- 10.Valm AM, Oldenbourg R & Borisy GG Multiplexed spectral imaging of 120 different fluorescent labels. PLoS One 11, e0158495 (2016). [DOI] [PMC free article] [PubMed] [Google Scholar]
- 11.Mark Welch JL, Hasegawa Y, McNulty NP, Gordon JI & Borisy GG Spatial organization of a model 15-member human gut microbiota established in gnotobiotic mice. Proc. Natl. Acad. Sci 114, E9105–E9114 (2017). [DOI] [PMC free article] [PubMed] [Google Scholar]
- 12.Earle KA et al. Quantitative Imaging of Gut Microbiota Spatial Organization. Cell Host Microbe 18, 478–488 (2015). [DOI] [PMC free article] [PubMed] [Google Scholar]
- 13.Dagher M, Kleinman M, Ng A & Juncker D. Ensemble multicolour FRET model enables barcoding at extreme FRET levels. Nat. Nanotechnol 13, 925–932 (2018). [DOI] [PubMed] [Google Scholar]
- 14.Otsu N. A Threshold Selection Method from Gray-Level Histograms. IEEE Trans. Syst. Man. Cybern 9, 62–66 (1996). [Google Scholar]
- 15.Sauvola J & Pietikäinen M. Adaptive document image binarization. Pattern Recognit. 33, 225–236 (2000). [Google Scholar]
- 16.Francino MP Antibiotics and the human gut microbiome: Dysbioses and accumulation of resistances. Front. Microbiol 6, 1543 (2016). [DOI] [PMC free article] [PubMed] [Google Scholar]
- 17.Samad T, Co JY, Witten J & Ribbeck K. Mucus and Mucin Environments Reduce the Efficacy of Polymyxin and Fluoroquinolone Antibiotics against Pseudomonas aeruginosa. ACS Biomater. Sci. Eng 5, 1189–1194 (2019). [DOI] [PMC free article] [PubMed] [Google Scholar]
- 18.Antonopoulos DA et al. Reproducible community dynamics of the gastrointestinal microbiota following antibiotic perturbation. Infect. Immun 77, 2367–2375 (2009). [DOI] [PMC free article] [PubMed] [Google Scholar]
- 19.Panda S et al. Short-term effect of antibiotics on human gut microbiota. PLoS One 9, e95476 (2014). [DOI] [PMC free article] [PubMed] [Google Scholar]
- 20.Li J et al. Probiotics modulated gut microbiota suppresses hepatocellular carcinoma growth in mice. Proc. Natl. Acad. Sci. U. S. A 113, E1306–E1315 (2016). [DOI] [PMC free article] [PubMed] [Google Scholar]
- 21.Scheiman J et al. Meta-omics analysis of elite athletes identifies a performance-enhancing microbe that functions via lactate metabolism. Nat. Med 25, 1104–1109 (2019). [DOI] [PMC free article] [PubMed] [Google Scholar]
- 22.Dewhirst FE et al. The human oral microbiome. J. Bacteriol 192, 5002–5017 (2010). [DOI] [PMC free article] [PubMed] [Google Scholar]
- 23.Rasiah IA, Wong L, Anderson SA & Sissons CH Variation in bacterial DGGE patterns from human saliva: Over time, between individuals and in corresponding dental plaque microcosms. Arch. Oral Biol 50, 779–787 (2005). [DOI] [PubMed] [Google Scholar]
- 24.Costello EK et al. Bacterial community variation in human body habitats across space and time. Science (80-. ). 326, 1694–1697 (2009). [DOI] [PMC free article] [PubMed] [Google Scholar]
- 25.Li K, Bihan M & Methé BA Analyses of the Stability and Core Taxonomic Memberships of the Human Microbiome. PLoS One 8, e63139 (2013). [DOI] [PMC free article] [PubMed] [Google Scholar]
- 26.Zhou Y et al. Biogeography of the ecosystems of the healthy human body. Genome Biol. 14, R1 (2013). [DOI] [PMC free article] [PubMed] [Google Scholar]
- 27.Baddour LM et al. Infective endocarditis in adults: Diagnosis, antimicrobial therapy, and management of complications: A scientific statement for healthcare professionals from the American Heart Association. Circulation 132, 1435–1486 (2015). [DOI] [PubMed] [Google Scholar]
- 28.Hedberg ME et al. Lachnoanaerobaculum gen. nov., a new genus in the Lachnospiraceae : characterization of Lachnoanaerobaculum umeaense gen. nov., sp. nov., isolated from the human small intestine, and Lachnoanaerobaculum orale sp. nov., isolated from saliva, and reclassifi. Int. J. Syst. Evol. Microbiol 62, 2685–2690 (2012). [DOI] [PMC free article] [PubMed] [Google Scholar]
- 29.Stracy M et al. Live-cell superresolution microscopy reveals the organization of RNA polymerase in the bacterial nucleoid. Proc. Natl. Acad. Sci. U. S. A 112, E4390–E4399 (2015). [DOI] [PMC free article] [PubMed] [Google Scholar]
- 30.Sanamrad A et al. Single-particle tracking reveals that free ribosomal subunits are not excluded from the Escherichia coli nucleoid. Proc. Natl. Acad. Sci. U. S. A 111, 11413–11418 (2014). [DOI] [PMC free article] [PubMed] [Google Scholar]
- 31.Smid MC, Dotters-Katz SK, Plongla R & Boggess KA Leptotrichia buccalis: A novel cause of chorioamnionitis. Infect. Dis. Rep 7, 5801 (2015). [DOI] [PMC free article] [PubMed] [Google Scholar]
- 32.Hou H, Chen Z, Tian L & Sun Z. Leptotrichia trevisanii bacteremia in a woman with systemic lupus erythematosus receiving high-dose chemotherapy. BMC Infect. Dis 18, 661 (2018). [DOI] [PMC free article] [PubMed] [Google Scholar]
- 33.Kraatz M, Wallace RJ & Svensson L. Olsenella umbonata sp. nov., a microaerotolerant anaerobic lactic acid bacterium from the sheep rumen and pig jejunum, and emended descriptions of Olsenella, Olsenella uli and Olsenella profusa. Int. J. Syst. Evol. Microbiol 61, 795–803 (2011). [DOI] [PubMed] [Google Scholar]
- 34.Moffitt JR & Zhuang X. RNA Imaging with Multiplexed Error-Robust Fluorescence in Situ Hybridization (MERFISH). Methods Enzymol. 572, 1–49 (2016). [DOI] [PMC free article] [PubMed] [Google Scholar]
- 35.Chen KH, Boettiger AN, Moffitt JR, Wang S & Zhuang X. Spatially resolved, highly multiplexed RNA profiling in single cells. Science (80-. ). 348, aaa6090 (2015). [DOI] [PMC free article] [PubMed] [Google Scholar]
Associated Data
This section collects any data citations, data availability statements, or supplementary materials included in this article.
Supplementary Materials
Data Availability Statement
PacBio sequencing data is available on NCBI SRA with accession number PRJNA665727. Metagenomic sequencing data of LCM dissected tissue samples is available on NCBI SRA with accession number PRJNA665536. All microscopy data was deposited to Zenodo. See Supplementary Information for a full list of DOIs.


